10168 Sawmill Loop · Alta Sierra, CA
Flood risk 1/10 · Minimal
- FEMA flood zone
- X (unshaded)
- Chance of flooding over 30 yrs
- 0.0%
- Est. flood insurance / yr
- $507 – $1,088
Fire risk 9/10 · Severe
- Est. fire insurance / yr
- $659 – $1,223
Heat risk 5/10 · Moderate
- Hot days now (above 96°F)
- 7 days/yr
- Hot days in 30 yrs
- 16 days/yr
Wind risk 1/10 · Minimal
- Chance of severe wind over 30 yrs
- —
Air-quality risk 10/10 · Severe
- Unhealthy air days now
- 33 days/yr
- Unhealthy air days in 30 yrs
- 40 days/yr
Risk factors via First Street. Map © Google.
Why this score? — see what drove the D+ grade
The composite is a weighted blend of 9 inputs, each scored 0–100. Each bar is that input's sub-score; the figure is the points it added to the 100-point composite (weight × sub-score).
- Cash flow +22.9/30.0
- DSCR +7.3/10.0
- 1% rule +5.9/10.0
- Schools +3.8/10.0
- Livability +3.0/5.0
- Rent growth +2.5/5.0
- Condition / age +2.5/5.0
- ARV discount +0.0/15.0
- Appreciation +0.0/10.0
$230,000
🖨 Deal sheet 📄 Offer letter ✓ Due diligence
Listing remarks
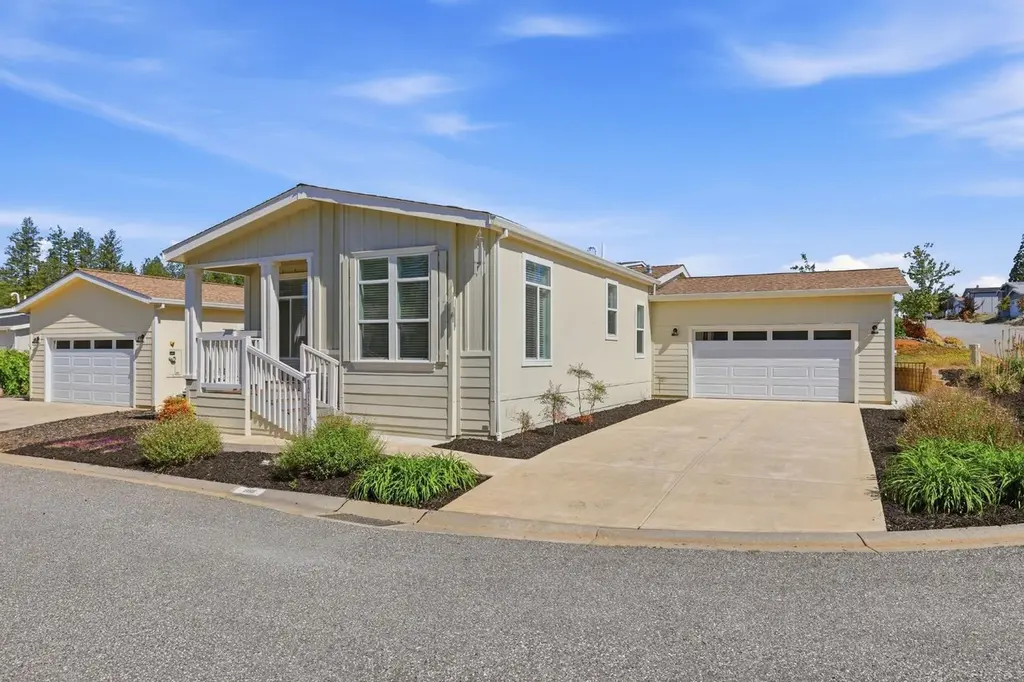
Tucked away at the very back of the highly sought after Forest Springs 55+ community, this beautifully maintained home offers the peaceful foothill lifestyle so many buyers dream about. Surrounded by towering pines and quiet streets, this light filled retreat feels like your own private escape while still being part of an active and welcoming neighborhood. Step inside to discover an open concept floorplan filled with natural light, oversized windows, and warm inviting finishes throughout. The spacious entertainer's kitchen is truly the heart of the home featuring a massive island, quartz countertops, stainless steel appliances, abundant cabinetry, and plenty of room for gathering with famil
Key facts
- Massive island
- Expansive hillside
- Quartz countertops
Tags
Property features AI
Finance
- Financial info: Land lease amount noted as $1,250
- HOA & community: No homeowners association; Located in a senior community; Land lease: No (land lease amount listed separately)
Exterior
- Parking: Attached 2-car garage
- Utilities: Public water; Public sewer; Natural gas connected; Cable available; 220 volts in laundry
- Home design: Manufactured home in a park; Double wide; Built in 2022
- Construction: Wood skirting; Skyline make
- Exterior features: Composition roof; Backyard; Front yard with landscaping; Automatic sprinkler (front & rear); Court location
Interior
- Kitchen: Free standing gas range; Free standing gas oven; Free standing refrigerator; Hood over range; Dishwasher; Disposal; Compactor
- Bedrooms: 3 bedrooms
- Flooring: Carpet; Simulated wood flooring
- Bathrooms: 2 full bathrooms; Tub with shower over; Shower stall(s)
- Heating & cooling: Central heating; Central air conditioning; Ceiling fans
- Interior features: Great room; Porch steps and railed entry; Uncovered deck; Pantry closet; Kitchen island; Stone countertops; Dining/Living combo and formal dining area; Dual-pane windows; Caulked and sealed windows; Pets allowed
- Laundry & utility: Indoor laundry room; 220V outlet in laundry
Neighborhood map
What this means for you Summary
Snapshot
- This is a 3-bed/2.0-bath manufactured listed at $230k.
Deal economics
- At list price, monthly cash flow is $403 ($5k/yr) — positive.
- The deal already cash-flows at list — no discount required.
- Meets the 1% rule at list price ($2k rent vs $230k).
- Recommended offer: $223k (3.0% below list) — sets the bar for market timing.
- Cap rate 8.4% vs local median 3.4% in Alta Sierra — top-decile yield for the area; either an underpriced asset or a hidden risk that comps aren't pricing in. Stress-test before assuming the spread holds.
Location & tenants
- Location reads 59/100 on livability (#662 in CA) — a working-class tenant base; expect higher turnover. Strengths: employment A+, housing A+; Watch: crime C-, schools D+, amenities F.
- Nevada Joint Union High (town): math 25% / reading 61% proficiency, ranked #201 of 517 in CA (top 39%) — families likely to look elsewhere, expect single-tenant / working-renter base with shorter leases.
- Market conditions: 252 active listings in the ZIP; 1 comparable units currently listed for rent nearby; solid renter incomes; 215 units permitted in Nevada County in 2024 (0 in 5+ unit buildings).
- This rent runs 31% of the median local income ($98k/yr) — at the standard rent-burdened threshold; future hikes will face affordability resistance.
Forward outlook
- Local home prices are declining (-3.0%/yr); year-one equity from $2k of loan paydown is wiped out by about $7k of value loss. Plan a longer hold.
- Nevada County population projected at -14% by 2050 — secular population decline; favor cash flow + early exit over multi-decade hold.
Negotiation context
- It's been on market 35 days — a 3% lower offer ($223k) is reasonable based on typical stale-listing flexibility.
Risks & watch-outs
- Climate carrying-cost: severe wildfire risk; extreme-heat days projected 7→16/yr by 2055 (HVAC capex compounding) — expect insurance premiums to compound above CPI over the hold.
Questions for the listing agent
- It's been on market 35 days. Have you received any prior offers? Is the seller open to a 3% concession, seller financing, or rate buy-down credit?
- Is there a deadline driving the sale (1031 exchange, divorce, estate, relocation)? That informs how much negotiation room exists.
- Schools are D-rated, which usually means shorter tenancies and higher turnover. Who's the typical renter profile here, and what's been the actual vacancy rate?
- The area grade is low — what's the realistic commute time and amenity access for the typical tenant pool here? Any planned neighborhood developments (good or bad) we should know about?
- What's the average days-on-market for RENTAL listings here right now (not sales)? A rising rental-DOM trend means longer vacancies and softer asking-rent achievability than the comps imply.
- What's the recent tenant-quality profile in this submarket — average credit score on applications, eviction rate, late-payment / NSF rate, and stable-employment percentage? A property-management company in the area should have these aggregated.
- How much new for-sale + rental construction is in the pipeline within 1–3 miles? Heavy new supply typically softens prices + rents 12–24 months out; constrained supply supports both.
Investment metrics
- 1% rule
- 1.09% ✓
- Cap rate
- 8.39%
- Cash-on-cash
- 7.50%
- DSCR
- 1.33
- GRM
- 7.7
CMA / ARV
- ARV (on-the-fly)
- $158,112
- Comps found
- 12
Show comp detail 12 sales within ~0.75 mi
| Address | Dist | Beds/Ba | Sqft | Sold | Price | $/sf | Match |
|---|---|---|---|---|---|---|---|
| 10024 Golden Shore Dr | 0.07mi | 3/2.0 | 1,566 (-5%) | 0mo | $210,000 | $134 | 88 |
| 10098 Heritage Oak Dr | 0.12mi | 3/2.0 | 1,713 (+4%) | 1mo | $190,000 | $111 | 87 |
| 14867 Hidden Rock Dr | 0.32mi | 3/2.0 | 1,658 (+1%) | 1mo | $186,000 | $112 | 84 |
| 14969 N Country Rd | 0.21mi | 3/2.0 | 1,456 (-12%) | 1mo | $82,500 | $57 | 70 |
| 10131 Shamrock Lode | 0.22mi | 2/2.0 (-1) | 1,488 (-10%) | 1mo | $60,000 | $40 | 68 |
| 10046 Dalewood Way | 0.20mi | 2/2.0 (-1) | 1,440 (-13%) | 2mo | $160,000 | $111 | 62 |
| 10088 Dalewood Way | 0.25mi | 2/2.0 (-1) | 1,440 (-13%) | 0mo | $138,000 | $96 | 62 |
| 10073 Dalewood Way | 0.24mi | 2/2.0 (-1) | 1,440 (-13%) | 1mo | $115,000 | $80 | 62 |
| 10086 Grinding Rock Dr #208 | 0.46mi | 2/2.0 (-1) | 1,536 (-7%) | 1mo | $75,000 | $49 | 61 |
| 10212 Dalewood Way #35 | 0.37mi | 2/2.0 (-1) | 1,800 (+9%) | 4mo | $211,000 | $117 | 59 |
| 10040 Stone Arch Dr | 0.26mi | 2/2.0 (-1) | 1,440 (-13%) | 4mo | $85,000 | $59 | 59 |
| 10124 Hidden Springs Dr | 0.33mi | 2/2.0 (-1) | 1,868 (+13%) | 2mo | $95,000 | $51 | 56 |
Match score weights: distance 35% · size 25% · config 20% · recency 20%. Top-matched comps best support the ARV.
Projected returns pro-forma
-3.0% appreciation · 3.0% rent growth · sell at horizon
- IRR
- -4.8%
- Equity multiple
- 0.82×
- Total profit
- $-11,598
- Equity at exit
- $34,294
- IRR
- 4.9%
- Equity multiple
- 1.36×
- Total profit
- $23,031
- Equity at exit
- $19,886
Cash invested: $64,400 (down + closing). Projections, not guarantees.
Landlord ↔ Tenant lean methodology
- Overall (STATE)
- 18 Strongly Tenant-Friendly
- State California
- 18 Strongly Tenant-Friendly · D+13
- County
- — inherits STATE
- City
- — inherits STATE
ZIP-level market 95949
- Home prices YoY
- -34.7%
- Active inventory
- 252
- Price-to-rent
- 7.7×
Monthly cashflow live
- Estimated rent
- $2,499 medium interval (Pro) →
- Mortgage (P&I)
- −$1,206
- Tax from tax record
- −$269 /mo · $3,232/yr
- Insurance
- −$96
- HOA
- −$0
- Vacancy / Maint / Mgmt
- −$525
- Net cashflow
- $403
Break-even live
UW: 25.0% down · 7.5% · 30yr · 1.5% tax · 5.0% vac · 8.0% maint · 8.0% mgmt
Financing live
Cash to close
- Down payment
- $57,500
- Closing costs
- $6,900
- Reserves months
- —
- Total cash needed
- —
Loan-product check · same deal, 3 products live
Conventional
25% down · 7.5% · 30yr
- Down + closing
- —
- Monthly P&I
- —
- Monthly cashflow
- —
- DSCR
- —
- Eligible?
- —
Personal DTI + credit; lowest rate.
DSCR
20% down · 8.5% · 30yr
- Down + closing
- —
- Monthly P&I
- —
- Monthly cashflow
- —
- DSCR
- —
- Eligible?
- —
No personal income docs; deal must DSCR.
Hard money
10% down · 12.0% · 12mo
- Down + closing
- —
- Monthly P&I
- —
- Monthly cashflow
- —
- DSCR
- —
- Eligible?
- —
Short-term bridge; refi at stabilization.
Rent comps 1 comps
| Address | Beds | Baths | Sqft | Rent | $/sqft | DOM | Units | Dist |
|---|---|---|---|---|---|---|---|---|
| 15487 Kingsbury Cir Grass Valley, CA | 2.0 | 2.0 | 1200 | $2,000 | $1.67 | 3d | 1 | 1.33mi |
Listing history 16 events
-
2026-06-19days on market $230,000 Active 35 DOM
-
2026-06-18days on market $230,000 Active 34 DOM
-
2026-06-17days on market $230,000 Active 33 DOM
-
2026-06-16days on market $230,000 Active 32 DOM
-
2026-06-15days on market $230,000 Active 31 DOM
-
2026-06-13days on market $230,000 Active 29 DOM
-
2026-06-13pricedays on market $230,000 Active 28 DOM
-
2026-06-10days on market $235,000 Active 26 DOM
-
2026-06-09days on market $235,000 Active 25 DOM
-
2026-06-08days on market $235,000 Active 24 DOM
-
2026-06-07days on market $235,000 Active 23 DOM
-
2026-06-05days on market $235,000 Active 20 DOM
-
2026-06-03days on market $235,000 Active 19 DOM
-
2026-06-02days on market $235,000 Active 18 DOM
-
2026-06-01days on market $235,000 Active 17 DOM
-
2026-05-31days on market $235,000 Active 16 DOM
ⓘ Source: listings_history table (triggers on properties + properties_extension) + one-shot
backfill from property_details.listing_events for pre-trigger history.
Tax reassessment forecast CA · Resets to sale price
- Current annual tax
- $3,232 · $269/mo
- Projected year-2 tax
- $3,232 · $269/mo
- Expected delta
- $0/yr ($0/mo · 0.0%)
ⓘ Screening estimate from a state-policy table — verify with the county assessor before closing.
Climate risk First Street
- Flood 1/10 Low FEMA zone X (unshaded) · 0% chance over 30 yrs
- Wildfire 9/10 Extreme
- Heat 5/10 Major 7 d/yr ≥96°F today · 16 d/yr by 30 yrs out
- Wind 1/10 Low
- Air quality 10/10 Extreme 33 unhealthy d/yr today · 40 by 30 yrs out
Nearby sold comps map
Loading sold comps map…
Walkable amenities ~0.75 mi
Loading nearby amenities…
Taxation est. · year 1
- Rental income
- $29,984
- − Mortgage interest
- −$12,884
- − Property taxes
- −$3,232
- − Insurance
- −$1,150
- − Repairs & maintenance
- −$2,399
- − Management
- −$2,399
- − Depreciation
- −$6,691
- Taxable income
- $1,230
- Est. tax owed @ 24.0%
- −$295
- After-tax cash flow
- $4,537/yr
For passive investors: Depreciation is non-cash, so a rental often shows a tax loss while cash-flowing — sheltering income. Rental losses are passive: they offset passive income freely, and up to $25,000/yr can offset ordinary (W-2) income if you actively participate and your MAGI is under $100k (phasing out to $0 by $150k); unused losses carry forward. On sale, claimed depreciation is recaptured at up to 25%, and gains may owe capital-gains tax (a 1031 exchange can defer both). Figures are a year-1 estimate at your 24.0% rate — not tax advice; consult a CPA.
Schools (NCES district)
- District
- Nevada Joint Union High
- NCES district ID
- 0626880
- Math proficiency
- 25% ▼ -14.00%
- Reading proficiency
- 61% ▼ -7.00%
- Median HH income
- $57,336
- Composite
- 37.53/100
- National rank
- #4393
- State rank
- #201 of 517 in CA
Livability — Alta Sierra
- Score
- 59/100
- State rank
- #662
- US rank
- #20497
Category grades
Schools grade is shown separately in the Schools card above.
Census & demographics
- County
- Nevada County · 85,339 people
- Metro
- Truckee-Grass Valley, CA
- Population (ZIP)
- 20,552
- Household income
- $98,181
- Rent vs Own
- Severe rent burden
- 181.0
Population outlook (Nevada County) Hauer SSP2
- Today (2025)
- 98,490 people
- By 2030
- 97,295 · -1.2%
- By 2040
- 92,041 · -6.5%
- By 2050
- 85,164 · -13.5%
- By 2075
- 68,436 · -30.5%
- By 2100
- 49,536 · -49.7%
Race, ethnicity, and origin ACS 2023
- Neighborhood character
- Predominantly White (84%)
- Race & ethnicity
- White 84% Hispanic / Latino 8% Two or more races 8% Native American 1%
- Hispanic origin (detail)
- Mexican 6%
- Common ancestry
- Lithuanian 4% Italian 4% Slovak 2%
- Foreign-born
- 4% · Canada
- Languages at home
- 94% English-only · Spanish 3% Other Indo-European 1%
Political lean MEDSL · Nevada
- 2024 margin
- D (+12.2) · D 54.4% · R 42.1% · Other 3.5%
- 2008→2024 swing
- +6.9pp toward D · 2008: 5.3pp · 2024: 12.2pp
- All cycles
- 2024: D+12.2 2020: D+14.8 2016: D+4.5 2012: R+4.7 2008: D+5.3
Not yet ingested
- Civics
- —
Market trends
- HPI YoY
- ▼ -122.41%
- Current HPI
- 230.2373
- Rent YoY
- —
- Metro
- Truckee-Grass Valley, CA
- State GDP YoY
- ▲ 3.21%
- F500 in state
- 116
Industry mix (Fortune 500 HQ in CA)
| Industry | F500 HQs | Revenue |
|---|---|---|
| Technology | 27 | $1,492B |
|
||
| Financial Services | 3 | $174B |
|
||
| Retail | 3 | $44B |
|
||
| Insurance | 3 | $26B |
|
||
| Media / Entertainment | 2 | $115B |
|
||
| Pharmaceuticals / Biotech | 2 | $62B |
|
||
Cash-flow waterfall
monthlySold comps — $/sqft
last 12 mo · ≤1 miLoading sold comps…