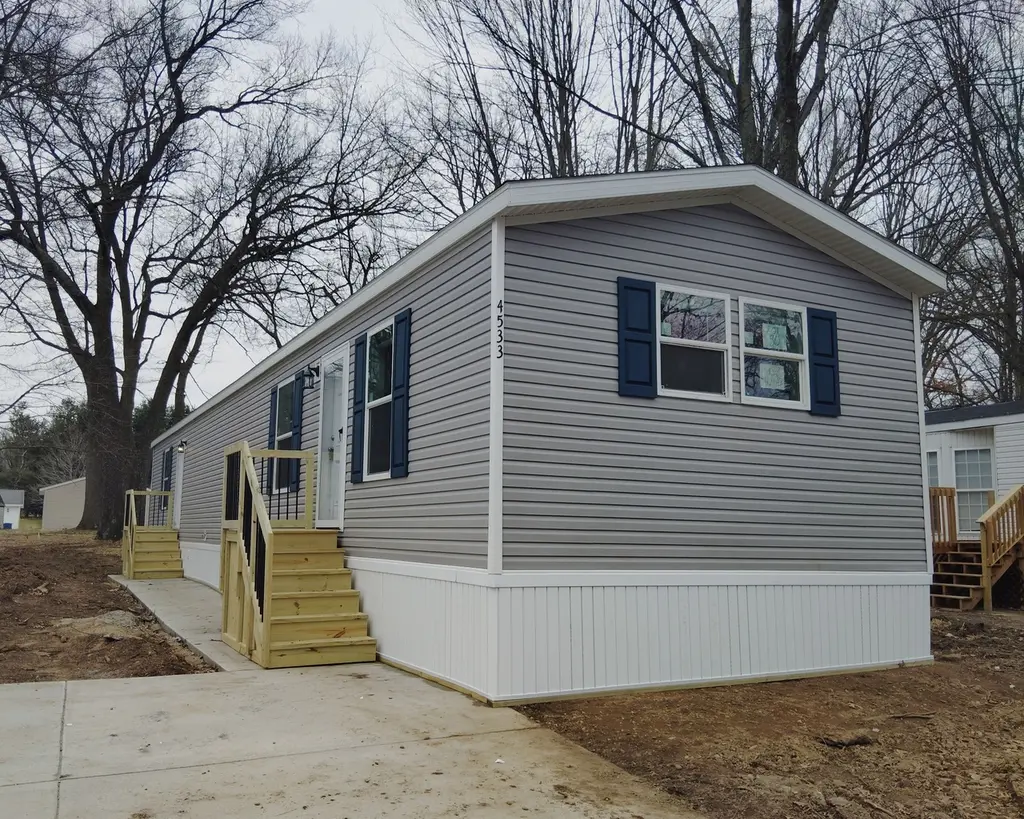
4533 Gemini #80 · Rockford, MI
Flood risk No data
- FEMA flood zone
- —
- Chance of flooding over 30 yrs
- —
- Est. flood insurance / yr
- —
Fire risk No data
- Est. fire insurance / yr
- —
Heat risk No data
- Hot days now (above threshold)
- —
- Hot days in 30 yrs
- —
Wind risk No data
- Chance of severe wind over 30 yrs
- —
Air-quality risk No data
- Unhealthy air days now
- —
- Unhealthy air days in 30 yrs
- —
Risk factors via First Street. Map © Google.
Why this score? — see what drove the B grade
The composite is a weighted blend of 9 inputs, each scored 0–100. Each bar is that input's sub-score; the figure is the points it added to the 100-point composite (weight × sub-score).
- Cash flow +30.0/30.0
- 1% rule +10.0/10.0
- DSCR +10.0/10.0
- ARV discount +7.5/15.0
- Schools +5.5/10.0
- Condition / age +5.0/5.0
- Livability +3.8/5.0
- Rent growth +2.5/5.0
- Appreciation +0.0/10.0
$58,000
🖨 Deal sheet 📄 Offer letter ✓ Due diligence
Listing remarks MLS
Your brand new 3 bedroom, 2 bathroom home is waiting for you to move in! This comfortable home features premium entry doors, a modern bathroom, as well as new brand name appliances. In the community, enjoy with your friends and family all the amenities we have to offer such as scenic views, a clubhouse, and community events. This home won't be on the market long, so call us today for more information or to schedule a tour. Deposits & Fees are subject to change.
Key facts
- Clubhouse
- Scenic views
- Modern bathroom
Tags
Neighborhood map
What this means for you Summary
Snapshot
- This is a 3-bed/2.0-bath manufactured listed at $58k. Condition is rated excellent.
Deal economics
- At list price, monthly cash flow is $1k ($15k/yr) — positive.
- The deal already cash-flows at list — no discount required.
- Meets the 1% rule at list price ($2k rent vs $58k).
- Recommended offer: $56k (3.0% below list) — sets the bar for market timing.
- Cap rate 32.5% vs local median 3.0% in Rockford — top-decile yield for the area; either an underpriced asset or a hidden risk that comps aren't pricing in. Stress-test before assuming the spread holds.
Location & tenants
- Location reads 75/100 on livability (#153 in MI, #3,827 nationally) — a middle-class / working-renter tenant base. Strengths: crime A+, employment A+, cost of living A+; Watch: amenities F, commute F, health & safety F.
- Rockford Public Schools (suburban): math 59% / reading 64% proficiency, ranked #28 of 540 in MI (top 5%) — acceptable for families but not a draw, mixed tenant base, ~2y average lease; only 12% free/reduced lunch — higher-income household profile.
- Market conditions: 269 active listings in the ZIP; high-income renter base; 2,253 units permitted in Kent County in 2024 (969 in 5+ unit buildings).
Forward outlook
- Local home prices are declining (-3.0%/yr); year-one equity from $401 of loan paydown is wiped out by about $2k of value loss. Plan a longer hold.
- Kent County population projected at +22% by 2050 — long-run rental-demand tailwind backs the buy-and-hold thesis.
- At projected returns (-3.0% appreciation + 3.0% rent growth), your $16k cash investment doubles in ~2 years — after that, you're playing with house money.
Negotiation context
- It's been on market 59 days — a 3% lower offer ($56k) is reasonable based on typical stale-listing flexibility.
Questions for the listing agent
- It's been on market 59 days. Have you received any prior offers? Is the seller open to a 3% concession, seller financing, or rate buy-down credit?
- Is there a deadline driving the sale (1031 exchange, divorce, estate, relocation)? That informs how much negotiation room exists.
- Schools are A-rated — typically a magnet for longer-tenancy family renters. What's the average tenant stay here, and is there a school-zone premium baked into asking?
- What's the average days-on-market for RENTAL listings here right now (not sales)? A rising rental-DOM trend means longer vacancies and softer asking-rent achievability than the comps imply.
- What's the recent tenant-quality profile in this submarket — average credit score on applications, eviction rate, late-payment / NSF rate, and stable-employment percentage? A property-management company in the area should have these aggregated.
- How much new for-sale + rental construction is in the pipeline within 1–3 miles? Heavy new supply typically softens prices + rents 12–24 months out; constrained supply supports both.
Investment metrics
- 1% rule
- 3.64% ✓
- Cap rate
- 32.51%
- Cash-on-cash
- 93.64%
- DSCR
- 5.17
- GRM
- 2.3
CMA / ARV
- ARV (median comp)
- $32,000
- List price
- $58,000
- Delta
- 81.25%
- Verdict
- OVERPRICED
- Comps
- 3 within 1.0 mi
Show comp detail 2 sales within ~0.75 mi
| Address | Dist | Beds/Ba | Sqft | Sold | Price | $/sf | Match |
|---|---|---|---|---|---|---|---|
| 10664 Aquarius Dr NE | 0.16mi | 3/2.0 | 1,216 (+9%) | 2mo | $70,000 | $58 | 76 |
| 4512 Ursa Way NE #171 | 0.16mi | 3/2.0 | 1,248 (+11%) | 10mo | $35,000 | $28 | 65 |
Match score weights: distance 35% · size 25% · config 20% · recency 20%. Top-matched comps best support the ARV.
Projected returns pro-forma
-3.0% appreciation · 3.0% rent growth · sell at horizon
- IRR
- 94.5%
- Equity multiple
- 5.39×
- Total profit
- $71,348
- Equity at exit
- $8,648
- IRR
- 97.2%
- Equity multiple
- 11.23×
- Total profit
- $166,191
- Equity at exit
- $5,015
Cash invested: $16,240 (down + closing). Projections, not guarantees.
Landlord ↔ Tenant lean methodology
- Overall (STATE)
- 62 Landlord-Friendly
- State Michigan
- 62 Landlord-Friendly · EVEN
- County
- — inherits STATE
- City
- — inherits STATE
ZIP-level market 49341
- Home prices YoY
- -33.8%
- Active inventory
- 269
- Price-to-rent
- 2.3×
Monthly cashflow live
- Estimated rent
- $2,112 medium interval (Pro) →
- Mortgage (P&I)
- −$304
- Tax est. 1.5%
- −$72 /mo · $870/yr
- Insurance
- −$24
- HOA
- −$0
- Vacancy / Maint / Mgmt
- −$443
- Net cashflow
- $1,267
Break-even live
UW: 25.0% down · 7.5% · 30yr · 1.5% tax · 5.0% vac · 8.0% maint · 8.0% mgmt
Financing live
Cash to close
- Down payment
- $14,500
- Closing costs
- $1,740
- Reserves months
- —
- Total cash needed
- —
Loan-product check · same deal, 3 products live
Conventional
25% down · 7.5% · 30yr
- Down + closing
- —
- Monthly P&I
- —
- Monthly cashflow
- —
- DSCR
- —
- Eligible?
- —
Personal DTI + credit; lowest rate.
DSCR
20% down · 8.5% · 30yr
- Down + closing
- —
- Monthly P&I
- —
- Monthly cashflow
- —
- DSCR
- —
- Eligible?
- —
No personal income docs; deal must DSCR.
Hard money
10% down · 12.0% · 12mo
- Down + closing
- —
- Monthly P&I
- —
- Monthly cashflow
- —
- DSCR
- —
- Eligible?
- —
Short-term bridge; refi at stabilization.
Listing history 1 events
-
2026-03-31$58,000 Active 471-char remark
Show marketing remark (471 chars)
Your brand new 3 bedroom, 2 bathroom home is waiting for you to move in! This comfortable home features premium entry doors, a modern bathroom, as well as new brand name appliances. In the community, enjoy with your friends and family all the amenities we have to offer such as scenic views, a clubhouse, and community events. This home won't be on the market long, so call us today for more information or to schedule a tour. Deposits & Fees are subject to change.
ⓘ Source: listings_history table (triggers on properties + properties_extension) + one-shot
backfill from property_details.listing_events for pre-trigger history.
Nearby sold comps map
Loading sold comps map…
Walkable amenities ~0.75 mi
Loading nearby amenities…
Taxation est. · year 1
- Rental income
- $25,338
- − Mortgage interest
- −$3,249
- − Property taxes
- −$870
- − Insurance
- −$290
- − Repairs & maintenance
- −$2,027
- − Management
- −$2,027
- − Depreciation
- −$1,687
- Taxable income
- $15,188
- Est. tax owed @ 24.0%
- −$3,645
- After-tax cash flow
- $11,562/yr
For passive investors: Depreciation is non-cash, so a rental often shows a tax loss while cash-flowing — sheltering income. Rental losses are passive: they offset passive income freely, and up to $25,000/yr can offset ordinary (W-2) income if you actively participate and your MAGI is under $100k (phasing out to $0 by $150k); unused losses carry forward. On sale, claimed depreciation is recaptured at up to 25%, and gains may owe capital-gains tax (a 1031 exchange can defer both). Figures are a year-1 estimate at your 24.0% rate — not tax advice; consult a CPA.
Condition & rehab AI · 1 photo
This brand new 3-bedroom, 2-bathroom manufactured home is move-in ready with premium features and a great location.
Value-add opportunities
- Both Landscaping improvements — Enhances curb appeal and adds value
- Both Interior updates — Modernizes the home and adds value
- Both Appliance upgrades — Improves functionality and adds value
Renovation cost estimate screening
Value-add ROI direction
- Both Landscaping improvements — Enhances curb appeal and adds value ↑
- Both Interior updates — Modernizes the home and adds value ↑
- Both Appliance upgrades — Improves functionality and adds value ↑
ⓘ Cost ranges are severity-bucket heuristics (US national rule-of-thumb). Get contractor quotes + a written scope before underwriting a rehab budget.
Schools (NCES district)
- District
- Rockford Public Schools
- NCES district ID
- 2630030
- Math proficiency
- 59% ▼ -5.00%
- Reading proficiency
- 64% ▼ -2.00%
- Median HH income
- $79,800
- Composite
- 55.16/100
- National rank
- #1276
- State rank
- #28 of 540 in MI
Livability — Rockford
- Score
- 75/100
- State rank
- #153
- US rank
- #3827
Category grades
Schools grade is shown separately in the Schools card above.
Census & demographics
- County
- Kent County · 533,805 people
- City population
- 39,409
- Metro
- Grand Rapids-Kentwood, MI
- Population (ZIP)
- 39,409
- Household income
- $113,989
- Rent vs Own
- Severe rent burden
- 293.0
Population outlook (Kent County) Hauer SSP2
- Today (2025)
- 712,484 people
- By 2030
- 748,618 · +5.1%
- By 2040
- 814,777 · +14.4%
- By 2050
- 868,556 · +21.9%
- By 2075
- 966,487 · +35.7%
- By 2100
- 967,975 · +35.9%
Race, ethnicity, and origin ACS 2023
- Neighborhood character
- Predominantly White (90%)
- Race & ethnicity
- White 90% Two or more races 5% Hispanic / Latino 4%
- Common ancestry
- Iranian 15% Romanian 9% Lithuanian 4%
- Foreign-born
- 2% · Canada
- Languages at home
- 97% English-only · Spanish 2%
Political lean MEDSL · Kent
- 2024 margin
- Lean D (+5.4) · D 51.8% · R 46.5% · Other 1.7%
- 2008→2024 swing
- +4.8pp toward D · 2008: 0.5pp · 2024: 5.4pp
- All cycles
- 2024: D+5.4 2020: D+6.1 2016: R+3.1 2012: R+7.9 2008: D+0.5
Not yet ingested
- Civics
- —
Market trends
- HPI YoY
- ▼ -131.59%
- Current HPI
- 257.3691
- Rent YoY
- —
- Metro
- Grand Rapids-Kentwood, MI
- State GDP YoY
- ▲ 1.37%
- F500 in state
- 28
Industry mix (Fortune 500 HQ in MI)
| Industry | F500 HQs | Revenue |
|---|---|---|
| Automotive Parts | 3 | $48B |
|
||
| Automotive | 2 | $372B |
|
||
| Chemicals | 1 | $45B |
|
||
| Automotive Retail | 1 | $29B |
|
||
| Healthcare / Medical Devices | 1 | $23B |
|
||
| Automotive Technology | 1 | $20B |
|
||
Price history
1 event — show timeline
- 2026-03-31 Listed $58,000 Zillow
Cash-flow waterfall
monthlySold comps — $/sqft
last 12 mo · ≤1 miLoading sold comps…