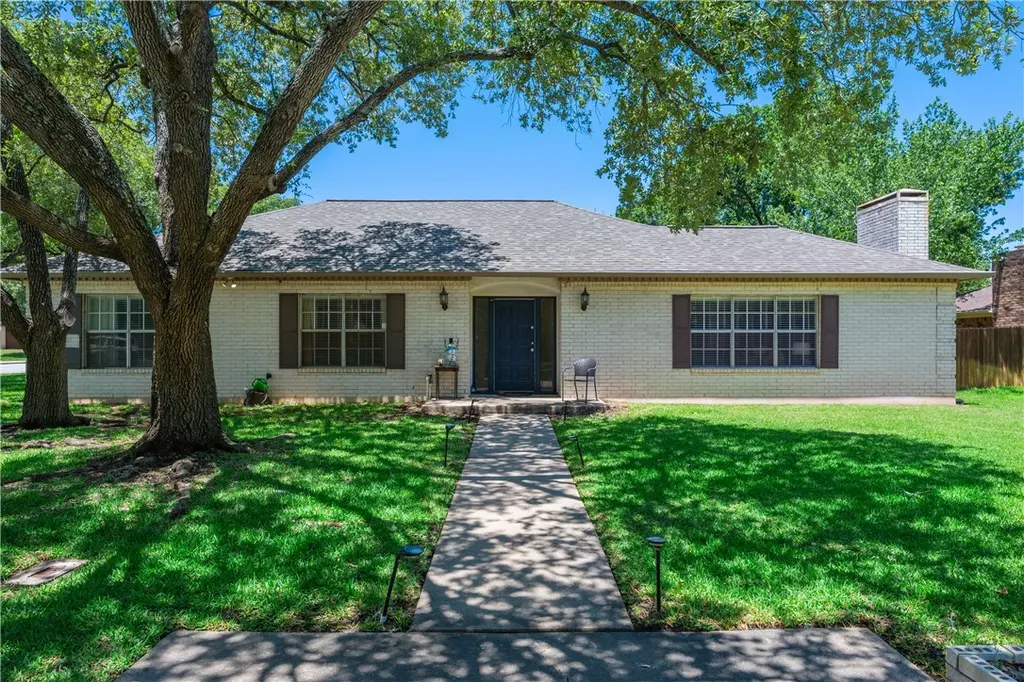
1818 Bee Creek Dr · College Station, TX
Flood risk 1/10 · Minimal
- FEMA flood zone
- X (unshaded)
- Chance of flooding over 30 yrs
- 0.0%
- Est. flood insurance / yr
- $507 – $1,088
Fire risk 2/10 · Minimal
- Est. fire insurance / yr
- $1,222 – $2,270
Heat risk 8/10 · Major
- Hot days now (above 110°F)
- 7 days/yr
- Hot days in 30 yrs
- 24 days/yr
Wind risk 8/10 · Major
- Chance of severe wind over 30 yrs
- 80.0%
Air-quality risk 1/10 · Minimal
- Unhealthy air days now
- 0 days/yr
- Unhealthy air days in 30 yrs
- 0 days/yr
Risk factors via First Street. Map © Google.
Why this score? — see what drove the B- grade
The composite is a weighted blend of 9 inputs, each scored 0–100. Each bar is that input's sub-score; the figure is the points it added to the 100-point composite (weight × sub-score).
- Cash flow +23.7/30.0
- ARV discount +14.3/15.0
- DSCR +7.6/10.0
- 1% rule +6.3/10.0
- Schools +4.7/10.0
- Livability +4.2/5.0
- Rent growth +4.1/5.0
- Condition / age +2.5/5.0
- Appreciation +0.0/10.0
$384,500
🖨 Deal sheet 📄 Offer letter ✓ Due diligence
Listing remarks MLS
If you've seen this home, take a look again! New carpet, fresh paint, new fixtures, and more is what you'll find in this immaculate 4 bedroom, 3 bathroom home situated on a quarter acre lot in the heart of College Station. Bike to campus from this conveniently located 2,514sf treasure with detached 2-car garage and two, yes TWO, master bedroom suites! Bonus features include tile flooring throughout common areas and baths, extra-large laundry room with extra storage and additional freezer space, 3 full bathrooms, tons of closet space, and more. Enjoy outdoor entertaining and relax under the covered back patio overlooking the large fenced backyard. Schedule your private showing today!
Key facts
- 0.28 acre lot
- 2 garage spots
- Built 1975
Tags
Property features AI
Exterior
- Parking: Detached 2-car garage; 2 covered parking spaces
- Security: Smoke detectors; Accessible doors
- Utilities: Public water; Public sewer; Electricity available; Sewer available; Water available
- Home design: Single-family residence; One story
- Construction: Brick and frame construction; Composition/shingle roof; Slab foundation; Built in 2026
- Exterior features: Covered patio/porch; Chain link and wood fencing; Corner, level lot
Interior
- Kitchen: Cooktop; Dishwasher
- Flooring: Carpet; Tile
- Bathrooms: 3 full bathrooms
- Heating & cooling: Central heating (natural gas); Central electric air conditioning; Ceiling fan(s)
- Interior features: High ceilings; Laminate countertops; Ceiling fans; Window treatments; Gas and wood-burning fireplace
- Laundry & utility: Washer hookup; Gas water heater; Water heater
Neighborhood map
What this means for you Summary
Snapshot
- This is a 4-bed/2.5-bath single-family listed at $384k.
Deal economics
- At list price, monthly cash flow is $729 ($9k/yr) — positive.
- The deal already cash-flows at list — no discount required.
- Meets the 1% rule at list price ($4k rent vs $384k).
- Recommended offer: $379k (1.5% below list) — sets the bar for market timing.
- Cap rate 8.6% vs local median 3.3% in College Station — top-decile yield for the area; either an underpriced asset or a hidden risk that comps aren't pricing in. Stress-test before assuming the spread holds.
Location & tenants
- Location reads 83/100 on livability (#11 in TX, #994 nationally) — a professional / high-income tenant draw. Strengths: amenities A+, commute A+, crime A-; Watch: employment C-.
- College Station ISD (urban): math 58% / reading 54% proficiency, ranked #113 of 826 in TX (top 14%) — acceptable for families but not a draw, mixed tenant base, ~2y average lease.
- Market conditions: Rents rising fast (+6.2%/yr); 305 active listings in the ZIP; 14 comparable units currently listed for rent nearby; rentals at typical pace (median 21d on market — plan ~3-4 weeks tenant-placement turnaround); lower-income renter base — watch delinquency; 2,211 units permitted in Brazos County in 2024 (768 in 5+ unit buildings).
- At $4,331/mo this rent would consume 171% of the median local household income ($30k/yr) (locally 8224% of renters already pay >50% of income on rent) — very limited rent-growth headroom before tenants either downsize or default.
Forward outlook
- Local home prices are declining (-3.0%/yr); year-one equity from $3k of loan paydown is wiped out by about $12k of value loss. Plan a longer hold.
- Brazos County population projected at +55% by 2050 — long-run rental-demand tailwind backs the buy-and-hold thesis.
- At projected returns (-3.0% appreciation + 6.2% rent growth), your $108k cash investment doubles in ~9 years — after that, you're playing with house money.
Negotiation context
- It's been on market 18 days — a 2% lower offer ($379k) is reasonable based on typical stale-listing flexibility.
- 3 sale attempts since 8y ago with the ask held roughly flat each time — persistent listings suggest the price (not the market) is what's stuck; bring a comps-based counter.
Risks & watch-outs
- Climate carrying-cost: severe wind risk, 80% chance of damaging wind over 30y; extreme-heat days projected 7→24/yr by 2055 (HVAC capex compounding) — expect insurance premiums to compound above CPI over the hold.
Questions for the listing agent
- Built in 1975 — when were the roof, HVAC, electrical panel, plumbing, and water heater last replaced?
- Is there a deadline driving the sale (1031 exchange, divorce, estate, relocation)? That informs how much negotiation room exists.
- Schools are B-rated — typically a magnet for longer-tenancy family renters. What's the average tenant stay here, and is there a school-zone premium baked into asking?
- What's the average days-on-market for RENTAL listings here right now (not sales)? A rising rental-DOM trend means longer vacancies and softer asking-rent achievability than the comps imply.
- What's the recent tenant-quality profile in this submarket — average credit score on applications, eviction rate, late-payment / NSF rate, and stable-employment percentage? A property-management company in the area should have these aggregated.
- How much new for-sale + rental construction is in the pipeline within 1–3 miles? Heavy new supply typically softens prices + rents 12–24 months out; constrained supply supports both.
Investment metrics
- 1% rule
- 1.13% ✓
- Cap rate
- 8.57%
- Cash-on-cash
- 8.12%
- DSCR
- 1.36
- GRM
- 7.4
CMA / ARV
- ARV (on-the-fly)
- $452,520
- Comps found
- 7
Show comp detail 7 sales within ~0.75 mi
| Address | Dist | Beds/Ba | Sqft | Sold | Price | $/sf | Match |
|---|---|---|---|---|---|---|---|
| 1316 Augustine Ct | 0.24mi | 4/2.0 | 2,308 (-8%) | 15mo | $349,900 | $152 | 60 |
| 1305 Haines Dr | 0.51mi | 3/2.0 (-1) | 2,301 (-8%) | 9mo | $399,000 | $173 | 47 |
| 1303 Langford St | 0.49mi | 4/2.0 | 2,770 (+10%) | 14mo | $498,600 | $180 | 46 |
| 1014 Guadalupe Dr | 0.44mi | 4/2.5 | 2,260 (-10%) | 23mo | $459,900 | $203 | 44 |
| 1610 Lemon Tree Ln | 0.32mi | 5/5.5 (+1) | 2,382 (-5%) | 19mo | $525,000 | $220 | 43 |
| 1007 Laredo Ct | 0.59mi | 3/3.0 (-1) | 2,296 (-9%) | 15mo | $449,000 | $196 | 39 |
| 1200 Langford St | 0.60mi | 4/3.0 | 2,770 (+10%) | 18mo | $455,000 | $164 | 38 |
Match score weights: distance 35% · size 25% · config 20% · recency 20%. Top-matched comps best support the ARV.
Projected returns pro-forma
-3.0% appreciation · 6.24% rent growth · sell at horizon
- IRR
- -0.3%
- Equity multiple
- 0.99×
- Total profit
- $-1,242
- Equity at exit
- $57,330
- IRR
- 12.5%
- Equity multiple
- 2.14×
- Total profit
- $122,953
- Equity at exit
- $33,245
Cash invested: $107,660 (down + closing). Projections, not guarantees.
Landlord ↔ Tenant lean methodology
- Overall (STATE)
- 87 Strongly Landlord-Friendly
- State Texas
- 87 Strongly Landlord-Friendly · R+5
- County
- — inherits STATE
- City
- — inherits STATE
ZIP-level market 77840
- Rents YoY
- 6.2%
- Active inventory
- 305
- Price-to-rent
- 7.4×
Monthly cashflow live
- Estimated rent
- $4,331 high interval (Pro) →
- Mortgage (P&I)
- −$2,016
- Tax from tax record
- −$516 /mo · $6,193/yr
- Insurance
- −$160
- HOA
- −$0
- Vacancy / Maint / Mgmt
- −$909
- Net cashflow
- $729
Break-even live
UW: 25.0% down · 7.5% · 30yr · 1.5% tax · 5.0% vac · 8.0% maint · 8.0% mgmt
Financing live
Cash to close
- Down payment
- $96,125
- Closing costs
- $11,535
- Reserves months
- —
- Total cash needed
- —
Loan-product check · same deal, 3 products live
Conventional
25% down · 7.5% · 30yr
- Down + closing
- —
- Monthly P&I
- —
- Monthly cashflow
- —
- DSCR
- —
- Eligible?
- —
Personal DTI + credit; lowest rate.
DSCR
20% down · 8.5% · 30yr
- Down + closing
- —
- Monthly P&I
- —
- Monthly cashflow
- —
- DSCR
- —
- Eligible?
- —
No personal income docs; deal must DSCR.
Hard money
10% down · 12.0% · 12mo
- Down + closing
- —
- Monthly P&I
- —
- Monthly cashflow
- —
- DSCR
- —
- Eligible?
- —
Short-term bridge; refi at stabilization.
Rent comps 14 comps
| Address | Beds | Baths | Sqft | Rent | $/sqft | DOM | Units | Dist |
|---|---|---|---|---|---|---|---|---|
| 1909 Langford St Unit 1328073P College Station, TX | 4.0 | 2.0 | 2271 | $5,828 | $2.57 | 13d | 1 | 0.21mi |
| 2003 Harvey Mitchell Pkwy S College Station, TX | 3.0 | 4.0 | 1838 | $1,950 | $1.06 | 43d | 1 | 0.42mi |
| 1303 Langford St Unit 1497790P College Station, TX | 4.0 | 2.0 | 2766 | $6,682 | $2.42 | 43d | 1 | 0.47mi |
| 1301 Haines Dr College Station, TX | 4.0 | 2.0 | 1790 | $2,200 | $1.23 | 20d | 1 | 0.51mi |
| 1409 Clement Ct Unit 1328074P College Station, TX | 4.0 | 2.0 | 1991 | $5,418 | $2.72 | 13d | 1 | 0.65mi |
| 1105 Glade St Unit 1328055P College Station, TX | 5.0 | 3.0 | 2077 | $6,440 | $3.10 | 13d | 1 | 0.70mi |
| 2330 Autumn Chase Loop Unit B College Station, TX | 3.0 | 3.0 | 2728 | $1,650 | $0.60 | 13d | 1 | 0.82mi |
| 902 Holik Dr College Station, TX | 3.0 | 2.0 | 2013 | $2,400 | $1.19 | 43d | 1 | 0.89mi |
| 2409 Colgate Cir College Station, TX | 5.0 | 3.0 | 1870 | $750 | $0.40 | 43d | 1 | 0.94mi |
| 287 Estates Cir Unit 1071599P College Station, TX | 4.0 | 4.0 | 2098 | $7,118 | $3.39 | 20d | 1 | 1.01mi |
| 236 Richards St College Station, TX | 5.0 | 5.5 | 2550 | $4,100 | $1.61 | 13d | 1 | 1.10mi |
| 2105 Crest St College Station, TX | 5.0 | 5.5 | 2405 | $4,100 | $1.70 | 13d | 1 | 1.19mi |
| 1611 Armistead St Unit 1344599P College Station, TX | 3.0 | 3.0 | 2002 | $4,440 | $2.22 | 20d | 1 | 1.35mi |
| 302 Fidelity St Unit B College Station, TX | 5.0 | 5.5 | 2625 | $5,295 | $2.02 | 43d | 1 | 1.40mi |
Listing history 14 events
-
2026-06-18days on market $384,500 Active 18 DOM
-
2026-06-17days on market $384,500 Active 17 DOM
-
2026-06-16days on market $384,500 Active 16 DOM
-
2026-06-15days on market $384,500 Active 15 DOM
-
2026-06-14days on market $384,500 Active 13 DOM
-
2026-06-13days on market $384,500 Active 12 DOM
-
2026-06-10days on market $384,500 Active 10 DOM
-
2026-06-09days on market $384,500 Active 9 DOM
-
2026-06-08days on market $384,500 Active 8 DOM
-
2026-06-07days on market $384,500 Active 7 DOM
-
2026-06-05days on market $384,500 Active 4 DOM
-
2026-06-02days on market $384,500 Active 2 DOM
-
2026-05-31remarks 683-char remark
-
2026-05-31$384,500 Active 1 DOM
ⓘ Source: listings_history table (triggers on properties + properties_extension) + one-shot
backfill from property_details.listing_events for pre-trigger history.
Tax reassessment forecast TX · Resets to sale price
- Current annual tax
- $6,193 · $516/mo
- Projected year-2 tax
- $7,036 · $586/mo
- Expected delta
- +$843/yr (+$70/mo · 13.6%)
ⓘ Screening estimate from a state-policy table — verify with the county assessor before closing.
Climate risk First Street
- Flood 1/10 Low FEMA zone X (unshaded) · 0% chance over 30 yrs
- Wildfire 2/10 Low
- Heat 8/10 Severe 7 d/yr ≥110°F today · 24 d/yr by 30 yrs out
- Wind 8/10 Severe 80% chance of damaging wind over 30 yrs
- Air quality 1/10 Low 0 unhealthy d/yr today · 0 by 30 yrs out
Nearby sold comps map
Loading sold comps map…
Walkable amenities ~0.75 mi
Loading nearby amenities…
Taxation est. · year 1
- Rental income
- $51,967
- − Mortgage interest
- −$21,538
- − Property taxes
- −$6,193
- − Insurance
- −$1,922
- − Repairs & maintenance
- −$4,157
- − Management
- −$4,157
- − Depreciation
- −$11,185
- Taxable income
- $2,814
- Est. tax owed @ 24.0%
- −$675
- After-tax cash flow
- $8,067/yr
For passive investors: Depreciation is non-cash, so a rental often shows a tax loss while cash-flowing — sheltering income. Rental losses are passive: they offset passive income freely, and up to $25,000/yr can offset ordinary (W-2) income if you actively participate and your MAGI is under $100k (phasing out to $0 by $150k); unused losses carry forward. On sale, claimed depreciation is recaptured at up to 25%, and gains may owe capital-gains tax (a 1031 exchange can defer both). Figures are a year-1 estimate at your 24.0% rate — not tax advice; consult a CPA.
Schools (NCES district)
- District
- College Station ISD
- NCES district ID
- 4807350
- Math proficiency
- 58% ▼ -4.00%
- Reading proficiency
- 54% ▼ -2.00%
- Median HH income
- $36,991
- Composite
- 46.54/100
- National rank
- #2428
- State rank
- #113 of 826 in TX
Livability — College Station
- Score
- 83/100
- State rank
- #11
- US rank
- #994
Category grades
Schools grade is shown separately in the Schools card above.
Census & demographics
- Census place
- College Station, TX
- County
- Brazos County · 233,400 people
- City population
- 131,628
- Metro
- College Station-Bryan, TX
- Population (ZIP)
- 54,864
- Household income
- $30,377
- Rent vs Own
- Severe rent burden
- 8224.0
Population outlook (Brazos County) Hauer SSP2
- Today (2025)
- 267,942 people
- By 2030
- 296,630 · +10.7%
- By 2040
- 354,560 · +32.3%
- By 2050
- 414,616 · +54.7%
- By 2075
- 562,158 · +109.8%
- By 2100
- 678,828 · +153.3%
Race, ethnicity, and origin ACS 2023
- Neighborhood character
- Diverse neighborhood (Simpson 0.63)
- Race & ethnicity
- White 55% Hispanic / Latino 20% Two or more races 11% Black 11% Asian 9%
- Hispanic origin (detail)
- Mexican 13%
- Common ancestry
- Romanian 2% Lithuanian 2% Italian 2%
- Foreign-born
- 14% · Canada, China, South Korea
- Languages at home
- 77% English-only · Spanish 12% Other Indo-European 3% Chinese 2%
Political lean MEDSL · Brazos
- 2024 margin
- Strong R (+24.9) · D 36.9% · R 61.7% · Other 1.4%
- 2008→2024 swing
- +4.1pp toward D · 2008: -28.9pp · 2024: -24.9pp
- All cycles
- 2024: R+24.9 2020: R+14.3 2016: R+23.7 2012: R+35.3 2008: R+28.9
Not yet ingested
- Civics
- —
Market trends
- HPI YoY
- ▼ -155.15%
- Current HPI
- 195.2885
- Rent YoY
- ▲ 6.24%
- Metro
- College Station-Bryan, TX
- State GDP YoY
- ▲ 3.95%
- F500 in state
- 110
Industry mix (Fortune 500 HQ in TX)
| Industry | F500 HQs | Revenue |
|---|---|---|
| Energy | 16 | $1,198B |
|
||
| Technology | 5 | $198B |
|
||
| Engineering / Construction | 4 | $72B |
|
||
| Energy Services | 3 | $60B |
|
||
| Utilities | 3 | $41B |
|
||
| Healthcare | 2 | $330B |
|
||
Price history
+39.8% since first listed5 events — show timeline
- 2026-05-31 Listed $384,500 BCSRMLS
- 2018-11-30 Sold (MLS) — BCSRMLS
- 2018-09-17 Listed $262,500 BCSRMLS
- 2018-02-01 Listed $275,000 BCSRMLS
- 2005-07-28 Sold (Public Records) — Public Records
Property tax history
+3.4%/yrLatest (2025): $6,193 · -5.9% YoY. Source: county tax records.
Cash-flow waterfall
monthlySold comps — $/sqft
last 12 mo · ≤1 miLoading sold comps…