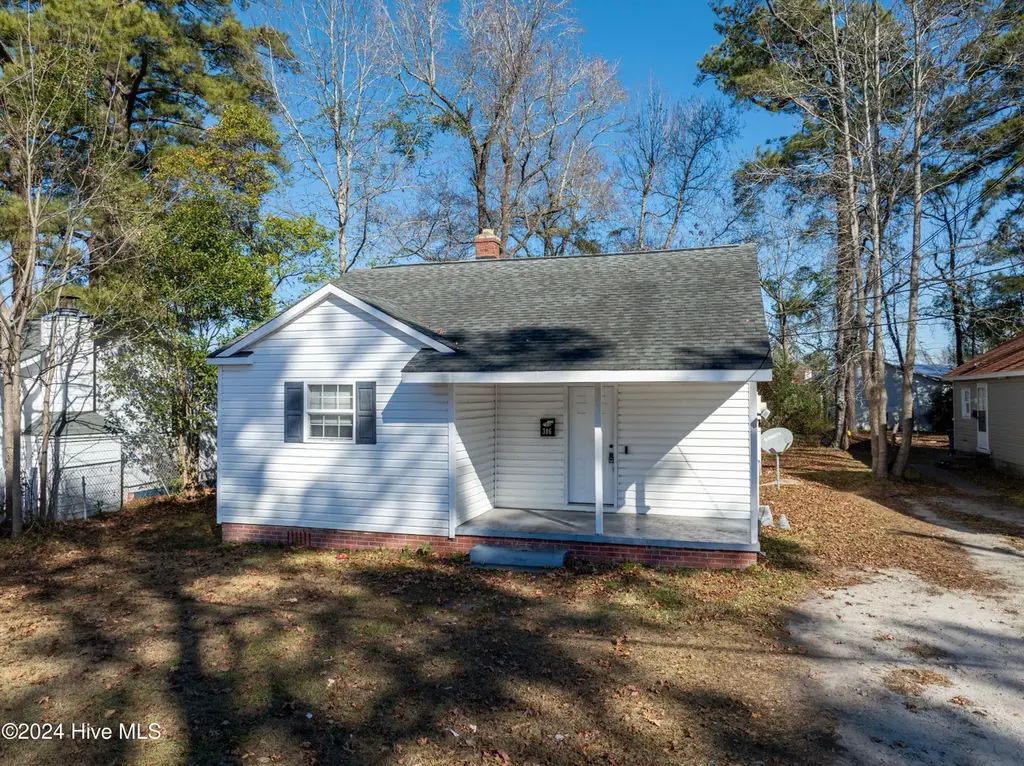
306 Richlands Ave · Jacksonville, NC
Flood risk 1/10 · Minimal
- FEMA flood zone
- X (unshaded)
- Chance of flooding over 30 yrs
- 0.0%
- Est. flood insurance / yr
- $507 – $1,088
Fire risk 4/10 · Minor
- Est. fire insurance / yr
- $906 – $1,684
Heat risk 9/10 · Severe
- Hot days now (above 106°F)
- 7 days/yr
- Hot days in 30 yrs
- 18 days/yr
Wind risk 8/10 · Major
- Chance of severe wind over 30 yrs
- 99.0%
Air-quality risk 3/10 · Minor
- Unhealthy air days now
- 2 days/yr
- Unhealthy air days in 30 yrs
- 3 days/yr
Risk factors via First Street. Map © Google.
Why this score? — see what drove the B- grade
The composite is a weighted blend of 9 inputs, each scored 0–100. Each bar is that input's sub-score; the figure is the points it added to the 100-point composite (weight × sub-score).
- Cash flow +25.1/30.0
- ARV discount +15.0/15.0
- DSCR +8.2/10.0
- 1% rule +6.2/10.0
- Schools +3.9/10.0
- Rent growth +3.6/5.0
- Livability +3.6/5.0
- Condition / age +2.5/5.0
- Appreciation +0.0/10.0
$145,000
🖨 Deal sheet 📄 Offer letter ✓ Due diligence
Listing remarks MLS
Adorable 3 bedroom, 1.5 bath home in the heart of Jacksonville. Close to shopping, schools, restaurants, and base. Priced to sell at $139,000. Call for your VIP tour, this Home wont last!
Key facts
- Near shopping
- Near restaurants
- 3 bedroom bungalow
Tags
Property features AI
Finance
- Other: Zoned RMF-LD; Lot dimensions approximately 50 x 171 x 47 x 172 (0.19 acres); Road frontage on city street and state road; Directions: Hwy 17 N Business, left on Richlands Ave (Days Inn on corner). Home down on the right, #306 Richlands Ave; Subdivision: Overbrook Ext 3
Exterior
- Parking: On-site parking
- Utilities: Public water; Public sewer; Sewer available; Water available
- Home design: Single-family residence; One level; Residential property
- Construction: Vinyl siding and frame construction; Combination foundation; Built with frame construction
- Exterior features: Shingle roof; Porch; Has a view
Interior
- Kitchen: Electric oven; Refrigerator; Dishwasher
- Bedrooms: Total of 6 rooms (bedroom count not specified)
- Flooring: Carpet; Laminate
- Bathrooms: 1 full bathroom; 1 half bathroom
- Heating & cooling: Central air; Electric heating; Heat pump
- Interior features: Unfurnished; Porch
- Laundry & utility: Laundry in hall; Laundry closet; Electric water heater
Neighborhood map
What this means for you Summary
Snapshot
- This is a 4-bed/1.5-bath single-family listed at $145k.
Deal economics
- At list price, monthly cash flow is $322 ($4k/yr) — positive.
- The deal already cash-flows at list — no discount required.
- Meets the 1% rule at list price ($2k rent vs $145k).
- Recommended offer: $136k (6.0% below list) — sets the bar for market timing.
- Cap rate 9.0% vs local median 4.4% in Jacksonville — top-decile yield for the area; either an underpriced asset or a hidden risk that comps aren't pricing in. Stress-test before assuming the spread holds.
Location & tenants
- Location reads 71/100 on livability (#111 in NC) — a middle-class / working-renter tenant base. Strengths: cost of living A+, housing A+, health & safety A+; Watch: employment D, crime F, amenities F.
- Onslow County Schools (other): math 42% / reading 49% proficiency, ranked #84 of 178 in NC (top 47%) — families likely to look elsewhere, expect single-tenant / working-renter base with shorter leases.
- Zoned schools: Clyde Erwin Elementary (math 32% / reading 47%, grade F, #694 of 1,410 statewide, top 53%, 343 students, 67% FRL); New Bridge Middle (math 57% / reading 64%, grade B+, #43 of 475 statewide, top 9%, 490 students, 40% FRL); Jacksonville High (math 52% / reading 66%, grade C+, #233 of 535 statewide, top 44%, 1,423 students, 44% FRL).
- Market conditions: Rents rising fast (+4.5%/yr); 380 active listings in the ZIP; 4 comparable units currently listed for rent nearby; rentals at typical pace (median 21d on market — plan ~3-4 weeks tenant-placement turnaround); 1,246 units permitted in Onslow County in 2024 (0 in 5+ unit buildings).
Forward outlook
- Local home prices are declining (-3.0%/yr); year-one equity from $1k of loan paydown is wiped out by about $4k of value loss. Plan a longer hold.
- At projected returns (-3.0% appreciation + 4.5% rent growth), your $41k cash investment doubles in ~10 years — after that, you're playing with house money.
Negotiation context
- It's been on market 83 days — a 6% lower offer ($136k) is reasonable based on typical stale-listing flexibility.
- 9 sale attempts since 18y ago with the ask held roughly flat each time — persistent listings suggest the price (not the market) is what's stuck; bring a comps-based counter.
Risks & watch-outs
- Watch-outs: built in 1950 — expect roof / HVAC / electrical / plumbing capex.
- Climate carrying-cost: severe wind risk, 99% chance of damaging wind over 30y; extreme-heat days projected 7→18/yr by 2055 (HVAC capex compounding) — expect insurance premiums to compound above CPI over the hold.
Questions for the listing agent
- It's been on market 83 days. Have you received any prior offers? Is the seller open to a 6% concession, seller financing, or rate buy-down credit?
- Built in 1950 — when were the roof, HVAC, electrical panel, plumbing, and water heater last replaced?
- Why hasn't it sold? Are there any deal-killer items the seller is aware of (foundation, flood, title, zoning, code violations)?
- Is there a deadline driving the sale (1031 exchange, divorce, estate, relocation)? That informs how much negotiation room exists.
- Crime grade is F in this area — have there been break-ins, vandalism, or insurance claims at this property in the last 3 years? What carrier currently insures it and at what premium?
- What's the average days-on-market for RENTAL listings here right now (not sales)? A rising rental-DOM trend means longer vacancies and softer asking-rent achievability than the comps imply.
- What's the recent tenant-quality profile in this submarket — average credit score on applications, eviction rate, late-payment / NSF rate, and stable-employment percentage? A property-management company in the area should have these aggregated.
- How much new for-sale + rental construction is in the pipeline within 1–3 miles? Heavy new supply typically softens prices + rents 12–24 months out; constrained supply supports both.
Investment metrics
- 1% rule
- 1.12% ✓
- Cap rate
- 8.96%
- Cash-on-cash
- 9.53%
- DSCR
- 1.42
- GRM
- 7.4
CMA / ARV
- ARV (on-the-fly)
- $209,790
- Comps found
- 12
Show comp detail 12 sales within ~0.75 mi
| Address | Dist | Beds/Ba | Sqft | Sold | Price | $/sf | Match |
|---|---|---|---|---|---|---|---|
| 312 Sherwood Rd | 0.21mi | 3/2.0 (-1) | 1,152 (+2%) | 6mo | $205,000 | $178 | 75 |
| 400 Hickory Ct | 0.39mi | 3/1.0 (-1) | 1,166 (+3%) | 2mo | $225,000 | $193 | 69 |
| 119 Preston Rd | 0.31mi | 3/1.0 (-1) | 1,024 (-10%) | 2mo | $197,000 | $192 | 60 |
| 532 Oak Ln | 0.52mi | 3/1.5 (-1) | 1,072 (-6%) | 4mo | $190,000 | $177 | 59 |
| 608 Maple St | 0.64mi | 3/1.0 (-1) | 1,158 (+2%) | 2mo | $205,000 | $177 | 58 |
| 117 Puller Dr | 0.70mi | 3/1.5 (-1) | 1,125 (-1%) | 6mo | $195,000 | $173 | 56 |
| 131 Cox Ave | 0.53mi | 3/2.0 (-1) | 1,198 (+6%) | 5mo | $211,100 | $176 | 54 |
| 117 Summersill Dr | 0.58mi | 3/2.0 (-1) | 1,276 (+12%) | 3mo | $239,900 | $188 | 43 |
| 118 Thompson St | 0.63mi | 3/2.5 (-1) | 1,281 (+13%) | 2mo | $274,400 | $214 | 38 |
| 702 Williams St | 0.72mi | 3/1.0 (-1) | 1,000 (-12%) | 4mo | $210,000 | $210 | 37 |
| 113 Sanders St | 0.69mi | 3/2.5 (-1) | 1,280 (+13%) | 1mo | $236,000 | $184 | 37 |
| 113 Bryan St | 0.73mi | 3/1.0 (-1) | 1,000 (-12%) | 6mo | $185,000 | $185 | 34 |
Match score weights: distance 35% · size 25% · config 20% · recency 20%. Top-matched comps best support the ARV.
Projected returns pro-forma
-3.0% appreciation · 4.47% rent growth · sell at horizon
- IRR
- -0.3%
- Equity multiple
- 0.99×
- Total profit
- $-537
- Equity at exit
- $21,620
- IRR
- 10.7%
- Equity multiple
- 1.89×
- Total profit
- $36,250
- Equity at exit
- $12,537
Cash invested: $40,600 (down + closing). Projections, not guarantees.
Landlord ↔ Tenant lean methodology
- Overall (STATE)
- 85 Strongly Landlord-Friendly
- State North Carolina
- 85 Strongly Landlord-Friendly · R+3
- County
- — inherits STATE
- City
- — inherits STATE
ZIP-level market 28540
- Home prices YoY
- -21.5%
- Rents YoY
- 4.5%
- Active inventory
- 380
- Price-to-rent
- 7.4×
Monthly cashflow live
- Estimated rent
- $1,622 medium interval (Pro) →
- Mortgage (P&I)
- −$760
- Tax from tax record
- −$139 /mo · $1,663/yr
- Insurance
- −$60
- HOA
- −$0
- Vacancy / Maint / Mgmt
- −$341
- Net cashflow
- $322
Break-even live
UW: 25.0% down · 7.5% · 30yr · 1.5% tax · 5.0% vac · 8.0% maint · 8.0% mgmt
Financing live
Cash to close
- Down payment
- $36,250
- Closing costs
- $4,350
- Reserves months
- —
- Total cash needed
- —
Loan-product check · same deal, 3 products live
Conventional
25% down · 7.5% · 30yr
- Down + closing
- —
- Monthly P&I
- —
- Monthly cashflow
- —
- DSCR
- —
- Eligible?
- —
Personal DTI + credit; lowest rate.
DSCR
20% down · 8.5% · 30yr
- Down + closing
- —
- Monthly P&I
- —
- Monthly cashflow
- —
- DSCR
- —
- Eligible?
- —
No personal income docs; deal must DSCR.
Hard money
10% down · 12.0% · 12mo
- Down + closing
- —
- Monthly P&I
- —
- Monthly cashflow
- —
- DSCR
- —
- Eligible?
- —
Short-term bridge; refi at stabilization.
Rent comps 4 comps
| Address | Beds | Baths | Sqft | Rent | $/sqft | DOM | Units | Dist |
|---|---|---|---|---|---|---|---|---|
| 16 White Oak St Jacksonville, NC | 3.0 | 2.0 | 1150 | $1,650 | $1.43 | 20d | 1 | 0.39mi |
| 508 Henderson Dr Jacksonville, NC | 3.0 | 1.0 | 1050 | $1,400 | $1.33 | 20d | 1 | 0.39mi |
| 113 N Shore Dr Jacksonville, NC | 3.0 | 1.0 | 1126 | $1,395 | $1.24 | 20d | 1 | 0.44mi |
| 129 Sanders St Jacksonville, NC | 3.0 | 2.0 | 1198 | $1,450 | $1.21 | 20d | 1 | 0.69mi |
Listing history 37 events
-
2026-06-10days on market $145,000 Active 83 DOM
-
2026-06-09days on market $145,000 Active 82 DOM
-
2026-06-09days on market $145,000 Active 81 DOM
-
2026-06-07days on market $145,000 Active 80 DOM
-
2026-06-03days on market $145,000 Active 76 DOM
-
2026-06-02days on market $145,000 Active 75 DOM
-
2026-06-01days on market $145,000 Active 74 DOM
-
2026-05-31days on market $145,000 Active 73 DOM
-
2026-05-30days on market $145,000 Active 72 DOM
-
2026-05-18price $145,000
-
2026-03-19$150,000 Active
-
2025-09-08status Active
-
2025-08-26status Pending
-
2025-08-26historical
-
2025-07-30status Active
-
2025-07-23status Pending
-
2025-06-04price $150,000
-
2025-05-02price $152,900
-
2025-04-11price $162,900
-
2025-02-12price $170,000
-
2025-01-29price $175,000
-
2025-01-15price $180,000
-
2024-12-16$185,900 Active
-
2022-04-29soldstatus $139,000 Closed 187-char remark
Show marketing remark (187 chars)
Adorable 3 bedroom, 1.5 bath home in the heart of Jacksonville. Close to shopping, schools, restaurants, and base. Priced to sell at $139,000. Call for your VIP tour, this Home wont last!
-
2022-04-29soldstatus $139,000
Show marketing remark (187 chars)
Adorable 3 bedroom, 1.5 bath home in the heart of Jacksonville. Close to shopping, schools, restaurants, and base. Priced to sell at $139,000. Call for your VIP tour, this Home wont last!
-
2022-03-17historical 187-char remark
Show marketing remark (187 chars)
Adorable 3 bedroom, 1.5 bath home in the heart of Jacksonville. Close to shopping, schools, restaurants, and base. Priced to sell at $139,000. Call for your VIP tour, this Home wont last!
-
2022-03-13$139,000 187-char remark
Show marketing remark (187 chars)
Adorable 3 bedroom, 1.5 bath home in the heart of Jacksonville. Close to shopping, schools, restaurants, and base. Priced to sell at $139,000. Call for your VIP tour, this Home wont last!
-
2020-07-24soldstatus $112,900
-
2020-02-28$109,900
-
2017-10-11soldstatus $39,100
-
2017-08-13$41,500
-
2017-01-05historical
-
2014-04-08$66,000
-
2008-07-03soldstatus $97,000
-
2008-03-03historical
-
2008-02-26$105,000
-
2007-05-16soldstatus $36,000
ⓘ Source: listings_history table (triggers on properties + properties_extension) + one-shot
backfill from property_details.listing_events for pre-trigger history.
Tax reassessment forecast NC · Resets to sale price
- Current annual tax
- $1,663 · $139/mo
- Projected year-2 tax
- $1,663 · $139/mo
- Expected delta
- $0/yr ($0/mo · 0.0%)
ⓘ Screening estimate from a state-policy table — verify with the county assessor before closing.
Climate risk First Street
- Flood 1/10 Low FEMA zone X (unshaded) · 0% chance over 30 yrs
- Wildfire 4/10 Moderate
- Heat 9/10 Extreme 7 d/yr ≥106°F today · 18 d/yr by 30 yrs out
- Wind 8/10 Severe 99% chance of damaging wind over 30 yrs
- Air quality 3/10 Moderate 2 unhealthy d/yr today · 3 by 30 yrs out
Nearby sold comps map
Loading sold comps map…
Walkable amenities ~0.75 mi
Loading nearby amenities…
Taxation est. · year 1
- Rental income
- $19,468
- − Mortgage interest
- −$8,122
- − Property taxes
- −$1,663
- − Insurance
- −$725
- − Repairs & maintenance
- −$1,557
- − Management
- −$1,557
- − Depreciation
- −$4,218
- Taxable income
- $1,625
- Est. tax owed @ 24.0%
- −$390
- After-tax cash flow
- $3,477/yr
For passive investors: Depreciation is non-cash, so a rental often shows a tax loss while cash-flowing — sheltering income. Rental losses are passive: they offset passive income freely, and up to $25,000/yr can offset ordinary (W-2) income if you actively participate and your MAGI is under $100k (phasing out to $0 by $150k); unused losses carry forward. On sale, claimed depreciation is recaptured at up to 25%, and gains may owe capital-gains tax (a 1031 exchange can defer both). Figures are a year-1 estimate at your 24.0% rate — not tax advice; consult a CPA.
Schools (NCES district)
- District
- Onslow County Schools
- NCES district ID
- 3703450
- Math proficiency
- 42% ▲ 6.00%
- Reading proficiency
- 49% ▲ 5.00%
- Median HH income
- $46,076
- Composite
- 38.66/100
- National rank
- #4148
- State rank
- #84 of 178 in NC
Livability — Jacksonville
- Score
- 71/100
- State rank
- #111
- US rank
- #6991
Category grades
Schools grade is shown separately in the Schools card above.
Census & demographics
- Census place
- Jacksonville, NC
- County
- Onslow County · 164,453 people
- City population
- 96,397
- Metro
- Jacksonville, NC
- Population (ZIP)
- 49,141
- Household income
- $65,625
- Rent vs Own
- Severe rent burden
- 1304.0
Population outlook (Onslow County) Hauer SSP2
- Today (2025)
- 189,789 people
- By 2030
- 194,463 · +2.5%
- By 2040
- 193,629 · +2.0%
- By 2050
- 193,248 · +1.8%
- By 2075
- 196,995 · +3.8%
- By 2100
- 201,513 · +6.2%
Race, ethnicity, and origin ACS 2023
- Neighborhood character
- Diverse neighborhood (Simpson 0.58)
- Race & ethnicity
- White 62% Black 14% Hispanic / Latino 14% Two or more races 13% Asian 2%
- Hispanic origin (detail)
- Mexican 5% Puerto Rican 6%
- Common ancestry
- Italian 3% Serbian 2% Romanian 2%
- Foreign-born
- 4% · Canada, China
- Languages at home
- 90% English-only · Spanish 7% Chinese 1% Other Asian/Pacific 1%
Political lean MEDSL · Onslow
- 2024 margin
- Solid R (+35.9) · D 31.5% · R 67.5% · Other 1.0%
- 2008→2024 swing
- -14.5pp toward R · 2008: -21.5pp · 2024: -35.9pp
- All cycles
- 2024: R+35.9 2020: R+30.2 2016: R+34.6 2012: R+27.0 2008: R+21.5
Not yet ingested
- Civics
- —
Market trends
- HPI YoY
- ▼ -60.11%
- Current HPI
- 219.5571
- Rent YoY
- ▲ 4.47%
- Metro
- Jacksonville, NC
- State GDP YoY
- ▲ 3.28%
- F500 in state
- 26
Industry mix (Fortune 500 HQ in NC)
| Industry | F500 HQs | Revenue |
|---|---|---|
| Financial Services | 2 | $213B |
|
||
| Retail | 2 | $95B |
|
||
| Industrial Conglomerate | 1 | $38B |
|
||
| Metals / Steel | 1 | $35B |
|
||
| Utilities | 1 | $30B |
|
||
| Industrial Machinery | 1 | $19B |
|
||
Price history
+302.8% since first listed28 events — show timeline
- 2026-05-18 Price Changed $145,000 Hive MLS
- 2026-03-19 Listed $150,000 Hive MLS
- 2025-09-08 Relisted — Hive MLS
- 2025-08-26 Pending — Hive MLS
- 2025-08-26 Listing Removed — Hive MLS
- 2025-07-30 Relisted — Hive MLS
- 2025-07-23 Pending — Hive MLS
- 2025-06-04 Price Changed $150,000 Hive MLS
- 2025-05-02 Price Changed $152,900 Hive MLS
- 2025-04-11 Price Changed $162,900 Hive MLS
- 2025-02-12 Price Changed $170,000 Hive MLS
- 2025-01-29 Price Changed $175,000 Hive MLS
- 2025-01-15 Price Changed $180,000 Hive MLS
- 2024-12-16 Listed $185,900 Hive MLS
- 2022-04-29 Sold (Public Records) $139,000 Public Records
- 2022-04-29 Sold (MLS) $139,000 Hive MLS
- 2022-03-17 Listing Removed — Hive MLS
- 2022-03-13 Listed $139,000 Hive MLS
- 2020-07-24 Sold (MLS) $112,900 Hive MLS
- 2020-02-28 Listed $109,900 Hive MLS
- 2017-10-11 Sold (MLS) $39,100 Hive MLS
- 2017-08-13 Listed $41,500 Hive MLS
- 2017-01-05 Listing Removed — Hive MLS
- 2014-04-08 Listed $66,000 Hive MLS
- 2008-07-03 Sold (Public Records) $97,000 Public Records
- 2008-03-03 Listing Removed — Hive MLS
- 2008-02-26 Listed $105,000 Hive MLS
- 2007-05-16 Sold (Public Records) $36,000 Public Records
Property tax history
+4.2%/yrLatest (2025): $1,663 · +0.0% YoY. Source: county tax records.
Cash-flow waterfall
monthlySold comps — $/sqft
last 12 mo · ≤1 miLoading sold comps…