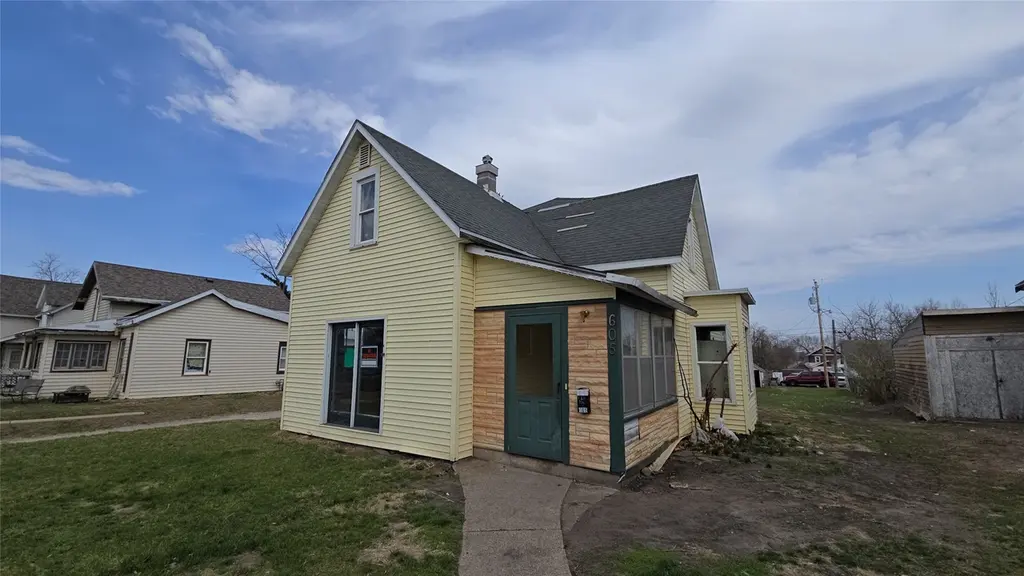
605 N 1st Ave · Marshalltown, IA
Flood risk 1/10 · Minimal
- FEMA flood zone
- X (unshaded)
- Chance of flooding over 30 yrs
- 0.0%
- Est. flood insurance / yr
- $473 – $860
Fire risk 4/10 · Minor
- Est. fire insurance / yr
- $902 – $1,676
Heat risk 3/10 · Minor
- Hot days now (above 102°F)
- 7 days/yr
- Hot days in 30 yrs
- 15 days/yr
Wind risk 2/10 · Minimal
- Chance of severe wind over 30 yrs
- —
Air-quality risk 1/10 · Minimal
- Unhealthy air days now
- 0 days/yr
- Unhealthy air days in 30 yrs
- 0 days/yr
Risk factors via First Street. Map © Google.
Why this score? — see what drove the B grade
The composite is a weighted blend of 9 inputs, each scored 0–100. Each bar is that input's sub-score; the figure is the points it added to the 100-point composite (weight × sub-score).
- Cash flow +30.0/30.0
- 1% rule +10.0/10.0
- DSCR +10.0/10.0
- ARV discount +7.5/15.0
- Schools +4.3/10.0
- Livability +3.9/5.0
- Rent growth +2.5/5.0
- Condition / age +2.5/5.0
- Appreciation +0.0/10.0
$39,900
🖨 Deal sheet 📄 Offer letter ✓ Due diligence
Listing remarks MLS
This is a great opportunity to own a home in Marshalltown Iowa. This three bedroom One and a half bathroom home features a front porch and roomy main floor. There is main floor laundry hook up, main floor bathroom, and room for a main floor bedroom. This sweat equity great investment won't last! Take a look today with your favorite Realtor.
Key facts
- Front porch
- Main floor bathroom
- 9,000 sq ft lot
Tags
Neighborhood map
What this means for you Summary
Snapshot
- This is a 3-bed/1.0-bath single-family listed at $40k.
Deal economics
- At list price, monthly cash flow is $415 ($5k/yr) — positive.
- The deal already cash-flows at list — no discount required.
- Meets the 1% rule at list price ($965 rent vs $40k).
- Recommended offer: $38k (6.0% below list) — sets the bar for market timing.
- Cap rate 18.8% vs local median 4.5% in Marshalltown — top-decile yield for the area; either an underpriced asset or a hidden risk that comps aren't pricing in. Stress-test before assuming the spread holds.
Location & tenants
- Location reads 78/100 on livability (#133 in IA, #2,464 nationally) — a middle-class / working-renter tenant base. Strengths: commute A+, cost of living A+, housing A+; Watch: employment C-, amenities F.
- Marshalltown Community School District (town): math 50% / reading 52% proficiency, ranked #278 of 289 in IA (top 96%) — acceptable for families but not a draw, mixed tenant base, ~2y average lease; 60% free/reduced lunch — lower-income household profile, screen leases tightly.
- Market conditions: 161 active listings in the ZIP; 3 comparable units currently listed for rent nearby; rentals lingering (median 44d on market — plan ~5-8 weeks vacancy on turnover, expect pricing pressure); 100% of comp listings sitting > 30 days — soft ceiling on asking rent; 35 units permitted in Marshall County in 2024 (0 in 5+ unit buildings).
- This rent is only 16% of the median local income ($70k/yr) — well below the 30% rent-burden line; pricing power to push rent on renewal without tenant pushback.
Forward outlook
- Local home prices are declining (-3.0%/yr); year-one equity from $276 of loan paydown is wiped out by about $1k of value loss. Plan a longer hold.
- Marshall County population projected at +8% by 2050 — modest demand growth; plan on rents tracking national, not racing it.
- At projected returns (-3.0% appreciation + 3.0% rent growth), your $11k cash investment doubles in ~3 years — after that, you're playing with house money.
Negotiation context
- It's been on market 72 days — a 6% lower offer ($38k) is reasonable based on typical stale-listing flexibility.
- 2 sale attempts since 8y ago; this cycle's ask has dropped $10k (20%) from the opening price — seller is motivated, your offer sets the floor, not the list.
Risks & watch-outs
- Watch-outs: property tax is 3.6% of price; built in 1910 — expect roof / HVAC / electrical / plumbing capex.
Questions for the listing agent
- It's been on market 72 days. Have you received any prior offers? Is the seller open to a 6% concession, seller financing, or rate buy-down credit?
- Built in 1910 — when were the roof, HVAC, electrical panel, plumbing, and water heater last replaced?
- Property tax is high relative to price — has the assessment been appealed recently, and will the sale trigger a re-assessment?
- Why hasn't it sold? Are there any deal-killer items the seller is aware of (foundation, flood, title, zoning, code violations)?
- Is there a deadline driving the sale (1031 exchange, divorce, estate, relocation)? That informs how much negotiation room exists.
- What's the average days-on-market for RENTAL listings here right now (not sales)? A rising rental-DOM trend means longer vacancies and softer asking-rent achievability than the comps imply.
- What's the recent tenant-quality profile in this submarket — average credit score on applications, eviction rate, late-payment / NSF rate, and stable-employment percentage? A property-management company in the area should have these aggregated.
- How much new for-sale + rental construction is in the pipeline within 1–3 miles? Heavy new supply typically softens prices + rents 12–24 months out; constrained supply supports both.
Investment metrics
- 1% rule
- 2.42% ✓
- Cap rate
- 18.79%
- Cash-on-cash
- 44.62%
- DSCR
- 2.99
- GRM
- 3.4
CMA / ARV
- ARV (median comp)
- $84,852
- List price
- $39,900
- Delta
- -52.98%
- Verdict
- UNDERPRICED
- Comps
- 20 within 1.0 mi
Show comp detail 12 sales within ~0.75 mi
| Address | Dist | Beds/Ba | Sqft | Sold | Price | $/sf | Match |
|---|---|---|---|---|---|---|---|
| 409 N 3rd Ave | 0.22mi | 3/2.0 | 1,188 (-0%) | 2mo | $30,000 | $25 | 84 |
| 603 N 1st Ave | 0.01mi | 3/1.0 | 1,100 (-8%) | 4mo | $31,000 | $28 | 84 |
| 504 N 1st St | 0.22mi | 3/2.0 | 1,142 (-4%) | 5mo | $117,400 | $103 | 75 |
| 607 N 2nd Ave | 0.08mi | 3/1.5 | 1,042 (-12%) | 9mo | $55,000 | $53 | 66 |
| 5 W Lincoln St | 0.22mi | 2/1.0 (-1) | 1,073 (-10%) | 6mo | $79,000 | $74 | 63 |
| 408 Swayze St | 0.30mi | 3/1.0 | 1,015 (-15%) | 2mo | $98,000 | $97 | 60 |
| 609 N 5th Ave | 0.32mi | 3/1.0 | 1,041 (-12%) | 6mo | $50,000 | $48 | 59 |
| 207 1st St | 0.34mi | 2/1.0 (-1) | 1,312 (+10%) | 7mo | $145,000 | $111 | 56 |
| 508 1/2 N 2nd St | 0.29mi | 3/1.0 | 1,362 (+14%) | 11mo | $99,000 | $73 | 53 |
| 112 N 5th St | 0.65mi | 4/2.0 (+1) | 1,081 (-9%) | 7mo | $85,000 | $79 | 39 |
| 105 S 2nd St | 0.72mi | 2/1.0 (-1) | 1,091 (-8%) | 11mo | $93,000 | $85 | 38 |
| 603 Fremont St | 0.69mi | 3/1.5 | 1,362 (+14%) | 6mo | $122,000 | $90 | 37 |
Match score weights: distance 35% · size 25% · config 20% · recency 20%. Top-matched comps best support the ARV.
Projected returns pro-forma
-3.0% appreciation · 3.0% rent growth · sell at horizon
- IRR
- 41.7%
- Equity multiple
- 2.79×
- Total profit
- $20,052
- Equity at exit
- $5,949
- IRR
- 47.9%
- Equity multiple
- 5.63×
- Total profit
- $51,769
- Equity at exit
- $3,450
Cash invested: $11,172 (down + closing). Projections, not guarantees.
Landlord ↔ Tenant lean methodology
- Overall (STATE)
- 83 Strongly Landlord-Friendly
- State Iowa
- 83 Strongly Landlord-Friendly · R+6
- County
- — inherits STATE
- City
- — inherits STATE
ZIP-level market 50158
- Active inventory
- 161
- Price-to-rent
- 3.4×
Monthly cashflow live
- Estimated rent
- $965 medium interval (Pro) →
- Mortgage (P&I)
- −$209
- Tax from tax record
- −$121 /mo · $1,455/yr
- Insurance
- −$17
- HOA
- −$0
- Vacancy / Maint / Mgmt
- −$203
- Net cashflow
- $415
Break-even live
UW: 25.0% down · 7.5% · 30yr · 1.5% tax · 5.0% vac · 8.0% maint · 8.0% mgmt
Financing live
Cash to close
- Down payment
- $9,975
- Closing costs
- $1,197
- Reserves months
- —
- Total cash needed
- —
Loan-product check · same deal, 3 products live
Conventional
25% down · 7.5% · 30yr
- Down + closing
- —
- Monthly P&I
- —
- Monthly cashflow
- —
- DSCR
- —
- Eligible?
- —
Personal DTI + credit; lowest rate.
DSCR
20% down · 8.5% · 30yr
- Down + closing
- —
- Monthly P&I
- —
- Monthly cashflow
- —
- DSCR
- —
- Eligible?
- —
No personal income docs; deal must DSCR.
Hard money
10% down · 12.0% · 12mo
- Down + closing
- —
- Monthly P&I
- —
- Monthly cashflow
- —
- DSCR
- —
- Eligible?
- —
Short-term bridge; refi at stabilization.
Rent comps 3 comps
| Address | Beds | Baths | Sqft | Rent | $/sqft | DOM | Units | Dist |
|---|---|---|---|---|---|---|---|---|
| 511 W State St Unit 5 Marshalltown, IA | 2.0 | 1.0 | 911 | $895 | $0.98 | 43d | 1 | 0.70mi |
| 511 S 7th Ave Marshalltown, IA | 2.0 | 1.0 | 784 | $738 | $0.94 | 43d | 2 | 1.19mi |
| 605 S 7th Ave Unit 605-01 Marshalltown, IA | 2.0 | 1.0 | 784 | $700 | $0.89 | 43d | 1 | 1.22mi |
Listing history 22 events
-
2026-06-19days on market $39,900 Active 72 DOM
-
2026-06-18days on market $39,900 Active 71 DOM
-
2026-06-17days on market $39,900 Active 70 DOM
-
2026-06-16days on market $39,900 Active 69 DOM
-
2026-06-15days on market $39,900 Active 68 DOM
-
2026-06-14days on market $39,900 Active 66 DOM
-
2026-06-12days on market $39,900 Active 65 DOM
-
2026-06-09days on market $39,900 Active 62 DOM
-
2026-06-09price $39,900 Active 61 DOM
-
2026-06-08days on market $49,900 Active 61 DOM
-
2026-06-07days on market $49,900 Active 60 DOM
-
2026-06-05days on market $49,900 Active 57 DOM
-
2026-06-03days on market $49,900 Active 56 DOM
-
2026-06-02days on market $49,900 Active 55 DOM
-
2026-06-01days on market $49,900 Active 54 DOM
-
2026-05-31days on market $49,900 Active 53 DOM
-
2026-05-30days on market $49,900 Active 52 DOM
-
2026-04-08$49,900 Active 342-char remark
Show marketing remark (342 chars)
This is a great opportunity to own a home in Marshalltown Iowa. This three bedroom One and a half bathroom home features a front porch and roomy main floor. There is main floor laundry hook up, main floor bathroom, and room for a main floor bedroom. This sweat equity great investment won't last! Take a look today with your favorite Realtor.
-
2018-06-19soldstatus $58,000 353-char remark
Show marketing remark (353 chars)
Nice 3 Bedroom home with many updates throughout including newer elecrical, plumbing, bathroom and kitchen. Exterior is vinyl siding and all on spacious lot. Enter through an enclosed porch on the front or just sit and enjoy the evening sun set. Features do include main floor laundry. Kitchen appliances included and a 1 year Home Warranty! Call Today!
-
2018-06-19soldstatus $58,000
Show marketing remark (353 chars)
Nice 3 Bedroom home with many updates throughout including newer elecrical, plumbing, bathroom and kitchen. Exterior is vinyl siding and all on spacious lot. Enter through an enclosed porch on the front or just sit and enjoy the evening sun set. Features do include main floor laundry. Kitchen appliances included and a 1 year Home Warranty! Call Today!
-
2018-05-03$63,000 353-char remark
Show marketing remark (353 chars)
Nice 3 Bedroom home with many updates throughout including newer elecrical, plumbing, bathroom and kitchen. Exterior is vinyl siding and all on spacious lot. Enter through an enclosed porch on the front or just sit and enjoy the evening sun set. Features do include main floor laundry. Kitchen appliances included and a 1 year Home Warranty! Call Today!
-
2007-11-28soldstatus $82,000
ⓘ Source: listings_history table (triggers on properties + properties_extension) + one-shot
backfill from property_details.listing_events for pre-trigger history.
Tax reassessment forecast IA · Partial reset (capped growth)
- Current annual tax
- $1,455 · $121/mo
- Projected year-2 tax
- $1,455 · $121/mo
- Expected delta
- $0/yr ($0/mo · 0.0%)
ⓘ Screening estimate from a state-policy table — verify with the county assessor before closing.
Climate risk First Street
- Flood 1/10 Low FEMA zone X (unshaded) · 0% chance over 30 yrs
- Wildfire 4/10 Moderate
- Heat 3/10 Moderate 7 d/yr ≥102°F today · 15 d/yr by 30 yrs out
- Wind 2/10 Low
- Air quality 1/10 Low 0 unhealthy d/yr today · 0 by 30 yrs out
Nearby sold comps map
Loading sold comps map…
Walkable amenities ~0.75 mi
Loading nearby amenities…
Taxation est. · year 1
- Rental income
- $11,583
- − Mortgage interest
- −$2,235
- − Property taxes
- −$1,455
- − Insurance
- −$200
- − Repairs & maintenance
- −$927
- − Management
- −$927
- − Depreciation
- −$1,161
- Taxable income
- $4,679
- Est. tax owed @ 24.0%
- −$1,123
- After-tax cash flow
- $3,862/yr
For passive investors: Depreciation is non-cash, so a rental often shows a tax loss while cash-flowing — sheltering income. Rental losses are passive: they offset passive income freely, and up to $25,000/yr can offset ordinary (W-2) income if you actively participate and your MAGI is under $100k (phasing out to $0 by $150k); unused losses carry forward. On sale, claimed depreciation is recaptured at up to 25%, and gains may owe capital-gains tax (a 1031 exchange can defer both). Figures are a year-1 estimate at your 24.0% rate — not tax advice; consult a CPA.
Schools (NCES district)
- District
- Marshalltown Community School District
- NCES district ID
- 1918720
- Math proficiency
- 50% ▼ -8.00%
- Reading proficiency
- 52% ▬ 0.00%
- Median HH income
- $47,877
- Composite
- 43.41/100
- National rank
- #3015
- State rank
- #278 of 289 in IA
Livability — Marshalltown
- Score
- 78/100
- State rank
- #133
- US rank
- #2464
Category grades
Schools grade is shown separately in the Schools card above.
Census & demographics
- Census place
- Marshalltown, IA
- County
- Marshall County · 31,396 people
- City population
- 31,396
- Metro
- Marshalltown, IA
- Population (ZIP)
- 31,396
- Household income
- $70,367
- Rent vs Own
- Severe rent burden
- 369.0
Population outlook (Marshall County) Hauer SSP2
- Today (2025)
- 41,166 people
- By 2030
- 41,477 · +0.8%
- By 2040
- 42,548 · +3.4%
- By 2050
- 44,472 · +8.0%
- By 2075
- 52,719 · +28.1%
- By 2100
- 60,912 · +48.0%
Race, ethnicity, and origin ACS 2023
- Neighborhood character
- Majority White (60%)
- Race & ethnicity
- White 60% Hispanic / Latino 30% Two or more races 14% Asian 5% Black 2% Native American 1%
- Hispanic origin (detail)
- Mexican 25%
- Common ancestry
- Portuguese 3% Italian 2% Iranian 1%
- Foreign-born
- 17% · Canada, Philippines, China
- Languages at home
- 71% English-only · Spanish 24% Other Asian/Pacific 4% French/Haitian/Cajun 1%
Political lean MEDSL · Marshall
- 2024 margin
- R (+15.6) · D 41.4% · R 57.0% · Other 1.6%
- 2008→2024 swing
- -24.9pp toward R · 2008: 9.3pp · 2024: -15.6pp
- All cycles
- 2024: R+15.6 2020: R+7.7 2016: R+8.5 2012: D+8.9 2008: D+9.3
Not yet ingested
- Civics
- —
Market trends
- HPI YoY
- ▼ -161.80%
- Current HPI
- 177.4692
- Rent YoY
- —
- Metro
- Marshalltown, IA
- State GDP YoY
- ▲ 2.48%
- F500 in state
- 4
Industry mix (Fortune 500 HQ in IA)
| Industry | F500 HQs | Revenue |
|---|---|---|
| Financial Services | 1 | $16B |
|
||
| Retail / Convenience | 1 | $15B |
|
||
Price history
-39.1% since first listed5 events — show timeline
- 2026-04-08 Listed $49,900 DMMLS
- 2018-06-19 Sold (Public Records) $58,000 Public Records
- 2018-06-19 Sold (MLS) $58,000 IAR
- 2018-05-03 Listed $63,000 IAR
- 2007-11-28 Sold (Public Records) $82,000 Public Records
Property tax history
+1.3%/yrLatest (2025): $1,455 · -45.6% YoY. Source: county tax records.
Cash-flow waterfall
monthlySold comps — $/sqft
last 12 mo · ≤1 miLoading sold comps…