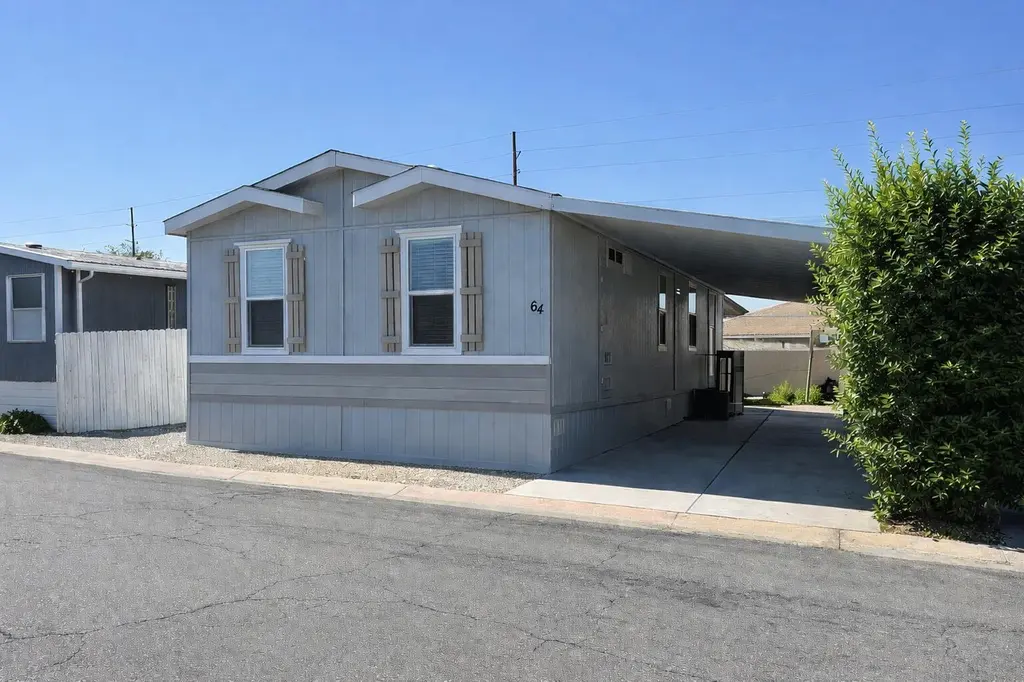
81351 Avenue 46 #64 · Indio, CA
Flood risk 1/10 · Minimal
- FEMA flood zone
- X (unshaded)
- Chance of flooding over 30 yrs
- 0.0%
- Est. flood insurance / yr
- $507 – $1,088
Fire risk 1/10 · Minimal
- Est. fire insurance / yr
- $659 – $1,223
Heat risk 10/10 · Severe
- Hot days now (above 114°F)
- 6 days/yr
- Hot days in 30 yrs
- 15 days/yr
Wind risk 1/10 · Minimal
- Chance of severe wind over 30 yrs
- —
Air-quality risk 3/10 · Minor
- Unhealthy air days now
- 3 days/yr
- Unhealthy air days in 30 yrs
- 5 days/yr
Risk factors via First Street. Map © Google.
Why this score? — see what drove the B- grade
The composite is a weighted blend of 9 inputs, each scored 0–100. Each bar is that input's sub-score; the figure is the points it added to the 100-point composite (weight × sub-score).
- Cash flow +30.0/30.0
- 1% rule +10.0/10.0
- DSCR +10.0/10.0
- ARV discount +7.5/15.0
- Schools +3.8/10.0
- Rent growth +3.3/5.0
- Livability +2.7/5.0
- Condition / age +2.5/5.0
- Appreciation +0.0/10.0
$159,900
🖨 Deal sheet (PDF) 📄 Offer letter ✓ Due diligence
Listing remarks
Welcome to this beautifully and colorful well maintained 2020 manufactured home located in the desirable community of Pueblo Del Sol off Avenue 46. This like-new home features 3 bedrooms, 2 bathrooms, and an open-concept floor plan perfect for comfortable living and entertaining. Pride of ownership shines throughout as this home has been meticulously cared for by its original owner. Enjoy a prime location within the community, complete with a spacious two-car carport. Pueblo Del Sol offers great amenities including a clubhouse, pools, spa/Jacuzzi, and roaming security for added peace of mind. All prospective buyers must be approved by park management. Please contact agent for application in
Key facts
- Garage
- Community pool
- Built 2020
Property features AI
Finance
- Other: Rental restrictions apply; Will not consider lease; Possession at close of escrow
- Financial info: Land is lease type with annual land lease amount of $12,000; Sale terms: Cash
- HOA & community: No monthly association fees listed; Community has rules: CC & R and pet restrictions; Park type: Family; Park name: Pueblo Del Sol; Park manager approval required
Exterior
- Parking: Attached carport; 2 carport spaces (total 2 parking spaces)
- Security: No security features
- Utilities: Sewer: in, connected and paid; TV/Cable available; PUD: No
- Home design: Detached property; Ground level; Single-story; Double-wide manufactured home
- Construction: 24 ft wide, 48 ft long double-wide manufactured home; Fleetwood Homes manufacture; Model: 220CL Canyon Lake 24443X; Manufacture date: 11/6/2020; Mobile home will remain
- Exterior features: Back yard; Community in-ground pool; Community in-ground spa/hot tub
Interior
- Kitchen: Corian counters; Dishwasher; Garbage disposal
- Bedrooms: Main floor bedroom
- Flooring: Carpet; Laminate
- Bathrooms: 2 full bathrooms
- Heating & cooling: Central heating; Central air conditioning
- Interior features: Unfurnished; Dining area; Living room; Breakfast nook / breakfast counter/bar
Neighborhood map
What this means for you Summary
Snapshot
- This is a 3-bed/2.0-bath manufactured listed at $160k.
Deal economics
- At list price, monthly cash flow is $948 ($11k/yr) — positive.
- The deal already cash-flows at list — no discount required.
- Meets the 1% rule at list price ($2k rent vs $160k).
- Cap rate 13.4% vs local median 4.3% in Indio — top-decile yield for the area; either an underpriced asset or a hidden risk that comps aren't pricing in. Stress-test before assuming the spread holds.
Location & tenants
- Location reads 53/100 on livability (#927 in CA) — a working-class tenant base; expect higher turnover. Strengths: housing B+; Watch: employment D, crime F, amenities F.
- Desert Sands Unified (suburban): math 31% / reading 56% proficiency, ranked #199 of 517 in CA (top 38%) — families likely to look elsewhere, expect single-tenant / working-renter base with shorter leases.
- Zoned schools: James Madison Elementary (377 students, 85% FRL); Indio Middle (784 students, 89% FRL); Indio High (math 15% / reading 42%, grade F, #774 of 1,170 statewide, top 66%, 2,143 students, 92% FRL) — zoned schools average 89% FRL vs 56% district-wide (33 pts higher); higher-poverty schools than district average — tighter screening recommended.
- Zoned-school proficiency averages 28% at this address vs 44% district-wide (-15 pts) — the specific schools serving this property underperform the Desert Sands Unified average; the district grade overstates school quality for this exact location.
- Market conditions: Rents rising (+3.3%/yr); 515 active listings in the ZIP; 31 comparable units currently listed for rent nearby; rentals at typical pace (median 26d on market — plan ~3-4 weeks tenant-placement turnaround); 48% of comp listings sitting > 30 days — soft ceiling on asking rent; 9,195 units permitted in Riverside County in 2024 (1,512 in 5+ unit buildings).
- This rent runs 44% of the median local income ($67k/yr) — at the standard rent-burdened threshold; future hikes will face affordability resistance.
Forward outlook
- Local home prices are declining (-3.0%/yr); year-one equity from $1k of loan paydown is wiped out by about $5k of value loss. Plan a longer hold.
- Riverside County population projected at +22% by 2050 — long-run rental-demand tailwind backs the buy-and-hold thesis.
- At projected returns (-3.0% appreciation + 3.3% rent growth), your $45k cash investment doubles in ~5 years — after that, you're playing with house money.
Negotiation context
- Only 14 days on market — expect competitive offers; lowballing is unlikely to land.
Risks & watch-outs
- Climate carrying-cost: extreme-heat days projected 6→15/yr by 2055 (HVAC capex compounding) — expect insurance premiums to compound above CPI over the hold.
Questions for the listing agent
- Is there a deadline driving the sale (1031 exchange, divorce, estate, relocation)? That informs how much negotiation room exists.
- Schools are F-rated, which usually means shorter tenancies and higher turnover. Who's the typical renter profile here, and what's been the actual vacancy rate?
- Crime grade is F in this area — have there been break-ins, vandalism, or insurance claims at this property in the last 3 years? What carrier currently insures it and at what premium?
- What's the average days-on-market for RENTAL listings here right now (not sales)? A rising rental-DOM trend means longer vacancies and softer asking-rent achievability than the comps imply.
- What's the recent tenant-quality profile in this submarket — average credit score on applications, eviction rate, late-payment / NSF rate, and stable-employment percentage? A property-management company in the area should have these aggregated.
- How much new for-sale + rental construction is in the pipeline within 1–3 miles? Heavy new supply typically softens prices + rents 12–24 months out; constrained supply supports both.
Investment metrics
- 1% rule
- 1.53% ✓
- Cap rate
- 13.41%
- Cash-on-cash
- 25.40%
- DSCR
- 2.13
- GRM
- 5.5
CMA / ARV
- ARV (on-the-fly)
- $92,086
- Comps found
- 9
Show comp detail 9 sales within ~0.75 mi
| Address | Dist | Beds/Ba | Sqft | Sold | Price | $/sf | Match |
|---|---|---|---|---|---|---|---|
| 81351 Avenue 46 #64 | 0.00mi | 3/2.0 | 1,123 (0%) | 1mo | $142,000 | $126 | 100 |
| 80870 California 111 #184 | 0.60mi | 2/2.0 (-1) | 1,140 (+2%) | 0mo | $75,000 | $66 | 64 |
| 46618 Madison St #153 | 0.41mi | 2/2.0 (-1) | 1,056 (-6%) | 3mo | $195,000 | $185 | 64 |
| 80870 Highway 111 #95 | 0.66mi | 2/2.0 (-1) | 1,152 (+3%) | 2mo | $75,000 | $65 | 58 |
| 80870 CA-111 #30 | 0.51mi | 2/2.0 (-1) | 1,040 (-7%) | 2mo | $69,997 | $67 | 58 |
| 80870 Highway 111 #157 | 0.59mi | 2/2.0 (-1) | 1,152 (+3%) | 14mo | $189,900 | $165 | 51 |
| 46618 Madison St #8 | 0.41mi | 2/2.0 (-1) | 1,272 (+13%) | 11mo | $158,650 | $125 | 45 |
| 80870 Highway 111 #125 | 0.59mi | 2/2.0 (-1) | 1,040 (-7%) | 22mo | $85,000 | $82 | 37 |
| 80870 Highway 111 Spc 75 | 0.66mi | 2/2.0 (-1) | 1,240 (+10%) | 23mo | $75,000 | $60 | 28 |
Match score weights: distance 35% · size 25% · config 20% · recency 20%. Top-matched comps best support the ARV.
Projected returns pro-forma
-3.0% appreciation · 3.34% rent growth · sell at horizon
- IRR
- 19.3%
- Equity multiple
- 1.79×
- Total profit
- $35,250
- Equity at exit
- $23,842
- IRR
- 27.8%
- Equity multiple
- 3.50×
- Total profit
- $111,727
- Equity at exit
- $13,825
Cash invested: $44,772 (down + closing). Projections, not guarantees.
Landlord ↔ Tenant lean methodology
- Overall (STATE)
- 18 Strongly Tenant-Friendly
- State California
- 18 Strongly Tenant-Friendly · D+13
- County
- — inherits STATE
- City
- — inherits STATE
ZIP-level market 92201
- Home prices YoY
- -28.4%
- Rents YoY
- 3.3%
- Active inventory
- 515
- Price-to-rent
- 5.5×
Monthly cashflow live
- Estimated rent
- $2,442 high interval (Pro) →
- Mortgage (P&I)
- −$839
- Tax from tax record
- −$77 /mo · $920/yr
- Insurance
- −$67
- HOA
- −$0
- Vacancy / Maint / Mgmt
- −$513
- Net cashflow
- $948
Break-even live
Sensitivity live
| Price | -10% $1,038 | -5% $993 | +0% $948 | +5% $902 | +10% $857 |
|---|---|---|---|---|---|
| Rent | -10% $755 | -5% $851 | +0% $948 | +5% $1,044 | +10% $1,141 |
| Rate | -1.0pp $1,028 | -0.5pp $988 | base $948 | +0.5pp $906 | +1.0pp $864 |
UW: 25.0% down · 7.5% · 30yr · 1.5% tax · 5.0% vac · 8.0% maint · 8.0% mgmt
Financing live
Cash to close
- Down payment
- $39,975
- Closing costs
- $4,797
- Reserves months
- —
- Total cash needed
- —
Loan-product check · same deal, 3 products live
Conventional
25% down · 7.5% · 30yr
- Down + closing
- —
- Monthly P&I
- —
- Monthly cashflow
- —
- DSCR
- —
- Eligible?
- —
Personal DTI + credit; lowest rate.
DSCR
20% down · 8.5% · 30yr
- Down + closing
- —
- Monthly P&I
- —
- Monthly cashflow
- —
- DSCR
- —
- Eligible?
- —
No personal income docs; deal must DSCR.
Hard money
10% down · 12.0% · 12mo
- Down + closing
- —
- Monthly P&I
- —
- Monthly cashflow
- —
- DSCR
- —
- Eligible?
- —
Short-term bridge; refi at stabilization.
Rent comps 31 comps
| Address | Beds | Baths | Sqft | Rent | $/sqft | DOM | Units | Dist |
|---|---|---|---|---|---|---|---|---|
| 81272 Palmwood Dr Indio, CA | 3.0 | 2.0 | 1104 | $3,200 | $2.90 | 45d | 1 | 0.27mi |
| 46675 Desert Villa St Indio, CA | 2.0 | 1.0–1.5 | 881 | $1,590 | $1.80 | 45d | 1 | 0.33mi |
| 81683 De Plata Ave Indio, CA | 3.0 | 2.0 | 1216 | $3,100 | $2.55 | 20d | 1 | 0.38mi |
| 45546 Aladdin St Unit D201 Indio, CA | 2.0 | 1.0 | 907 | $1,549 | $1.71 | 45d | 1 | 0.52mi |
| 81720 Avenue Indio, CA | 2.0 | 2.0 | 1080 | $1,795 | $1.66 | 45d | 1 | 0.52mi |
| 81840 Avenida del Mar Unit A203 Indio, CA | 2.0 | 2.0 | 874 | $1,750 | $2.00 | 25d | 1 | 0.58mi |
| 80870 California 111 Unit 223 Indio, CA | 2.0 | 2.0 | 1400 | $1,550 | $1.11 | 45d | 1 | 0.61mi |
| 46745 Monroe St Indio, CA | 1.0–2.0 | 1.0–2.0 | 880 | $2,070 | $2.35 | 3d | 11 | 0.63mi |
| 81153 Francis Ave Indio, CA | 3.0 | 2.0 | 1288 | $2,800 | $2.17 | 6d | 1 | 0.63mi |
| 80675 Harvard Ct Indio, CA | 3.0 | 2.0 | 1248 | $2,495 | $2.00 | 12d | 1 | 0.72mi |
| 47395 Monroe St #286 Indio, CA | 2.0 | 2.0 | 1021 | $2,300 | $2.25 | 25d | 1 | 0.80mi |
| 47395 Monroe St #264 Indio, CA | 3.0 | 2.0 | 1257 | $3,200 | $2.55 | 45d | 1 | 0.80mi |
| 82165 Doctor Carreon Blvd Indio, CA | 1.0–2.0 | 1.0–2.0 | 828 | $2,150 | $2.60 | 5d | 11 | 0.88mi |
| 47800 Madison St Indio, CA | 3.0 | 2.0 | 1456 | $2,850 | $1.96 | 45d | 1 | 0.90mi |
| 44313 Larrea St Indio, CA | 3.0 | 2.0 | 1219 | $2,400 | $1.97 | 25d | 1 | 0.94mi |
| 81351 Fred Waring Dr Unit 215 Indio, CA | 2.0 | 1.0 | 946 | $1,595 | $1.69 | 14d | 1 | 1.00mi |
| 81351 Fred Waring Dr Apt 218 Indio, CA | 2.0 | 1.0 | 946 | $1,595 | $1.69 | 45d | 1 | 1.00mi |
| 81955 Hoover Ave Indio, CA | 1.0–2.0 | 1.0–2.0 | 799 | $1,895 | $2.37 | 45d | 1 | 1.02mi |
| 81641 Avenue 48 Indio, CA | 2.0 | 2.0 | 1440 | $2,500 | $1.74 | 45d | 1 | 1.07mi |
| 82451 John Nobles Ave Unit 19 Indio, CA | 3.0 | 1.5 | 900 | $1,795 | $1.99 | 45d | 1 | 1.11mi |
| 82377 Rebecca Dr Indio, CA | 3.0 | 2.0 | 952 | $2,400 | $2.52 | 45d | 1 | 1.12mi |
| 80208 Royal Birkdale Dr Indio, CA | 2.0 | 2.0 | 1382 | $3,875 | $2.80 | 25d | 1 | 1.13mi |
| 44900 Rubidoux St Indio, CA | 3.0 | 2.0 | 1158 | $2,295 | $1.98 | 6d | 1 | 1.14mi |
| 82435 Requa Ave Apt 01 Indio, CA | 2.0 | 1.5 | 769 | $1,595 | $2.07 | 45d | 1 | 1.14mi |
| 81777 Avenue 48 Indio, CA | 1.0–2.0 | 1.0 | 820 | $1,950 | $2.38 | 4d | 5 | 1.15mi |
| 81875 Avenue 48 Indio, CA | 1.0–2.0 | 1.0–2.0 | 804 | $2,185 | $2.72 | 11d | 6 | 1.17mi |
| 81875 Avenue 48 Indio, CA | 1.0–2.0 | 1.0–2.0 | 805 | $2,185 | $2.71 | 0d | 6 | 1.17mi |
| 48255 Monroe St #20 Indio, CA | 2.0 | 2.0 | 998 | $2,200 | $2.20 | 25d | 1 | 1.25mi |
| 48255 Monroe St Indio, CA | 1.0–2.0 | 2.0 | 932 | $2,200 | $2.36 | 45d | 2 | 1.26mi |
| 82481 Valencia Ave Indio, CA | 2.0 | 1.0 | 900 | $1,750 | $1.94 | 45d | 1 | 1.30mi |
| 46896 Jefferson St Indio, CA | 2.0 | 2.0 | 1100 | $2,075 | $1.89 | 0d | 3 | 1.36mi |
Listing history 3 events
-
2026-04-29status Pending
-
2026-04-15$159,900 Active
-
2026-04-07historical $159,900
ⓘ Source: listings_history table (triggers on properties + properties_extension) + one-shot
backfill from property_details.listing_events for pre-trigger history.
Tax reassessment forecast CA · Resets to sale price
- Current annual tax
- $920 · $77/mo
- Projected year-2 tax
- $1,215 · $101/mo
- Expected delta
- +$295/yr (+$25/mo · 32.1%)
ⓘ Screening estimate from a state-policy table — verify with the county assessor before closing.
Climate risk First Street
- Flood 1/10 Low FEMA zone X (unshaded) · 0% chance over 30 yrs
- Wildfire 1/10 Low
- Heat 10/10 Extreme 6 d/yr ≥114°F today · 15 d/yr by 30 yrs out
- Wind 1/10 Low
- Air quality 3/10 Moderate 3 unhealthy d/yr today · 5 by 30 yrs out
Nearby sold comps map
Loading sold comps map…
Walkable amenities ~0.75 mi
Loading nearby amenities…
Taxation est. · year 1
- Rental income
- $29,310
- − Mortgage interest
- −$8,957
- − Property taxes
- −$920
- − Insurance
- −$800
- − Repairs & maintenance
- −$2,345
- − Management
- −$2,345
- − Depreciation
- −$4,652
- Taxable income
- $9,292
- Est. tax owed @ 24.0%
- −$2,230
- After-tax cash flow
- $9,143/yr
For passive investors: Depreciation is non-cash, so a rental often shows a tax loss while cash-flowing — sheltering income. Rental losses are passive: they offset passive income freely, and up to $25,000/yr can offset ordinary (W-2) income if you actively participate and your MAGI is under $100k (phasing out to $0 by $150k); unused losses carry forward. On sale, claimed depreciation is recaptured at up to 25%, and gains may owe capital-gains tax (a 1031 exchange can defer both). Figures are a year-1 estimate at your 24.0% rate — not tax advice; consult a CPA.
Schools (NCES district)
- District
- Desert Sands Unified
- NCES district ID
- 0611110
- Math proficiency
- 31% ▼ -4.00%
- Reading proficiency
- 56% ▲ 7.00%
- Median HH income
- $54,957
- Composite
- 37.77/100
- National rank
- #4346
- State rank
- #199 of 517 in CA
Livability — Indio
- Score
- 53/100
- State rank
- #927
- US rank
- #24244
Category grades
Schools grade is shown separately in the Schools card above.
Census & demographics
- Census place
- Indio, CA
- County
- Riverside County · 2,287,001 people
- City population
- 100,560
- Metro
- Riverside-San Bernardino-Ontario, CA
- Population (ZIP)
- 65,825
- Household income
- $66,758
- Rent vs Own
- Severe rent burden
- 2036.0
Population outlook (Riverside County) Hauer SSP2
- Today (2025)
- 2,664,475 people
- By 2030
- 2,802,692 · +5.2%
- By 2040
- 3,050,904 · +14.5%
- By 2050
- 3,256,783 · +22.2%
- By 2075
- 3,655,058 · +37.2%
- By 2100
- 3,766,594 · +41.4%
Race, ethnicity, and origin ACS 2023
- Neighborhood character
- Predominantly Hispanic (74%)
- Race & ethnicity
- Hispanic / Latino 74% Two or more races 39% White 19% Black 3% Asian 3% Native American 1%
- Hispanic origin (detail)
- Mexican 69%
- Common ancestry
- Romanian 1% Iranian 1%
- Foreign-born
- 29% · Canada, Vietnam, Jamaica
- Languages at home
- 41% English-only · Spanish 55% Arabic 1% Tagalog/Filipino 1%
Political lean MEDSL · Riverside
- 2024 margin
- Toss-up / Even · D 48.0% · R 49.3% · Other 2.6%
- 2008→2024 swing
- -3.6pp toward R · 2008: 2.3pp · 2024: -1.3pp
- All cycles
- 2024: R+1.3 2020: D+8.0 2016: D+4.3 2012: R+0.4 2008: D+2.3
Not yet ingested
- Civics
- —
Market trends
- HPI YoY
- ▼ -138.46%
- Current HPI
- 348.6605
- Rent YoY
- ▲ 3.34%
- Metro
- Riverside-San Bernardino-Ontario, CA
- State GDP YoY
- ▲ 3.21%
- F500 in state
- 116
Industry mix (Fortune 500 HQ in CA)
| Industry | F500 HQs | Revenue |
|---|---|---|
| Technology | 27 | $1,492B |
|
||
| Financial Services | 3 | $174B |
|
||
| Retail | 3 | $44B |
|
||
| Insurance | 3 | $26B |
|
||
| Media / Entertainment | 2 | $115B |
|
||
| Pharmaceuticals / Biotech | 2 | $62B |
|
||
Price history
+0.0% since first listed3 events — show timeline
- 2026-04-29 Pending — GPSMLS
- 2026-04-15 Listed $159,900 GPSMLS
- 2026-04-07 Coming Soon $159,900 GPSMLS
Property tax history
+13.2%/yrLatest (2025): $920 · +2.0% YoY. Source: county tax records.
Cash-flow waterfall
monthlySold comps — $/sqft
last 12 mo · ≤1 miLoading sold comps…