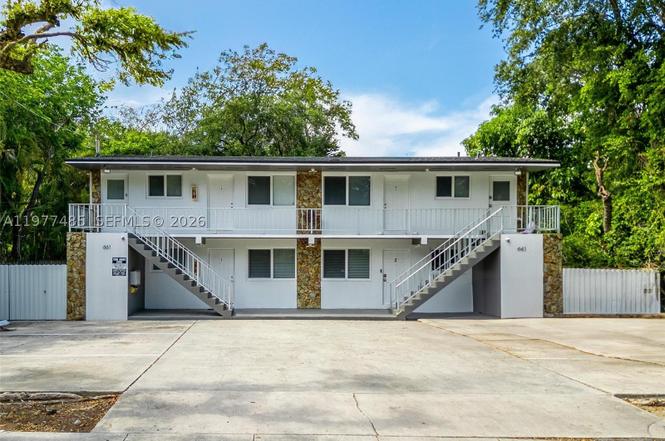
 Fourplex
661 NE 61st St · Miami, FL
Flood risk 5/10 · Moderate
- FEMA flood zone
- X (unshaded)
- Chance of flooding over 30 yrs
- 0.24%
- Est. flood insurance / yr
- $507 – $1,088
Fire risk 1/10 · Minimal
- Est. fire insurance / yr
- $947 – $1,759
Heat risk 10/10 · Severe
- Hot days now (above 102°F)
- 7 days/yr
- Hot days in 30 yrs
- 28 days/yr
Wind risk 10/10 · Severe
- Chance of severe wind over 30 yrs
- 99.0%
Air-quality risk 2/10 · Minimal
- Unhealthy air days now
- 1 days/yr
- Unhealthy air days in 30 yrs
- 1 days/yr
Risk factors via First Street. Map © Google.
Why this score? — see what drove the C grade
The composite is a weighted blend of 9 inputs, each scored 0–100. Each bar is that input's sub-score; the figure is the points it added to the 100-point composite (weight × sub-score).
- Cash flow +20.6/30.0
- ARV discount +7.5/15.0
- DSCR +6.6/10.0
- 1% rule +5.1/10.0
- Appreciation +5.1/10.0
- Schools +4.2/10.0
- Livability +3.9/5.0
- Rent growth +3.2/5.0
- Condition / age +2.5/5.0
$1,799,999
🖨 Deal sheet 📄 Offer letter ✓ Due diligence
Multi-family units
County records classify this as Multi-Family (2-4 Unit). Listing-text estimate: 4 units. confirmed
Listing remarks MLS
ENJOY FLORIDA LIKE A TOURIST, 15 MINUTES TO THE OCEAN AND DOWN TOWM MIAMI. MANY RESTAURANTS ALONG U. S. 1 THIS STREET DEAD ENDS AT THE BAY ONLY APPROX. 1000 FEET. LOCATED ADJOINING TO GATED BAYSIDE VILLAGE. THE OWNER IS OFFERING HIS 2 OTHER BUILDINGS LOCATED AT 676 AND 637 N. E. 61 STREET. BUY ALL THREE AND ASSURE YOUR-SELF OF A GREAT INVESTMENT FOR THE FUTURE
Key facts
- Near us-1
- Quiet setting
- Tenant-occupied
Tags
Property features AI
Finance
- Other: Taxes and tax year available but excluded per instructions
- Financial info: Four leased units generating rental income (listed rents: $2,300; $2,200; $2,250; $2,250)
- HOA & community: No HOA information provided
Exterior
- Parking: Total of 4 parking spaces (open parking)
- Security: No security features listed
- Utilities: Public water; Public sewer; Cable available; Trash collection included with rent; Sewer included with rent; Water included with rent
- Home design: 2-story building; Resale property; Composition roof; Block construction
- Construction: Block construction; Composition roof
- Exterior features: Less than quarter acre lot; Open parking
Interior
- Kitchen: Each unit includes a kitchen
- Bedrooms: Four 2-bedroom units (each unit is 2 bedrooms)
- Flooring: Tile
- Bathrooms: Each unit has 1 full bathroom
- Heating & cooling: Central heating; Central air
- Interior features: Tile flooring; Central air conditioning; Central heating
- Laundry & utility: Washer/dryer info not provided
Neighborhood map
What this means for you Summary
Snapshot
- This is a 4 × 2-bed/1.0-bath units multifamily listed at $1.80M.
Deal economics
- At list price, monthly cash flow is $2k ($29k/yr) — positive. Per door: $602/mo.
- The deal already cash-flows at list — no discount required.
- Meets the 1% rule at list price ($18k rent vs $1.80M).
- Recommended offer: $1.75M (3.0% below list) — sets the bar for market timing.
- Cap rate 7.9% vs local median 1.9% in Miami — top-decile yield for the area; either an underpriced asset or a hidden risk that comps aren't pricing in. Stress-test before assuming the spread holds.
Location & tenants
- Location reads 78/100 on livability (#177 in FL, #2,724 nationally) — a middle-class / working-renter tenant base. Strengths: amenities A+, commute A+, health & safety A+; Watch: employment C-, crime F, cost of living F.
- Miami-Dade (suburban): math 45% / reading 54% proficiency, ranked #40 of 73 in FL (top 55%) — families likely to look elsewhere, expect single-tenant / working-renter base with shorter leases; 64% free/reduced lunch — lower-income household profile, screen leases tightly.
- Market conditions: Rents rising (+2.7%/yr); 757 active listings in the ZIP; solid renter incomes; 10,051 units permitted in Miami-Dade County in 2024 (7,758 in 5+ unit buildings).
- At $18,180/mo this rent would consume 232% of the median local household income ($94k/yr) (locally 3106% of renters already pay >50% of income on rent) — very limited rent-growth headroom before tenants either downsize or default.
Forward outlook
- In year one you build about $17k of equity ($12k loan paydown + $5k appreciation (0.3% local appreciation)).
- Miami-Dade County population projected at +28% by 2050 — long-run rental-demand tailwind backs the buy-and-hold thesis.
- At projected returns (0.3% appreciation + 2.7% rent growth), your $504k cash investment doubles in ~8 years — after that, you're playing with house money.
- By year 6, paydown + projected appreciation supports a ~$113k cash-out refi (75% LTV) — recoverable capital for the next deal without selling this one.
Negotiation context
- It's been on market 57 days — a 3% lower offer ($1.75M) is reasonable based on typical stale-listing flexibility.
- 2 sale attempts since 10y ago with the ask held roughly flat each time — persistent listings suggest the price (not the market) is what's stuck; bring a comps-based counter.
- Current owner paid $625k; list at $1.80M implies a 188% gain — meaningful room to come down on a strong offer.
Risks & watch-outs
- Climate carrying-cost: moderate flood risk; severe wind risk, 99% chance of damaging wind over 30y; extreme-heat days projected 7→28/yr by 2055 (HVAC capex compounding) — expect insurance premiums to compound above CPI over the hold.
Questions for the listing agent
- It's been on market 57 days. Have you received any prior offers? Is the seller open to a 3% concession, seller financing, or rate buy-down credit?
- Can we see the unit-by-unit rent roll, current vacancy, and any below-market leases? What's the average tenancy length?
- What capital expenditures (roof, boiler, parking lot, exteriors) have been made in the last 5 years, and what's planned in the next 2?
- Built in 1972 — when were the roof, HVAC, electrical panel, plumbing, and water heater last replaced?
- Is there a deadline driving the sale (1031 exchange, divorce, estate, relocation)? That informs how much negotiation room exists.
- Schools are B-rated — typically a magnet for longer-tenancy family renters. What's the average tenant stay here, and is there a school-zone premium baked into asking?
- Crime grade is F in this area — have there been break-ins, vandalism, or insurance claims at this property in the last 3 years? What carrier currently insures it and at what premium?
- What's the average days-on-market for RENTAL listings here right now (not sales)? A rising rental-DOM trend means longer vacancies and softer asking-rent achievability than the comps imply.
- What's the recent tenant-quality profile in this submarket — average credit score on applications, eviction rate, late-payment / NSF rate, and stable-employment percentage? A property-management company in the area should have these aggregated.
- How much new apartment / multifamily construction is in the pipeline within 1–3 miles? Heavy new supply (>2% of stock underway) typically softens rents 12–24 months out; light construction supports rent growth.
Investment metrics
- 1% rule
- 1.01% ✓
- Cap rate
- 7.90%
- Cash-on-cash
- 5.73%
- DSCR
- 1.26
- GRM
- 8.3
CMA / ARV
No comps found within radius.
Projected returns pro-forma
0.27% appreciation · 2.73% rent growth · sell at horizon
- IRR
- 4.9%
- Equity multiple
- 1.24×
- Total profit
- $118,912
- Equity at exit
- $547,269
- IRR
- 9.7%
- Equity multiple
- 2.08×
- Total profit
- $543,435
- Equity at exit
- $677,812
Cash invested: $504,000 (down + closing). Projections, not guarantees.
Landlord ↔ Tenant lean methodology
- Overall (STATE)
- 87 Strongly Landlord-Friendly
- State Florida
- 87 Strongly Landlord-Friendly · R+3
- County
- — inherits STATE
- City
- — inherits STATE
ZIP-level market 33137
- Home prices YoY
- 0.1%
- Rents YoY
- 2.7%
- Active inventory
- 757
- Price-to-rent
- 33.0×
Monthly cashflow live
- Estimated rent
- $18,180 medium interval (Pro) →
- Mortgage (P&I)
- −$9,439
- Tax from tax record
- −$1,764 /mo · $21,173/yr
- Insurance
- −$750
- HOA
- −$0
- Vacancy / Maint / Mgmt
- −$3,818
- Net cashflow
- $2,408
Break-even live
4-unit breakdown (identical units grouped — click to expand)
| Units | Beds | Baths | Est. rent |
|---|---|---|---|
| 4× units | 2 | 1 | $18,180 |
| #1 | 2 | 1 | $4,545 |
| #2 | 2 | 1 | $4,545 |
| #3 | 2 | 1 | $4,545 |
| #4 | 2 | 1 | $4,545 |
| Total (4 units) | $18,180 | ||
UW: 25.0% down · 7.5% · 30yr · 1.5% tax · 5.0% vac · 8.0% maint · 8.0% mgmt
Financing live
Cash to close
- Down payment
- $450,000
- Closing costs
- $54,000
- Reserves months
- —
- Total cash needed
- —
Loan-product check · same deal, 3 products live
Conventional
25% down · 7.5% · 30yr
- Down + closing
- —
- Monthly P&I
- —
- Monthly cashflow
- —
- DSCR
- —
- Eligible?
- —
Personal DTI + credit; lowest rate.
DSCR
20% down · 8.5% · 30yr
- Down + closing
- —
- Monthly P&I
- —
- Monthly cashflow
- —
- DSCR
- —
- Eligible?
- —
No personal income docs; deal must DSCR.
Hard money
10% down · 12.0% · 12mo
- Down + closing
- —
- Monthly P&I
- —
- Monthly cashflow
- —
- DSCR
- —
- Eligible?
- —
Short-term bridge; refi at stabilization.
Listing history 8 events
-
2026-05-01status Pending
-
2026-03-05$1,799,999 Active
-
2016-06-15soldstatus $625,000
-
2016-06-10soldstatus $625,000 Sold 364-char remark
Show marketing remark (364 chars)
ENJOY FLORIDA LIKE A TOURIST, 15 MINUTES TO THE OCEAN AND DOWN TOWM MIAMI. MANY RESTAURANTS ALONG U. S. 1 THIS STREET DEAD ENDS AT THE BAY ONLY APPROX. 1000 FEET. LOCATED ADJOINING TO GATED BAYSIDE VILLAGE. THE OWNER IS OFFERING HIS 2 OTHER BUILDINGS LOCATED AT 676 AND 637 N. E. 61 STREET. BUY ALL THREE AND ASSURE YOUR-SELF OF A GREAT INVESTMENT FOR THE FUTURE
-
2016-05-06status Pending 364-char remark
Show marketing remark (364 chars)
ENJOY FLORIDA LIKE A TOURIST, 15 MINUTES TO THE OCEAN AND DOWN TOWM MIAMI. MANY RESTAURANTS ALONG U. S. 1 THIS STREET DEAD ENDS AT THE BAY ONLY APPROX. 1000 FEET. LOCATED ADJOINING TO GATED BAYSIDE VILLAGE. THE OWNER IS OFFERING HIS 2 OTHER BUILDINGS LOCATED AT 676 AND 637 N. E. 61 STREET. BUY ALL THREE AND ASSURE YOUR-SELF OF A GREAT INVESTMENT FOR THE FUTURE
-
2016-04-12$625,000 Active 364-char remark
Show marketing remark (364 chars)
ENJOY FLORIDA LIKE A TOURIST, 15 MINUTES TO THE OCEAN AND DOWN TOWM MIAMI. MANY RESTAURANTS ALONG U. S. 1 THIS STREET DEAD ENDS AT THE BAY ONLY APPROX. 1000 FEET. LOCATED ADJOINING TO GATED BAYSIDE VILLAGE. THE OWNER IS OFFERING HIS 2 OTHER BUILDINGS LOCATED AT 676 AND 637 N. E. 61 STREET. BUY ALL THREE AND ASSURE YOUR-SELF OF A GREAT INVESTMENT FOR THE FUTURE
-
1993-04-01soldstatus $54,500
-
1977-03-01soldstatus $72,000
ⓘ Source: listings_history table (triggers on properties + properties_extension) + one-shot
backfill from property_details.listing_events for pre-trigger history.
Tax reassessment forecast FL · Resets to sale price
- Current annual tax
- $21,173 · $1,764/mo
- Projected year-2 tax
- $21,173 · $1,764/mo
- Expected delta
- $0/yr ($0/mo · 0.0%)
ⓘ Screening estimate from a state-policy table — verify with the county assessor before closing.
Climate risk First Street
- Flood 5/10 Major FEMA zone X (unshaded) · 24% chance over 30 yrs
- Wildfire 1/10 Low
- Heat 10/10 Extreme 7 d/yr ≥102°F today · 28 d/yr by 30 yrs out
- Wind 10/10 Extreme 99% chance of damaging wind over 30 yrs
- Air quality 2/10 Low 1 unhealthy d/yr today · 1 by 30 yrs out
Nearby sold comps map
Loading sold comps map…
Walkable amenities ~0.75 mi
Loading nearby amenities…
Taxation est. · year 1
- Rental income
- $218,160
- − Mortgage interest
- −$100,828
- − Property taxes
- −$21,173
- − Insurance
- −$9,000
- − Repairs & maintenance
- −$17,453
- − Management
- −$17,453
- − Depreciation
- −$52,364
- Taxable loss
- −$111
- Est. tax savings @ 24.0%
- +$27
- After-tax cash flow
- $28,927/yr
For passive investors: Depreciation is non-cash, so a rental often shows a tax loss while cash-flowing — sheltering income. Rental losses are passive: they offset passive income freely, and up to $25,000/yr can offset ordinary (W-2) income if you actively participate and your MAGI is under $100k (phasing out to $0 by $150k); unused losses carry forward. On sale, claimed depreciation is recaptured at up to 25%, and gains may owe capital-gains tax (a 1031 exchange can defer both). Figures are a year-1 estimate at your 24.0% rate — not tax advice; consult a CPA.
Schools (NCES district)
- District
- Miami-Dade
- NCES district ID
- 1200390
- Math proficiency
- 45% ▼ -16.00%
- Reading proficiency
- 54% ▼ -5.00%
- Median HH income
- $43,928
- Composite
- 41.76/100
- National rank
- #3397
- State rank
- #40 of 73 in FL
Livability — Miami
- Score
- 78/100
- State rank
- #177
- US rank
- #2724
Category grades
Schools grade is shown separately in the Schools card above.
Census & demographics
- Census place
- Miami, FL
- County
- Miami-Dade County · 2,697,751 people
- City population
- 827,308
- Metro
- Miami-Fort Lauderdale-Pompano Beach, FL
- Population (ZIP)
- 29,414
- Household income
- $94,036
- Rent vs Own
- Severe rent burden
- 3106.0
Population outlook (Miami-Dade County) Hauer SSP2
- Today (2025)
- 3,126,439 people
- By 2030
- 3,325,765 · +6.4%
- By 2040
- 3,697,561 · +18.3%
- By 2050
- 4,012,134 · +28.3%
- By 2075
- 4,605,612 · +47.3%
- By 2100
- 4,866,598 · +55.7%
Race, ethnicity, and origin ACS 2023
- Neighborhood character
- Diverse neighborhood (Simpson 0.63)
- Race & ethnicity
- Hispanic / Latino 54% Two or more races 25% White 24% Black 16% Asian 2%
- Hispanic origin (detail)
- Mexican 1% Puerto Rican 5% Cuban 10% Dominican 3% Salvadoran 3%
- Common ancestry
- Hispanic 8% Estonian 2% Lithuanian 2%
- Foreign-born
- 47% · Canada, Jamaica, Dominican Republic
- Languages at home
- 34% English-only · Spanish 49% French/Haitian/Cajun 8% Other Indo-European 5%
Political lean MEDSL · Miami-Dade
- 2024 margin
- R (+11.4) · D 43.9% · R 55.4%
- 2008→2024 swing
- -27.6pp toward R · 2008: 16.1pp · 2024: -11.4pp
- All cycles
- 2024: R+11.4 2020: D+7.3 2016: D+29.6 2012: D+23.7 2008: D+16.1
Not yet ingested
- Civics
- —
Market trends
- HPI YoY
- ▲ 0.27%
- Current HPI
- 385.1514
- Rent YoY
- ▲ 2.73%
- Metro
- Miami-Fort Lauderdale-Pompano Beach, FL
- State GDP YoY
- ▲ 3.28%
- F500 in state
- 36
Industry mix (Fortune 500 HQ in FL)
| Industry | F500 HQs | Revenue |
|---|---|---|
| Industrial Technology | 2 | $29B |
|
||
| Insurance | 2 | $17B |
|
||
| Retail | 1 | $60B |
|
||
| Technology Distribution | 1 | $58B |
|
||
| Homebuilding | 1 | $35B |
|
||
| Technology Manufacturing | 1 | $35B |
|
||
Price history
+2400.0% since first listed8 events — show timeline
- 2026-05-01 Pending — MARMLS
- 2026-03-05 Listed $1,799,999 MARMLS
- 2016-06-15 Sold (Public Records) $625,000 Public Records
- 2016-06-10 Sold (MLS) $625,000 MARMLS
- 2016-05-06 Pending — MARMLS
- 2016-04-12 Listed $625,000 MARMLS
- 1993-04-01 Sold (Public Records) $54,500 Public Records
- 1977-03-01 Sold (Public Records) $72,000 Public Records
Property tax history
+9.4%/yrLatest (2025): $21,173 · -4.0% YoY. Source: county tax records.
Cash-flow waterfall
monthlySold comps — $/sqft
last 12 mo · ≤1 miLoading sold comps…