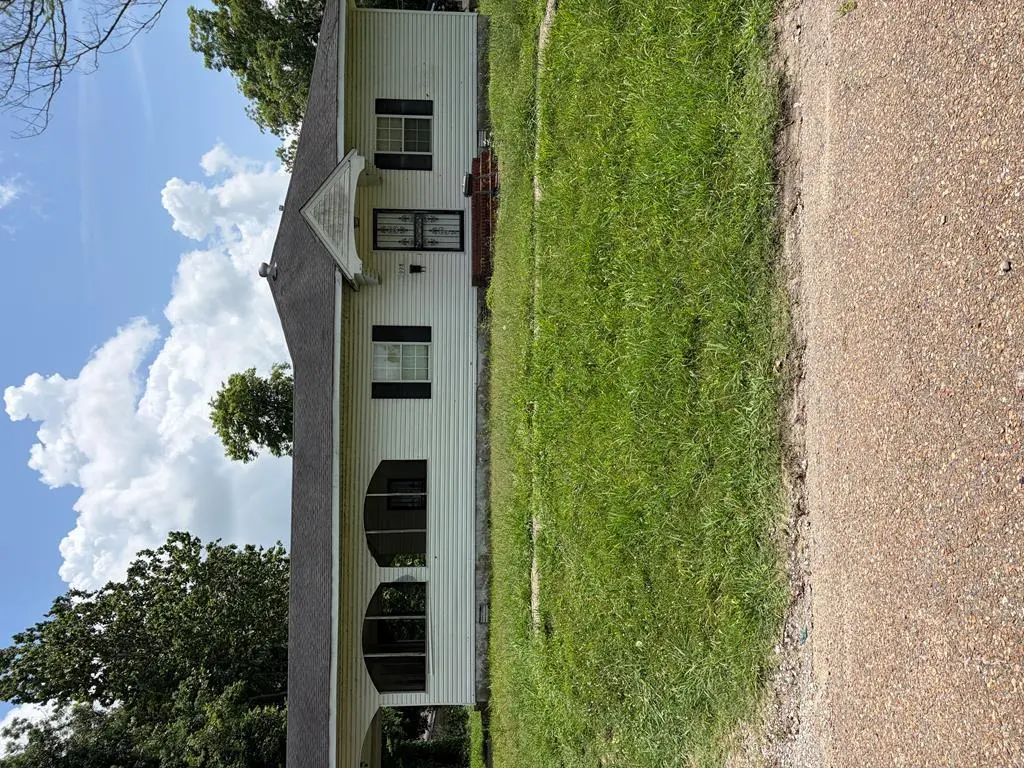
928 Fourth St · Earle, AR
Flood risk No data
- FEMA flood zone
- —
- Chance of flooding over 30 yrs
- —
- Est. flood insurance / yr
- —
Fire risk No data
- Est. fire insurance / yr
- —
Heat risk No data
- Hot days now (above threshold)
- —
- Hot days in 30 yrs
- —
Wind risk No data
- Chance of severe wind over 30 yrs
- —
Air-quality risk No data
- Unhealthy air days now
- —
- Unhealthy air days in 30 yrs
- —
Risk factors via First Street. Map © Google.
Why this score? — see what drove the A- grade
The composite is a weighted blend of 9 inputs, each scored 0–100. Each bar is that input's sub-score; the figure is the points it added to the 100-point composite (weight × sub-score).
- Cash flow +30.0/30.0
- ARV discount +14.8/15.0
- 1% rule +10.0/10.0
- DSCR +10.0/10.0
- Appreciation +6.9/10.0
- Livability +3.0/5.0
- Rent growth +2.5/5.0
- Condition / age +2.5/5.0
- Schools +0.5/10.0
$60,000
🖨 Deal sheet 📄 Offer letter ✓ Due diligence
Listing remarks
This home has been used for a rental property for several years. Owner has been getting between $850- $900 a month for rent. The house has 4 bedrooms and 2 full baths with a LARGE screened-in porch. The property is needing some work.
Key facts
- Screened-in porch
- 7,405 sq ft lot
- Built 1932
Tags
Property features AI
Finance
- Other: Lot approximately 7,405 sq ft (50 x 150)
- Financial info: Financial details not provided
- HOA & community: HOA information not provided
Exterior
- Parking: Attached carport
- Security: Security information not provided
- Utilities: Public water; Public sewer; Natural gas available
- Home design: Residential property; One story
- Construction: Frame construction
- Exterior features: No notable exterior features listed; Composition roof
Interior
- Kitchen: Electric range; Electric oven; Gas water heater
- Bedrooms: Bedrooms information not provided
- Flooring: Carpet; Hardwood
- Bathrooms: 2 full bathrooms
- Heating & cooling: Central heating (natural gas); Central air conditioning; Ceiling fans for cooling; Wall/window AC unit(s)
- Interior features: Ceiling fans; Blinds and window coverings
- Laundry & utility: Laundry information not provided
Neighborhood map
What this means for you Summary
Snapshot
- This is a 4-bed/1.0-bath single-family listed at $60k.
Deal economics
- At list price, monthly cash flow is $671 ($8k/yr) — positive.
- The deal already cash-flows at list — no discount required.
- Meets the 1% rule at list price ($1k rent vs $60k).
Location & tenants
- Location reads 60/100 on livability (#275 in AR) — a middle-class / working-renter tenant base. Strengths: cost of living A+, health & safety A, housing B+; Watch: crime F, amenities F, commute F.
- Earle School District (rural): math 5% / reading 8% proficiency, ranked #237 of 238 in AR (top 100%) — low school quality limits family demand, transient renter base, plan for 1-2y turnover; 93% free/reduced lunch — lower-income household profile, screen leases tightly.
- Zoned schools: Earle Elementary School (math 8% / reading 12%, grade F, #429 of 454 statewide, top 96%, 231 students, 100% FRL); Earle High School (math 2% / reading 8%, grade F, #287 of 292 statewide, top 100%, 204 students, 100% FRL).
- Market conditions: 11 active listings in the ZIP; 69 units permitted in Crittenden County in 2024 (0 in 5+ unit buildings).
Forward outlook
- In year one you build about $3k of equity ($415 loan paydown + $2k appreciation (3.9% local appreciation)).
- Crittenden County population projected at -26% by 2050 — secular population decline; favor cash flow + early exit over multi-decade hold.
- At projected returns (3.9% appreciation + 3.0% rent growth), your $17k cash investment doubles in ~2 years — after that, you're playing with house money.
Negotiation context
- Only 9 days on market — expect competitive offers; lowballing is unlikely to land.
- 2 sale attempts with the ask held roughly flat each time — persistent listings suggest the price (not the market) is what's stuck; bring a comps-based counter.
- Current owner paid $24k; list at $60k implies a 150% gain — meaningful room to come down on a strong offer.
Risks & watch-outs
- Watch-outs: built in 1932 — expect roof / HVAC / electrical / plumbing capex.
Questions for the listing agent
- Built in 1932 — when were the roof, HVAC, electrical panel, plumbing, and water heater last replaced?
- Is there a deadline driving the sale (1031 exchange, divorce, estate, relocation)? That informs how much negotiation room exists.
- Schools are F-rated, which usually means shorter tenancies and higher turnover. Who's the typical renter profile here, and what's been the actual vacancy rate?
- Crime grade is F in this area — have there been break-ins, vandalism, or insurance claims at this property in the last 3 years? What carrier currently insures it and at what premium?
- What's the average days-on-market for RENTAL listings here right now (not sales)? A rising rental-DOM trend means longer vacancies and softer asking-rent achievability than the comps imply.
- What's the recent tenant-quality profile in this submarket — average credit score on applications, eviction rate, late-payment / NSF rate, and stable-employment percentage? A property-management company in the area should have these aggregated.
- How much new for-sale + rental construction is in the pipeline within 1–3 miles? Heavy new supply typically softens prices + rents 12–24 months out; constrained supply supports both.
Investment metrics
- 1% rule
- 2.25% ✓
- Cap rate
- 19.71%
- Cash-on-cash
- 47.92%
- DSCR
- 3.13
- GRM
- 3.7
CMA / ARV
- ARV (on-the-fly)
- $71,560
- Comps found
- 3
Show comp detail 3 sales within ~0.75 mi
| Address | Dist | Beds/Ba | Sqft | Sold | Price | $/sf | Match |
|---|---|---|---|---|---|---|---|
| 718 2nd St | 0.23mi | 3/2.0 (-1) | 1,761 (-2%) | 14mo | $13,500 | $8 | 66 |
| 801 Barton St | 0.28mi | 3/1.0 (-1) | 1,870 (+4%) | 20mo | $75,000 | $40 | 57 |
| 728 Arkansas St | 0.50mi | 4/2.0 | 1,600 (-11%) | 8mo | $198,000 | $124 | 48 |
Match score weights: distance 35% · size 25% · config 20% · recency 20%. Top-matched comps best support the ARV.
Projected returns pro-forma
3.89% appreciation · 3.0% rent growth · sell at horizon
- IRR
- 54.3%
- Equity multiple
- 4.15×
- Total profit
- $52,841
- Equity at exit
- $30,034
- IRR
- 53.0%
- Equity multiple
- 8.43×
- Total profit
- $124,825
- Equity at exit
- $48,817
Cash invested: $16,800 (down + closing). Projections, not guarantees.
Landlord ↔ Tenant lean methodology
- Overall (STATE)
- 92 Strongly Landlord-Friendly
- State Arkansas
- 92 Strongly Landlord-Friendly · R+14
- County
- — inherits STATE
- City
- — inherits STATE
ZIP-level market 72331
- Home prices YoY
- 2.7%
- Active inventory
- 11
- Price-to-rent
- 3.7×
Monthly cashflow live
- Estimated rent
- $1,351 medium interval (Pro) →
- Mortgage (P&I)
- −$315
- Tax from tax record
- −$57 /mo · $682/yr
- Insurance
- −$25
- HOA
- −$0
- Vacancy / Maint / Mgmt
- −$284
- Net cashflow
- $671
Break-even live
UW: 25.0% down · 7.5% · 30yr · 1.5% tax · 5.0% vac · 8.0% maint · 8.0% mgmt
Financing live
Cash to close
- Down payment
- $15,000
- Closing costs
- $1,800
- Reserves months
- —
- Total cash needed
- —
Loan-product check · same deal, 3 products live
Conventional
25% down · 7.5% · 30yr
- Down + closing
- —
- Monthly P&I
- —
- Monthly cashflow
- —
- DSCR
- —
- Eligible?
- —
Personal DTI + credit; lowest rate.
DSCR
20% down · 8.5% · 30yr
- Down + closing
- —
- Monthly P&I
- —
- Monthly cashflow
- —
- DSCR
- —
- Eligible?
- —
No personal income docs; deal must DSCR.
Hard money
10% down · 12.0% · 12mo
- Down + closing
- —
- Monthly P&I
- —
- Monthly cashflow
- —
- DSCR
- —
- Eligible?
- —
Short-term bridge; refi at stabilization.
Listing history 8 events
-
2026-06-19days on market $60,000 Active 9 DOM
-
2026-06-18days on market $60,000 Active 8 DOM
-
2026-06-17days on market $60,000 Active 7 DOM
-
2026-06-16days on market $60,000 Active 6 DOM
-
2026-06-15days on market $60,000 Active 5 DOM
-
2026-06-14days on market $60,000 Active 3 DOM
-
2026-06-12remarks 233-char remark
-
2026-06-12$60,000 Active 2 DOM
ⓘ Source: listings_history table (triggers on properties + properties_extension) + one-shot
backfill from property_details.listing_events for pre-trigger history.
Tax reassessment forecast AR · Resets to sale price
- Current annual tax
- $682 · $57/mo
- Projected year-2 tax
- $682 · $57/mo
- Expected delta
- $0/yr ($0/mo · 0.0%)
ⓘ Screening estimate from a state-policy table — verify with the county assessor before closing.
Nearby sold comps map
Loading sold comps map…
Walkable amenities ~0.75 mi
Loading nearby amenities…
Taxation est. · year 1
- Rental income
- $16,214
- − Mortgage interest
- −$3,361
- − Property taxes
- −$682
- − Insurance
- −$300
- − Repairs & maintenance
- −$1,297
- − Management
- −$1,297
- − Depreciation
- −$1,745
- Taxable income
- $7,531
- Est. tax owed @ 24.0%
- −$1,807
- After-tax cash flow
- $6,244/yr
For passive investors: Depreciation is non-cash, so a rental often shows a tax loss while cash-flowing — sheltering income. Rental losses are passive: they offset passive income freely, and up to $25,000/yr can offset ordinary (W-2) income if you actively participate and your MAGI is under $100k (phasing out to $0 by $150k); unused losses carry forward. On sale, claimed depreciation is recaptured at up to 25%, and gains may owe capital-gains tax (a 1031 exchange can defer both). Figures are a year-1 estimate at your 24.0% rate — not tax advice; consult a CPA.
Schools (NCES district)
- District
- Earle School District
- NCES district ID
- 0505550
- Math proficiency
- 5% ▼ -10.00%
- Reading proficiency
- 8% ▼ -8.00%
- Median HH income
- $30,778
- Composite
- 4.87/100
- National rank
- #10041
- State rank
- #237 of 238 in AR
Livability — Earle
- Score
- 60/100
- State rank
- #275
- US rank
- #19557
Category grades
Schools grade is shown separately in the Schools card above.
Census & demographics
- Census place
- Earle, AR
- City population
- 2,102
- Population (ZIP)
- 2,102
Population outlook (Crittenden County) Hauer SSP2
- Today (2025)
- 45,254 people
- By 2030
- 42,953 · -5.1%
- By 2040
- 38,235 · -15.5%
- By 2050
- 33,670 · -25.6%
- By 2075
- 24,315 · -46.3%
- By 2100
- 17,173 · -62.1%
Race, ethnicity, and origin ACS 2023
- Neighborhood character
- Diverse neighborhood (Simpson 0.61)
- Race & ethnicity
- Black 58% White 24% Two or more races 18%
- Common ancestry
- Iranian 3% Romanian 2% Lithuanian 1%
Political lean MEDSL · Crittenden
- 2024 margin
- Toss-up / Even · D 50.1% · R 47.9% · Other 2.0%
- 2008→2024 swing
- -12.4pp toward R · 2008: 14.7pp · 2024: 2.3pp
- All cycles
- 2024: D+2.3 2020: D+7.2 2016: D+9.0 2012: D+18.7 2008: D+14.7
Not yet ingested
- Civics
- —
Market trends
- HPI YoY
- ▲ 3.89%
- Current HPI
- 149.2146
- Rent YoY
- —
- Metro
- —
- State GDP YoY
- ▲ 3.80%
- F500 in state
- 10
Industry mix (Fortune 500 HQ in AR)
| Industry | F500 HQs | Revenue |
|---|---|---|
| Retail | 1 | $681B |
|
||
| Food / Agriculture | 1 | $53B |
|
||
| Retail / Energy | 1 | $22B |
|
||
| Transportation / Logistics | 1 | $12B |
|
||
| Energy | 1 | $4B |
|
||
Price history
+150.0% since first listed4 events — show timeline
- 2026-06-11 Listed $60,000 EARA
- 2025-05-07 Price Changed $59,900 EARA
- 2025-01-28 Listed $65,000 EARA
- 1996-12-01 Sold (Public Records) $24,000 Public Records
Property tax history
+3.5%/yrLatest (2025): $682 · +9.9% YoY. Source: county tax records.
Cash-flow waterfall
monthlySold comps — $/sqft
last 12 mo · ≤1 miLoading sold comps…