 8-Plex
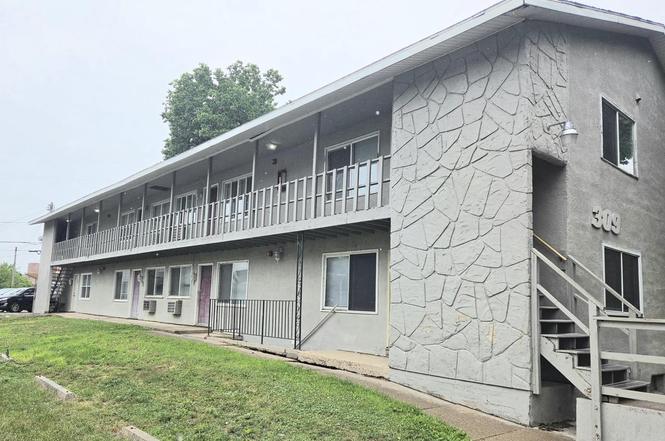
309 9th Street St N · La Crosse, WI
Flood risk 1/10 · Minimal
- FEMA flood zone
- X (unshaded)
- Chance of flooding over 30 yrs
- 0.0%
- Est. flood insurance / yr
- $507 – $1,088
Fire risk 1/10 · Minimal
- Est. fire insurance / yr
- $636 – $1,182
Heat risk 3/10 · Minor
- Hot days now (above 101°F)
- 7 days/yr
- Hot days in 30 yrs
- 14 days/yr
Wind risk 2/10 · Minimal
- Chance of severe wind over 30 yrs
- —
Air-quality risk 1/10 · Minimal
- Unhealthy air days now
- 0 days/yr
- Unhealthy air days in 30 yrs
- 0 days/yr
Risk factors via First Street. Map © Google.
Why this score? — see what drove the D grade
The composite is a weighted blend of 9 inputs, each scored 0–100. Each bar is that input's sub-score; the figure is the points it added to the 100-point composite (weight × sub-score).
- Cash flow +13.7/30.0
- ARV discount +7.5/15.0
- DSCR +4.1/10.0
- 1% rule +3.5/10.0
- Livability +3.5/5.0
- Rent growth +3.2/5.0
- Schools +2.7/10.0
- Condition / age +2.5/5.0
- Appreciation +0.0/10.0
$1,200,000
🖨 Deal sheet (PDF) 📄 Offer letter ✓ Due diligence
Multi-family units
County records classify this as Multi-Family (5+ Unit). Listing-text estimate: 8 units. confirmed
5+ unit building — per-unit beds/baths from public records are typically unavailable; the breakdown below (if shown) is an estimate from the listing text.
Listing remarks MLS
Centrally located remodeled college 8 unit. Close to UWL and WTC.
Key facts
- Downtown location
- Upgraded kitchens
- Upgraded bathrooms
Tags
Property features AI
Finance
- Other: Tenant personal property excluded from sale
- Financial info: 8 total units in the building
Exterior
- Parking: Outdoor parking; On-site parking; Outside parking spaces
- Utilities: Municipal water; Municipal sewer
- Home design: Multi-family property; Apartment building; 1–2 stories; Zoned commercial
- Construction: Construction year: Other — see remarks
- Exterior features: Stucco/Slate exterior; Less than 1/2 acre lot
Interior
- Heating & cooling: Wall/sleeve air units; Electric heating
- Interior features: Full basement; Any existing appliances included
- Laundry & utility: Seller-owned water heater
Neighborhood map
What this means for you Summary
Snapshot
- This is a 8 × 2-bed/1.0-bath units multifamily listed at $1.20M.
Deal economics
- At list price, monthly cash flow is $77 ($930/yr) — positive. Per door: $10/mo.
- The deal already cash-flows at list — no discount required.
- To meet the 1% rule (rent ≥ 1% of price), the offer needs to be $1.02M (15.4% below list).
- Recommended offer: $1.02M (15.4% below list) — sets the bar for 1% rule.
- Cap rate 6.4% vs local median 3.1% in La Crosse — top-decile yield for the area; either an underpriced asset or a hidden risk that comps aren't pricing in. Stress-test before assuming the spread holds.
Location & tenants
- Location reads 69/100 on livability (#339 in WI) — a middle-class / working-renter tenant base. Strengths: cost of living A+, housing A+; Watch: employment C-, health & safety D, crime F.
- La Crosse School District (urban): math 29% / reading 34% proficiency, ranked #267 of 342 in WI (top 78%) — families likely to look elsewhere, expect single-tenant / working-renter base with shorter leases.
- Zoned schools: Emerson Elementary (math 42% / reading 37%, grade F, #490 of 1,041 statewide, top 53%, 311 students, 31% FRL); Lincoln Middle (math 34% / reading 41%, grade F, #172 of 383 statewide, top 45%, 277 students, 41% FRL); Logan High (math 17% / reading 27%, grade F, #349 of 483 statewide, top 75%, 754 students, 47% FRL) — zoned schools at 40% FRL track the district average.
- Market conditions: Rents rising (+2.7%/yr); 224 active listings in the ZIP; 20 comparable units currently listed for rent nearby; rentals lingering (median 46d on market — plan ~5-8 weeks vacancy on turnover, expect pricing pressure); 100% of comp listings sitting > 30 days — soft ceiling on asking rent; 268 units permitted in La Crosse County in 2024 (10 in 5+ unit buildings).
- At $10,156/mo this rent would consume 198% of the median local household income ($62k/yr) (locally 2352% of renters already pay >50% of income on rent) — very limited rent-growth headroom before tenants either downsize or default.
Forward outlook
- Local home prices are declining (-3.0%/yr); year-one equity from $8k of loan paydown is wiped out by about $36k of value loss. Plan a longer hold.
- La Crosse County population projected at +14% by 2050 — modest demand growth; plan on rents tracking national, not racing it.
Negotiation context
- Only 11 days on market — expect competitive offers; lowballing is unlikely to land.
- 2 sale attempts since 5y ago with the ask held roughly flat each time — persistent listings suggest the price (not the market) is what's stuck; bring a comps-based counter.
- Current owner paid $975k; 23% above their basis — modest negotiation headroom, anchor on the comps not their cost.
Questions for the listing agent
- Can we see the unit-by-unit rent roll, current vacancy, and any below-market leases? What's the average tenancy length?
- What capital expenditures (roof, boiler, parking lot, exteriors) have been made in the last 5 years, and what's planned in the next 2?
- Is there a deadline driving the sale (1031 exchange, divorce, estate, relocation)? That informs how much negotiation room exists.
- Schools are D-rated, which usually means shorter tenancies and higher turnover. Who's the typical renter profile here, and what's been the actual vacancy rate?
- Crime grade is F in this area — have there been break-ins, vandalism, or insurance claims at this property in the last 3 years? What carrier currently insures it and at what premium?
- The area grade is low — what's the realistic commute time and amenity access for the typical tenant pool here? Any planned neighborhood developments (good or bad) we should know about?
- What's the average days-on-market for RENTAL listings here right now (not sales)? A rising rental-DOM trend means longer vacancies and softer asking-rent achievability than the comps imply.
- What's the recent tenant-quality profile in this submarket — average credit score on applications, eviction rate, late-payment / NSF rate, and stable-employment percentage? A property-management company in the area should have these aggregated.
- How much new apartment / multifamily construction is in the pipeline within 1–3 miles? Heavy new supply (>2% of stock underway) typically softens rents 12–24 months out; light construction supports rent growth.
Investment metrics
- 1% rule
- 0.85% ✗
- Cap rate
- 6.37%
- Cash-on-cash
- 0.28%
- DSCR
- 1.01
- GRM
- 9.8
CMA / ARV
No comps found within radius.
Show comp detail 12 sales within ~0.75 mi
| Address | Dist | Beds/Ba | Sqft | Sold | Price | $/sf | Match |
|---|---|---|---|---|---|---|---|
| 901 Vine St | 0.03mi | —/— | 2,104 | 6mo | $196,180 | $93 | 82 |
| 1301 State St | 0.36mi | —/— | — | 0mo | $3,400,000 | — | 71 |
| 627 10th Street North St | 0.29mi | —/— | — | 9mo | $1,450,000 | — | 67 |
| 614 King St | 0.35mi | —/— | — | 7mo | $2,000,000 | — | 65 |
| 328 8th Street St S | 0.44mi | —/— | — | 4mo | $460,000 | — | 64 |
| 810-812 Cameron Ave | 0.46mi | 6/2.0 | — | 3mo | $280,000 | — | 63 |
| 903-907 Zeisler St | 0.39mi | —/— | 3,118 | 8mo | $430,000 | $138 | 63 |
| 417-419 8th Street St S | 0.49mi | 6/2.0 | 1,928 | 3mo | $294,500 | $153 | 62 |
| 1414 Pine St | 0.46mi | —/— | 34,171 | 10mo | $4,399,984 | $129 | 58 |
| 708 Ferry St #710 | 0.61mi | 6/2.0 | 2,359 | 3mo | $260,000 | $110 | 57 |
| 726 Ferry St | 0.61mi | 7/2.0 | 2,250 | 4mo | $240,000 | $107 | 56 |
| 706 6th Street South St #708 | 0.72mi | 6/2.0 | 3,301 | 10mo | $217,000 | $66 | 45 |
Match score weights: distance 35% · size 25% · config 20% · recency 20%. Top-matched comps best support the ARV.
Projected returns pro-forma
-3.0% appreciation · 2.72% rent growth · sell at horizon
- IRR
- -16.2%
- Equity multiple
- 0.43×
- Total profit
- $-192,432
- Equity at exit
- $178,924
- IRR
- -8.3%
- Equity multiple
- 0.48×
- Total profit
- $-173,100
- Equity at exit
- $103,754
Cash invested: $336,000 (down + closing). Projections, not guarantees.
Landlord ↔ Tenant lean methodology
- Overall (STATE)
- 73 Landlord-Friendly
- State Wisconsin
- 73 Landlord-Friendly · R+2
- County
- — inherits STATE
- City
- — inherits STATE
ZIP-level market 54601
- Rents YoY
- 2.7%
- Active inventory
- 224
- Price-to-rent
- 78.8×
Monthly cashflow live
- Estimated rent
- $10,156 high interval (Pro) →
- Mortgage (P&I)
- −$6,293
- Tax from tax record
- −$1,153 /mo · $13,834/yr
- Insurance
- −$500
- HOA
- −$0
- Vacancy / Maint / Mgmt
- −$2,133
- Net cashflow
- $77
Break-even live
Sensitivity live
| Price | -10% $757 | -5% $417 | +0% $77 | +5% $-262 | +10% $-602 |
|---|---|---|---|---|---|
| Rent | -10% $-725 | -5% $-324 | +0% $77 | +5% $479 | +10% $880 |
| Rate | -1.0pp $682 | -0.5pp $383 | base $77 | +0.5pp $-233 | +1.0pp $-550 |
8-unit breakdown (identical units grouped — click to expand)
| Units | Beds | Baths | Est. rent |
|---|---|---|---|
| 8× units | 2 | 1 | $10,152 |
| #1 | 2 | 1 | $1,269 |
| #2 | 2 | 1 | $1,269 |
| #3 | 2 | 1 | $1,269 |
| #4 | 2 | 1 | $1,269 |
| #5 | 2 | 1 | $1,269 |
| #6 | 2 | 1 | $1,269 |
| #7 | 2 | 1 | $1,269 |
| #8 | 2 | 1 | $1,269 |
| Total (8 units) | $10,156 | ||
UW: 25.0% down · 7.5% · 30yr · 1.5% tax · 5.0% vac · 8.0% maint · 8.0% mgmt
Financing live
Cash to close
- Down payment
- $300,000
- Closing costs
- $36,000
- Reserves months
- —
- Total cash needed
- —
Loan-product check · same deal, 3 products live
Conventional
25% down · 7.5% · 30yr
- Down + closing
- —
- Monthly P&I
- —
- Monthly cashflow
- —
- DSCR
- —
- Eligible?
- —
Personal DTI + credit; lowest rate.
DSCR
20% down · 8.5% · 30yr
- Down + closing
- —
- Monthly P&I
- —
- Monthly cashflow
- —
- DSCR
- —
- Eligible?
- —
No personal income docs; deal must DSCR.
Hard money
10% down · 12.0% · 12mo
- Down + closing
- —
- Monthly P&I
- —
- Monthly cashflow
- —
- DSCR
- —
- Eligible?
- —
Short-term bridge; refi at stabilization.
Rent comps 20 comps
| Address | Beds | Baths | Sqft | Rent | $/sqft | DOM | Units | Dist |
|---|---|---|---|---|---|---|---|---|
| 514 10th St N Unit 5 La Crosse, WI | 1.0 | 1.0 | 450 | $1,050 | $2.33 | 45d | 1 | 0.20mi |
| 1130 Vine St La Crosse, WI | 1.0 | 1.0 | 445 | $832 | $1.87 | 45d | 1 | 0.22mi |
| 816 Cass St Apt 103 La Crosse, WI | 1.0 | 1.0 | 538 | $895 | $1.66 | 45d | 1 | 0.39mi |
| 312 6th St S Unit 318 La Crosse, WI | 3.0 | 2.0 | — | $1,310 | — | 45d | 1 | 0.47mi |
| 520 7th St S Unit 5 La Crosse, WI | 3.0 | 1.0 | — | $1,195 | — | 45d | 1 | 0.58mi |
| 616 9th St S #1 La Crosse, WI | 2.0 | 1.0 | 1000 | $1,100 | $1.10 | 45d | 1 | 0.61mi |
| 27 Riverpoint Ct La Crosse, WI | 1.0 | 1.0 | 692 | $1,488 | $2.15 | 45d | 21 | 0.65mi |
| 1707 Main St La Crosse, WI | 3.0 | 1.0 | — | $1,690 | — | 45d | 1 | 0.69mi |
| 1001 Johnson St Unit 1001 La Crosse, WI | 2.0 | 1.0 | — | $1,250 | — | 45d | 1 | 0.93mi |
| 55 River Bend Rd Unit 509 La Crosse, WI | 1.0 | 1.0 | 736 | $1,525 | $2.07 | 45d | 1 | 0.94mi |
| 55 River Bend Rd Unit 304 La Crosse, WI | 1.0 | 1.0 | 1017 | $2,100 | $2.06 | 45d | 1 | 0.94mi |
| 55 River Bend Rd Unit 610 La Crosse, WI | 1.0 | 1.0 | 803 | $1,700 | $2.12 | 45d | 1 | 0.94mi |
| 55 River Bend Rd Apt 302 La Crosse, WI | 3.0 | 2.0 | 1246 | $2,950 | $2.37 | 45d | 1 | 0.94mi |
| 55 River Bend Rd Apt 608 La Crosse, WI | 3.0 | 2.0 | 1183 | $2,850 | $2.41 | 45d | 1 | 0.94mi |
| 220 Copeland Ave Unit 220 La Crosse, WI | 3.0 | 1.0 | — | $1,450 | — | 45d | 1 | 1.11mi |
| 1418 10th St S La Crosse, WI | 3.0 | 1.0 | — | $1,200 | — | 45d | 1 | 1.16mi |
| 919 Gould St Unit 15 La Crosse, WI | 1.0 | 1.0 | 500 | $850 | $1.70 | 45d | 1 | 1.21mi |
| 418 Rose St Unit 418 La Crosse, WI | 1.0 | 1.0 | — | $795 | — | 45d | 1 | 1.26mi |
| 418 Rose St Unit 422 La Crosse, WI | 2.0 | 1.0 | — | $920 | — | 45d | 1 | 1.26mi |
| 1442 Redfield St La Crosse, WI | 3.0 | 1.0 | 1000 | $1,100 | $1.10 | 45d | 1 | 1.41mi |
Listing history 9 events
-
2026-06-22days on market $1,200,000 Active 11 DOM
-
2026-06-19days on market $1,200,000 Active 9 DOM
-
2026-06-18days on market $1,200,000 Active 8 DOM
-
2026-06-17days on market $1,200,000 Active 7 DOM
-
2026-06-16days on market $1,200,000 Active 6 DOM
-
2026-06-15days on market $1,200,000 Active 5 DOM
-
2026-06-14days on market $1,200,000 Active 3 DOM
-
2026-06-13remarks 227-char remark
-
2026-06-13$1,200,000 Active 2 DOM
ⓘ Source: listings_history table (triggers on properties + properties_extension) + one-shot
backfill from property_details.listing_events for pre-trigger history.
Tax reassessment forecast WI · Partial reset (capped growth)
- Current annual tax
- $13,834 · $1,153/mo
- Projected year-2 tax
- $18,017 · $1,501/mo
- Expected delta
- +$4,183/yr (+$349/mo · 30.2%)
ⓘ Screening estimate from a state-policy table — verify with the county assessor before closing.
Climate risk First Street
- Flood 1/10 Low FEMA zone X (unshaded) · 0% chance over 30 yrs
- Wildfire 1/10 Low
- Heat 3/10 Moderate 7 d/yr ≥101°F today · 14 d/yr by 30 yrs out
- Wind 2/10 Low
- Air quality 1/10 Low 0 unhealthy d/yr today · 0 by 30 yrs out
Nearby sold comps map
Loading sold comps map…
Walkable amenities ~0.75 mi
Loading nearby amenities…
Taxation est. · year 1
- Rental income
- $121,872
- − Mortgage interest
- −$67,219
- − Property taxes
- −$13,834
- − Insurance
- −$6,000
- − Repairs & maintenance
- −$9,750
- − Management
- −$9,750
- − Depreciation
- −$34,909
- Taxable loss
- −$19,589
- Est. tax savings @ 24.0%
- +$4,701
- After-tax cash flow
- $5,631/yr
For passive investors: Depreciation is non-cash, so a rental often shows a tax loss while cash-flowing — sheltering income. Rental losses are passive: they offset passive income freely, and up to $25,000/yr can offset ordinary (W-2) income if you actively participate and your MAGI is under $100k (phasing out to $0 by $150k); unused losses carry forward. On sale, claimed depreciation is recaptured at up to 25%, and gains may owe capital-gains tax (a 1031 exchange can defer both). Figures are a year-1 estimate at your 24.0% rate — not tax advice; consult a CPA.
Schools (NCES district)
- District
- La Crosse School District
- NCES district ID
- 5507530
- Math proficiency
- 29% ▼ -8.00%
- Reading proficiency
- 34% ▼ -4.00%
- Median HH income
- $42,924
- Composite
- 26.76/100
- National rank
- #7135
- State rank
- #267 of 342 in WI
Livability — La Crosse
- Score
- 69/100
- State rank
- #339
- US rank
- #8671
Category grades
Schools grade is shown separately in the Schools card above.
Census & demographics
- Census place
- La Crosse, WI
- County
- La Crosse County · 89,439 people
- City population
- 64,135
- Metro
- La Crosse-Onalaska, WI-MN
- Population (ZIP)
- 50,397
- Household income
- $61,639
- Rent vs Own
- Severe rent burden
- 2352.0
Population outlook (La Crosse County) Hauer SSP2
- Today (2025)
- 126,082 people
- By 2030
- 130,161 · +3.2%
- By 2040
- 137,231 · +8.8%
- By 2050
- 143,506 · +13.8%
- By 2075
- 160,149 · +27.0%
- By 2100
- 166,408 · +32.0%
Race, ethnicity, and origin ACS 2023
- Neighborhood character
- Predominantly White (89%)
- Race & ethnicity
- White 89% Asian 4% Two or more races 3% Hispanic / Latino 3% Black 1%
- Common ancestry
- Portuguese 14% Romanian 6% Lithuanian 2%
- Foreign-born
- 3% · Canada
- Languages at home
- 95% English-only · Spanish 2% Other Asian/Pacific 1% Other Indo-European 1%
Political lean MEDSL · La Crosse
- 2024 margin
- Lean D (+9.4) · D 54.0% · R 44.6% · Other 1.4%
- 2008→2024 swing
- -14.1pp toward R · 2008: 23.4pp · 2024: 9.4pp
- All cycles
- 2024: D+9.4 2020: D+13.5 2016: D+9.6 2012: D+17.3 2008: D+23.4
Not yet ingested
- Civics
- —
Market trends
- HPI YoY
- ▼ -186.70%
- Current HPI
- 236.4506
- Rent YoY
- ▲ 2.72%
- Metro
- La Crosse-Onalaska, WI-MN
- State GDP YoY
- ▲ 2.10%
- F500 in state
- 20
Industry mix (Fortune 500 HQ in WI)
| Industry | F500 HQs | Revenue |
|---|---|---|
| Industrial Machinery | 4 | $23B |
|
||
| Industrial Technology | 2 | $36B |
|
||
| Insurance | 1 | $36B |
|
||
| Professional Services | 1 | $19B |
|
||
| Utilities | 1 | $9B |
|
||
| Consumer Goods | 1 | $3B |
|
||
Price history
+23.1% since first listed5 events — show timeline
- 2026-06-10 Listed $1,200,000 METROMLS
- 2023-05-25 Rental Removed — RENT.
- 2021-03-25 Listing Removed — METROMLS
- 2021-03-10 Listed $795,500 METROMLS
- 2014-04-10 Sold (Public Records) $975,000 Public Records
Property tax history
+5.2%/yrLatest (2025): $13,834 · -3.9% YoY. Source: county tax records.
Cash-flow waterfall
monthlySold comps — $/sqft
last 12 mo · ≤1 miLoading sold comps…