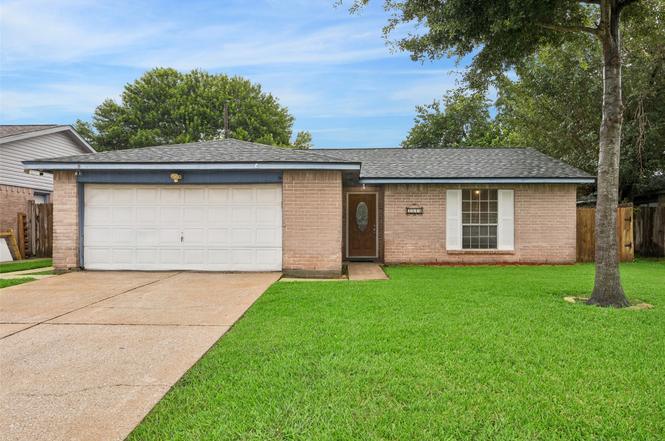
2114 Mocking Bird Ln · La Porte, TX
Flood risk 1/10 · Minimal
- FEMA flood zone
- X (unshaded)
- Chance of flooding over 30 yrs
- 0.0%
- Est. flood insurance / yr
- $507 – $1,088
Fire risk 1/10 · Minimal
- Est. fire insurance / yr
- $1,222 – $2,270
Heat risk 9/10 · Severe
- Hot days now (above 108°F)
- 7 days/yr
- Hot days in 30 yrs
- 25 days/yr
Wind risk 9/10 · Severe
- Chance of severe wind over 30 yrs
- 99.0%
Air-quality risk 2/10 · Minimal
- Unhealthy air days now
- 2 days/yr
- Unhealthy air days in 30 yrs
- 2 days/yr
Risk factors via First Street. Map © Google.
Why this score? — see what drove the D+ grade
The composite is a weighted blend of 9 inputs, each scored 0–100. Each bar is that input's sub-score; the figure is the points it added to the 100-point composite (weight × sub-score).
- Cash flow +12.9/30.0
- ARV discount +11.7/15.0
- 1% rule +4.8/10.0
- DSCR +3.9/10.0
- Schools +3.9/10.0
- Livability +3.5/5.0
- Rent growth +3.2/5.0
- Condition / age +2.5/5.0
- Appreciation +0.0/10.0
$205,000
🖨 Deal sheet 📄 Offer letter ✓ Due diligence
Listing remarks MLS
LOOK AT ME!! This is a lovely 1 story brick home that features 3 bedrooms 2 baths! The home has a large living area that is open to the breakfast area! The home features New Interior Paint, Updated Carpet in the living area, New tile in the kitchen, Updated Kitchen Countertops. New A/C and heater installed in 2010. Exterior has been replaced with Hardi-Plank Siding. The home has a large master bath with tub! Nice backyard with covered patio! Come see me today!!
Key facts
- 6,599 sq ft lot
- 2 garage spots
- Built 1978
Property features AI
Finance
- HOA & community: Meadowcrest HOA with an annual fee of $70; Community with curbs
Exterior
- Parking: Attached garage; 2 garage spaces; Driveway parking
- Utilities: Public water; Public sewer
- Home design: Residential property; Full ownership; Slab foundation; Built in 1978
- Construction: Brick and wood siding exterior; Composition roof
- Exterior features: Subdivision lot; Concrete road/driveway
Interior
- Kitchen: Dishwasher; Electric oven; Electric range; Disposal; Microwave
- Bedrooms: Primary bedroom (first floor), approximately 12x14; Bedroom (first floor), approximately 10x14; Bedroom (first floor), approximately 10x9; Two possible additional bedrooms
- Flooring: Plank flooring; Tile; Vinyl
- Bathrooms: 2 full bathrooms
- Heating & cooling: Central heating (electric); Central air (electric); Thermostat (energy-efficient)
- Interior features: Soaking tub; Tub with shower; Ceiling fans; Programmable thermostat; Five total rooms
- Laundry & utility: Washer hookup; Electric dryer hookup
Neighborhood map
What this means for you Summary
Snapshot
- This is a 3-bed/2.0-bath single-family listed at $205k.
Deal economics
- At list price, monthly cash flow is $-14 ($-174/yr) — negative.
- To cash-flow at today's rent, offer at most $202k (1.2% below list).
- To meet the 1% rule (rent ≥ 1% of price), the offer needs to be $202k (1.7% below list).
- Recommended offer: $202k (1.7% below list) — sets the bar for 1% rule.
- Cap rate 6.2% vs local median 3.4% in La Porte — top-decile yield for the area; either an underpriced asset or a hidden risk that comps aren't pricing in. Stress-test before assuming the spread holds.
Location & tenants
- Location reads 70/100 on livability (#360 in TX) — a middle-class / working-renter tenant base. Strengths: cost of living A+, housing A+, crime A-; Watch: amenities F, commute F, health & safety F.
- La Porte ISD (suburban): math 41% / reading 44% proficiency, ranked #260 of 826 in TX (top 32%) — families likely to look elsewhere, expect single-tenant / working-renter base with shorter leases.
- Zoned schools: La Porte H S (math 24% / reading 46%, grade F, #954 of 1,632 statewide, top 59%, 2,069 students, 51% FRL).
- Market conditions: Rents rising (+2.8%/yr); 337 active listings in the ZIP; 4 comparable units currently listed for rent nearby; rentals lingering (median 44d on market — plan ~5-8 weeks vacancy on turnover, expect pricing pressure); 50% of comp listings sitting > 30 days — soft ceiling on asking rent; solid renter incomes; 29,883 units permitted in Harris County in 2024 (8,621 in 5+ unit buildings).
Forward outlook
- Local home prices are declining (-3.0%/yr); year-one equity from $1k of loan paydown is wiped out by about $6k of value loss. Plan a longer hold.
- Harris County population projected at +47% by 2050 — long-run rental-demand tailwind backs the buy-and-hold thesis.
Negotiation context
- Only 2 days on market — expect competitive offers; lowballing is unlikely to land.
- 2 sale attempts since 14y ago with the ask held roughly flat each time — persistent listings suggest the price (not the market) is what's stuck; bring a comps-based counter.
- Current owner paid $61k; list at $205k implies a 238% gain — meaningful room to come down on a strong offer.
Risks & watch-outs
- Watch-outs: property tax is 2.6% of price.
- Climate carrying-cost: severe wind risk, 99% chance of damaging wind over 30y; extreme-heat days projected 7→25/yr by 2055 (HVAC capex compounding) — expect insurance premiums to compound above CPI over the hold.
Questions for the listing agent
- What do current leases actually rent for vs. the listed asking? Can we see a recent rent roll and the last 12 months of T-12 income?
- Built in 1978 — when were the roof, HVAC, electrical panel, plumbing, and water heater last replaced?
- Property tax is high relative to price — has the assessment been appealed recently, and will the sale trigger a re-assessment?
- What does the HOA fee cover, when was the last increase, and are there any pending special assessments or reserve-fund shortfalls?
- Is there a deadline driving the sale (1031 exchange, divorce, estate, relocation)? That informs how much negotiation room exists.
- Schools are D-rated, which usually means shorter tenancies and higher turnover. Who's the typical renter profile here, and what's been the actual vacancy rate?
- The area grade is low — what's the realistic commute time and amenity access for the typical tenant pool here? Any planned neighborhood developments (good or bad) we should know about?
- What's the average days-on-market for RENTAL listings here right now (not sales)? A rising rental-DOM trend means longer vacancies and softer asking-rent achievability than the comps imply.
- What's the recent tenant-quality profile in this submarket — average credit score on applications, eviction rate, late-payment / NSF rate, and stable-employment percentage? A property-management company in the area should have these aggregated.
- How much new for-sale + rental construction is in the pipeline within 1–3 miles? Heavy new supply typically softens prices + rents 12–24 months out; constrained supply supports both.
Investment metrics
- 1% rule
- 0.98% ✗
- Cap rate
- 6.21%
- Cash-on-cash
- -0.30%
- DSCR
- 0.99
- GRM
- 8.5
CMA / ARV
- ARV (on-the-fly)
- $226,256
- Comps found
- 12
Show comp detail 12 sales within ~0.75 mi
| Address | Dist | Beds/Ba | Sqft | Sold | Price | $/sf | Match |
|---|---|---|---|---|---|---|---|
| 9803 Wren St | 0.19mi | 3/2.0 | 1,292 (+2%) | 3mo | $250,000 | $193 | 85 |
| 1113 Maple Creek Dr | 0.27mi | 3/2.0 | 1,231 (-3%) | 1mo | $230,000 | $187 | 82 |
| 1306 Canyon Springs Dr | 0.37mi | 3/2.0 | 1,238 (-2%) | 9mo | $247,900 | $200 | 72 |
| 1133 Willow Creek Dr | 0.21mi | 3/2.0 | 1,344 (+6%) | 10mo | $219,000 | $163 | 71 |
| 754 Sugar Hill Dr | 0.37mi | 3/2.0 | 1,338 (+6%) | 4mo | $230,000 | $172 | 70 |
| 1325 Canyon Springs Dr | 0.43mi | 3/2.0 | 1,338 (+6%) | 3mo | $229,000 | $171 | 68 |
| 761 Otter Creek Dr | 0.36mi | 3/2.0 | 1,338 (+6%) | 10mo | $240,000 | $179 | 65 |
| 5434 Sugar Creek Dr | 0.58mi | 3/2.0 | 1,295 (+2%) | 5mo | $225,000 | $174 | 64 |
| 3601 Clover Ln | 0.66mi | 3/2.0 | 1,226 (-3%) | 2mo | $229,000 | $187 | 63 |
| 906 River Creek Dr | 0.41mi | 3/2.0 | 1,419 (+12%) | 0mo | $285,000 | $201 | 60 |
| 1910 Coupland Dr | 0.63mi | 3/2.0 | 1,372 (+8%) | 5mo | $235,000 | $171 | 53 |
| 5421 Beaver Creek Dr | 0.53mi | 4/2.0 (+1) | 1,415 (+12%) | 8mo | $225,000 | $159 | 43 |
Match score weights: distance 35% · size 25% · config 20% · recency 20%. Top-matched comps best support the ARV.
Projected returns pro-forma
-3.0% appreciation · 2.81% rent growth · sell at horizon
- IRR
- -17.0%
- Equity multiple
- 0.40×
- Total profit
- $-34,379
- Equity at exit
- $30,566
- IRR
- -9.1%
- Equity multiple
- 0.44×
- Total profit
- $-32,100
- Equity at exit
- $17,725
Cash invested: $57,400 (down + closing). Projections, not guarantees.
Landlord ↔ Tenant lean methodology
- Overall (STATE)
- 87 Strongly Landlord-Friendly
- State Texas
- 87 Strongly Landlord-Friendly · R+5
- County
- — inherits STATE
- City
- — inherits STATE
ZIP-level market 77571
- Home prices YoY
- -28.9%
- Rents YoY
- 2.8%
- Active inventory
- 337
- Price-to-rent
- 8.5×
Monthly cashflow live
- Estimated rent
- $2,015 medium interval (Pro) →
- Mortgage (P&I)
- −$1,075
- Tax from tax record
- −$440 /mo · $5,279/yr
- Insurance
- −$85
- HOA
- −$6
- Vacancy / Maint / Mgmt
- −$423
- Net cashflow
- $-14
Break-even live
UW: 25.0% down · 7.5% · 30yr · 1.5% tax · 5.0% vac · 8.0% maint · 8.0% mgmt
Financing live
Cash to close
- Down payment
- $51,250
- Closing costs
- $6,150
- Reserves months
- —
- Total cash needed
- —
Loan-product check · same deal, 3 products live
Conventional
25% down · 7.5% · 30yr
- Down + closing
- —
- Monthly P&I
- —
- Monthly cashflow
- —
- DSCR
- —
- Eligible?
- —
Personal DTI + credit; lowest rate.
DSCR
20% down · 8.5% · 30yr
- Down + closing
- —
- Monthly P&I
- —
- Monthly cashflow
- —
- DSCR
- —
- Eligible?
- —
No personal income docs; deal must DSCR.
Hard money
10% down · 12.0% · 12mo
- Down + closing
- —
- Monthly P&I
- —
- Monthly cashflow
- —
- DSCR
- —
- Eligible?
- —
Short-term bridge; refi at stabilization.
Rent comps 4 comps
| Address | Beds | Baths | Sqft | Rent | $/sqft | DOM | Units | Dist |
|---|---|---|---|---|---|---|---|---|
| 5222 Valley View Dr La Porte, TX | 3.0 | 2.0 | 1739 | $1,970 | $1.13 | 44d | 1 | 0.66mi |
| 9999 Spencer Hwy La Porte, TX | 1.0–2.0 | 1.0–2.0 | 849 | $1,475 | $1.74 | 5d | 6 | 0.72mi |
| 4922 Crestway Dr La Porte, TX | 3.0 | 2.0 | 1465 | $2,155 | $1.47 | 5d | 1 | 0.85mi |
| 10007 Winding Trail Rd La Porte, TX | 3.0 | 2.0 | 1517 | $2,150 | $1.42 | 44d | 1 | 1.12mi |
HOA detail
- Monthly dues
- $6 · $72/yr
Listing history 3 events
-
2026-06-18days on market $205,000 Active 2 DOM
-
2026-06-17remarks 357-char remark
-
2026-06-17$205,000 Active 1 DOM
ⓘ Source: listings_history table (triggers on properties + properties_extension) + one-shot
backfill from property_details.listing_events for pre-trigger history.
Tax reassessment forecast TX · Resets to sale price
- Current annual tax
- $5,279 · $440/mo
- Projected year-2 tax
- $5,279 · $440/mo
- Expected delta
- $0/yr ($0/mo · 0.0%)
ⓘ Screening estimate from a state-policy table — verify with the county assessor before closing.
Climate risk First Street
- Flood 1/10 Low FEMA zone X (unshaded) · 0% chance over 30 yrs
- Wildfire 1/10 Low
- Heat 9/10 Extreme 7 d/yr ≥108°F today · 25 d/yr by 30 yrs out
- Wind 9/10 Extreme 99% chance of damaging wind over 30 yrs
- Air quality 2/10 Low 2 unhealthy d/yr today · 2 by 30 yrs out
Nearby sold comps map
Loading sold comps map…
Walkable amenities ~0.75 mi
Loading nearby amenities…
Taxation est. · year 1
- Rental income
- $24,181
- − Mortgage interest
- −$11,483
- − Property taxes
- −$5,279
- − Insurance
- −$1,025
- − Repairs & maintenance
- −$1,934
- − Management
- −$1,934
- − HOA
- −$72
- − Depreciation
- −$5,964
- Taxable loss
- −$3,511
- Est. tax savings @ 24.0%
- +$843
- After-tax cash flow
- $669/yr
For passive investors: Depreciation is non-cash, so a rental often shows a tax loss while cash-flowing — sheltering income. Rental losses are passive: they offset passive income freely, and up to $25,000/yr can offset ordinary (W-2) income if you actively participate and your MAGI is under $100k (phasing out to $0 by $150k); unused losses carry forward. On sale, claimed depreciation is recaptured at up to 25%, and gains may owe capital-gains tax (a 1031 exchange can defer both). Figures are a year-1 estimate at your 24.0% rate — not tax advice; consult a CPA.
Schools (NCES district)
- District
- La Porte ISD
- NCES district ID
- 4826190
- Math proficiency
- 41% ▼ -10.00%
- Reading proficiency
- 44% ▼ -4.00%
- Median HH income
- $71,841
- Composite
- 38.65/100
- National rank
- #4151
- State rank
- #260 of 826 in TX
Livability — La Porte
- Score
- 70/100
- State rank
- #360
- US rank
- #7754
Category grades
Schools grade is shown separately in the Schools card above.
Census & demographics
- Census place
- La Porte, TX
- County
- Harris County · 4,702,590 people
- City population
- 38,543
- Metro
- Houston-The Woodlands-Sugar Land, TX
- Population (ZIP)
- 38,543
- Household income
- $81,850
- Rent vs Own
- Severe rent burden
- 1176.0
Population outlook (Harris County) Hauer SSP2
- Today (2025)
- 5,571,493 people
- By 2030
- 6,089,821 · +9.3%
- By 2040
- 7,142,806 · +28.2%
- By 2050
- 8,185,864 · +46.9%
- By 2075
- 10,574,329 · +89.8%
- By 2100
- 12,109,958 · +117.4%
Race, ethnicity, and origin ACS 2023
- Neighborhood character
- Diverse neighborhood (Simpson 0.60)
- Race & ethnicity
- White 51% Hispanic / Latino 36% Two or more races 20% Black 8% Asian 1%
- Hispanic origin (detail)
- Mexican 31%
- Common ancestry
- Italian 4% Lithuanian 3% Iranian 1%
- Foreign-born
- 10% · Canada, Vietnam
- Languages at home
- 77% English-only · Spanish 21% Other Indo-European 1%
Political lean MEDSL · Harris
- 2024 margin
- Lean D (+5.5) · D 52.0% · R 46.4% · Other 1.6%
- 2008→2024 swing
- +3.9pp toward D · 2008: 1.6pp · 2024: 5.5pp
- All cycles
- 2024: D+5.5 2020: D+13.3 2016: D+12.4 2012: D+0.1 2008: D+1.6
Not yet ingested
- Civics
- —
Market trends
- HPI YoY
- ▼ -103.81%
- Current HPI
- 255.0768
- Rent YoY
- ▲ 2.81%
- Metro
- Houston-The Woodlands-Sugar Land, TX
- State GDP YoY
- ▲ 3.95%
- F500 in state
- 110
Industry mix (Fortune 500 HQ in TX)
| Industry | F500 HQs | Revenue |
|---|---|---|
| Energy | 16 | $1,198B |
|
||
| Technology | 5 | $198B |
|
||
| Engineering / Construction | 4 | $72B |
|
||
| Energy Services | 3 | $60B |
|
||
| Utilities | 3 | $41B |
|
||
| Healthcare | 2 | $330B |
|
||
Price history
+238.5% since first listed7 events — show timeline
- 2026-06-16 Listed $205,000 HARMLS
- 2012-07-17 Sold (Public Records) — Public Records
- 2012-07-13 Sold (MLS) — HARMLS
- 2012-05-29 Listing Removed — HARMLS
- 2012-01-21 Listed $99,900 HARMLS
- 2003-11-04 Sold (Public Records) — Public Records
- 1997-04-08 Sold (Public Records) $60,568 Public Records
Property tax history
+6.9%/yrLatest (2025): $5,279 · +5.8% YoY. Source: county tax records.
Cash-flow waterfall
monthlySold comps — $/sqft
last 12 mo · ≤1 miLoading sold comps…