1287 Highway Nn · Bolivar, MO
Flood risk 1/10 · Minimal
- FEMA flood zone
- X (unshaded)
- Chance of flooding over 30 yrs
- 0.0%
- Est. flood insurance / yr
- $507 – $1,088
Fire risk 5/10 · Moderate
- Est. fire insurance / yr
- $1,054 – $1,958
Heat risk 5/10 · Moderate
- Hot days now (above 107°F)
- 7 days/yr
- Hot days in 30 yrs
- 20 days/yr
Wind risk 2/10 · Minimal
- Chance of severe wind over 30 yrs
- —
Air-quality risk 3/10 · Minor
- Unhealthy air days now
- 2 days/yr
- Unhealthy air days in 30 yrs
- 3 days/yr
Risk factors via First Street. Map © Google.
Why this score? — see what drove the B- grade
The composite is a weighted blend of 9 inputs, each scored 0–100. Each bar is that input's sub-score; the figure is the points it added to the 100-point composite (weight × sub-score).
- Cash flow +30.0/30.0
- 1% rule +10.0/10.0
- DSCR +10.0/10.0
- ARV discount +7.5/15.0
- Schools +3.8/10.0
- Livability +3.4/5.0
- Rent growth +2.5/5.0
- Condition / age +2.5/5.0
- Appreciation +0.0/10.0
$59,900
🖨 Deal sheet 📄 Offer letter ✓ Due diligence
Listing remarks
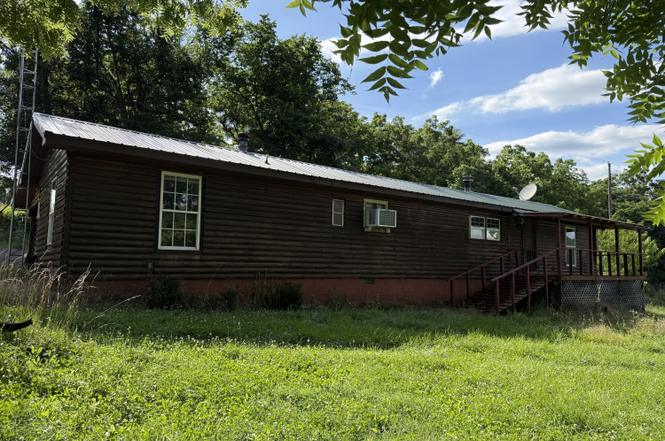
If you've been waiting for an affordable property where hard work can build equity, this could be the opportunity you've been looking for. Situated on 0.97 acres with state highway frontage, this 3-bedroom, 2-bath 1983 single-wide with an addition offers log cedar-style siding, a metal roof, private well and septic, and is located in the Bolivar School District. Just a short drive from Pomme de Terre Lake, you'll enjoy the freedom of country living with easy access to fishing, boating, and recreation. This home was once well-loved and filled with memories. While time and vacancy have taken their toll, it now awaits someone with vision to write its next chapter. The home needs significant re
Key facts
- Private well
- Septic
- 0.97 acre lot
Tags
Property features AI
Exterior
- Parking: Detached or attached garage with 1 parking space
- Utilities: Private water supply; Septic tank sewer; Propane for utilities
- Home design: Manufactured single-wide home; Residential single-family property
- Construction: Wood siding exterior; Metal roof; Block foundation; Built as manufactured housing
- Exterior features: Covered porch/patio; Barbed wire fencing; Asphalt road frontage along highway; Lot of about 0.97 acre
Interior
- Kitchen: Gas oven; Dishwasher
- Bedrooms: Laundry on main level
- Bathrooms: 2 full bathrooms
- Heating & cooling: Propane heating; Window unit cooling
- Interior features: Gas oven; Dishwasher; Window air conditioning units
- Laundry & utility: Main-level laundry
Neighborhood map
What this means for you Summary
Snapshot
- This is a 3-bed/1.0-bath manufactured listed at $60k.
Deal economics
- At list price, monthly cash flow is $507 ($6k/yr) — positive.
- The deal already cash-flows at list — no discount required.
- Meets the 1% rule at list price ($1k rent vs $60k).
- Cap rate 16.4% vs local median 3.0% in Bolivar — top-decile yield for the area; either an underpriced asset or a hidden risk that comps aren't pricing in. Stress-test before assuming the spread holds.
Location & tenants
- Location reads 67/100 on livability (#215 in MO) — a middle-class / working-renter tenant base. Strengths: cost of living A+, housing A+, crime A-; Watch: amenities F, commute F, employment D-.
- Bolivar R-I (town): math 42% / reading 48% proficiency, ranked #101 of 324 in MO (top 31%) — families likely to look elsewhere, expect single-tenant / working-renter base with shorter leases.
- Zoned schools: Bolivar Primary (589 students, 55% FRL); Bolivar Middle (math 37% / reading 44%, grade F, #180 of 391 statewide, top 47%, 601 students, 48% FRL); Bolivar High (math 42% / reading 63%, grade C-, #89 of 521 statewide, top 17%, 839 students, 42% FRL) — zoned schools at 48% FRL track the district average.
- Market conditions: 200 active listings in the ZIP; 188 units permitted in Polk County in 2024 (40 in 5+ unit buildings).
Forward outlook
- Local home prices are declining (-3.0%/yr); year-one equity from $414 of loan paydown is wiped out by about $2k of value loss. Plan a longer hold.
- At projected returns (-3.0% appreciation + 3.0% rent growth), your $17k cash investment doubles in ~4 years — after that, you're playing with house money.
Negotiation context
- Only 1 days on market — expect competitive offers; lowballing is unlikely to land.
Risks & watch-outs
- Climate carrying-cost: moderate wildfire risk; extreme-heat days projected 7→20/yr by 2055 (HVAC capex compounding) — expect insurance premiums to compound above CPI over the hold.
Questions for the listing agent
- Is there a deadline driving the sale (1031 exchange, divorce, estate, relocation)? That informs how much negotiation room exists.
- What's the average days-on-market for RENTAL listings here right now (not sales)? A rising rental-DOM trend means longer vacancies and softer asking-rent achievability than the comps imply.
- What's the recent tenant-quality profile in this submarket — average credit score on applications, eviction rate, late-payment / NSF rate, and stable-employment percentage? A property-management company in the area should have these aggregated.
- How much new for-sale + rental construction is in the pipeline within 1–3 miles? Heavy new supply typically softens prices + rents 12–24 months out; constrained supply supports both.
Investment metrics
- 1% rule
- 1.83% ✓
- Cap rate
- 16.45%
- Cash-on-cash
- 36.26%
- DSCR
- 2.61
- GRM
- 4.5
CMA / ARV
No comps found within radius.
Projected returns pro-forma
-3.0% appreciation · 3.0% rent growth · sell at horizon
- IRR
- 32.0%
- Equity multiple
- 2.34×
- Total profit
- $22,557
- Equity at exit
- $8,931
- IRR
- 39.1%
- Equity multiple
- 4.65×
- Total profit
- $61,141
- Equity at exit
- $5,179
Cash invested: $16,772 (down + closing). Projections, not guarantees.
Landlord ↔ Tenant lean methodology
- Overall (STATE)
- 81 Strongly Landlord-Friendly
- State Missouri
- 81 Strongly Landlord-Friendly · R+10
- County
- — inherits STATE
- City
- — inherits STATE
ZIP-level market 65613
- Home prices YoY
- -9.7%
- Active inventory
- 200
- Price-to-rent
- 4.5×
Monthly cashflow live
- Estimated rent
- $1,098 medium interval (Pro) →
- Mortgage (P&I)
- −$314
- Tax from tax record
- −$22 /mo · $260/yr
- Insurance
- −$25
- HOA
- −$0
- Vacancy / Maint / Mgmt
- −$231
- Net cashflow
- $507
Break-even live
UW: 25.0% down · 7.5% · 30yr · 1.5% tax · 5.0% vac · 8.0% maint · 8.0% mgmt
Financing live
Cash to close
- Down payment
- $14,975
- Closing costs
- $1,797
- Reserves months
- —
- Total cash needed
- —
Loan-product check · same deal, 3 products live
Conventional
25% down · 7.5% · 30yr
- Down + closing
- —
- Monthly P&I
- —
- Monthly cashflow
- —
- DSCR
- —
- Eligible?
- —
Personal DTI + credit; lowest rate.
DSCR
20% down · 8.5% · 30yr
- Down + closing
- —
- Monthly P&I
- —
- Monthly cashflow
- —
- DSCR
- —
- Eligible?
- —
No personal income docs; deal must DSCR.
Hard money
10% down · 12.0% · 12mo
- Down + closing
- —
- Monthly P&I
- —
- Monthly cashflow
- —
- DSCR
- —
- Eligible?
- —
Short-term bridge; refi at stabilization.
Listing history 2 events
-
2026-06-17remarks 699-char remark
-
2026-06-17$59,900 Active 1 DOM
ⓘ Source: listings_history table (triggers on properties + properties_extension) + one-shot
backfill from property_details.listing_events for pre-trigger history.
Tax reassessment forecast MO · Resets to sale price
- Current annual tax
- $260 · $22/mo
- Projected year-2 tax
- $581 · $48/mo
- Expected delta
- +$321/yr (+$27/mo · 123.8%)
ⓘ Screening estimate from a state-policy table — verify with the county assessor before closing.
Climate risk First Street
- Flood 1/10 Low FEMA zone X (unshaded) · 0% chance over 30 yrs
- Wildfire 5/10 Major
- Heat 5/10 Major 7 d/yr ≥107°F today · 20 d/yr by 30 yrs out
- Wind 2/10 Low
- Air quality 3/10 Moderate 2 unhealthy d/yr today · 3 by 30 yrs out
Nearby sold comps map
Loading sold comps map…
Walkable amenities ~0.75 mi
Loading nearby amenities…
Taxation est. · year 1
- Rental income
- $13,178
- − Mortgage interest
- −$3,355
- − Property taxes
- −$260
- − Insurance
- −$300
- − Repairs & maintenance
- −$1,054
- − Management
- −$1,054
- − Depreciation
- −$1,743
- Taxable income
- $5,412
- Est. tax owed @ 24.0%
- −$1,299
- After-tax cash flow
- $4,783/yr
For passive investors: Depreciation is non-cash, so a rental often shows a tax loss while cash-flowing — sheltering income. Rental losses are passive: they offset passive income freely, and up to $25,000/yr can offset ordinary (W-2) income if you actively participate and your MAGI is under $100k (phasing out to $0 by $150k); unused losses carry forward. On sale, claimed depreciation is recaptured at up to 25%, and gains may owe capital-gains tax (a 1031 exchange can defer both). Figures are a year-1 estimate at your 24.0% rate — not tax advice; consult a CPA.
Schools (NCES district)
- District
- Bolivar R-I
- NCES district ID
- 2905370
- Math proficiency
- 42% ▼ -1.00%
- Reading proficiency
- 48% ▼ -2.00%
- Median HH income
- $40,332
- Composite
- 37.7/100
- National rank
- #4359
- State rank
- #101 of 324 in MO
Livability — Bolivar
- Score
- 67/100
- State rank
- #215
- US rank
- #10664
Category grades
Schools grade is shown separately in the Schools card above.
Census & demographics
- County
- Polk County · 17,666 people
- City population
- 17,666
- Metro
- Springfield, MO
- Population (ZIP)
- 17,666
- Household income
- $59,172
- Rent vs Own
- Severe rent burden
- 328.0
Population outlook (Polk County) Hauer SSP2
- Today (2025)
- 31,229 people
- By 2030
- 31,227 · +-0.0%
- By 2040
- 31,104 · -0.4%
- By 2050
- 30,553 · -2.2%
- By 2075
- 29,332 · -6.1%
- By 2100
- 26,387 · -15.5%
Race, ethnicity, and origin ACS 2023
- Neighborhood character
- Predominantly White (92%)
- Race & ethnicity
- White 92% Two or more races 4% Hispanic / Latino 2% Black 1% Asian 1%
- Common ancestry
- Italian 3% Lithuanian 2% Slovak 2%
- Foreign-born
- 3% · Canada, China
- Languages at home
- 97% English-only · Spanish 1% German/W. Germanic 1% Chinese 1%
Political lean MEDSL · Polk
- 2024 margin
- Solid R (+61.6) · D 18.6% · R 80.2% · Other 1.1%
- 2008→2024 swing
- -29.5pp toward R · 2008: -32.1pp · 2024: -61.6pp
- All cycles
- 2024: R+61.6 2020: R+59.5 2016: R+56.9 2012: R+43.2 2008: R+32.1
Not yet ingested
- Civics
- —
Market trends
- HPI YoY
- ▼ -26.90%
- Current HPI
- 251.2475
- Rent YoY
- —
- Metro
- Springfield, MO
- State GDP YoY
- ▲ 1.84%
- F500 in state
- 20
Industry mix (Fortune 500 HQ in MO)
| Industry | F500 HQs | Revenue |
|---|---|---|
| Healthcare | 1 | $163B |
|
||
| Insurance | 1 | $21B |
|
||
| Industrial Technology | 1 | $17B |
|
||
| Retail | 1 | $16B |
|
||
| Industrial Distribution | 1 | $10B |
|
||
| Utilities | 1 | $9B |
|
||
Price history
1 event — show timeline
- 2026-06-17 Listed $59,900 SOMO
Property tax history
+4.8%/yrLatest (2025): $260 · +3.4% YoY. Source: county tax records.
Cash-flow waterfall
monthlySold comps — $/sqft
last 12 mo · ≤1 miLoading sold comps…