 Multi-family
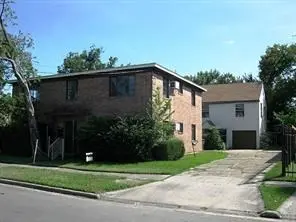
5342 Leeland St · Houston, TX
Flood risk 4/10 · Minor
- FEMA flood zone
- X (unshaded)
- Chance of flooding over 30 yrs
- 0.22%
- Est. flood insurance / yr
- $507 – $1,088
Fire risk 1/10 · Minimal
- Est. fire insurance / yr
- $1,222 – $2,270
Heat risk 9/10 · Severe
- Hot days now (above 109°F)
- 7 days/yr
- Hot days in 30 yrs
- 24 days/yr
Wind risk 9/10 · Severe
- Chance of severe wind over 30 yrs
- 99.0%
Air-quality risk 2/10 · Minimal
- Unhealthy air days now
- 2 days/yr
- Unhealthy air days in 30 yrs
- 2 days/yr
Risk factors via First Street. Map © Google.
Why this score? — see what drove the C- grade
The composite is a weighted blend of 9 inputs, each scored 0–100. Each bar is that input's sub-score; the figure is the points it added to the 100-point composite (weight × sub-score).
- Cash flow +17.7/30.0
- ARV discount +14.7/15.0
- DSCR +5.5/10.0
- 1% rule +4.8/10.0
- Livability +3.7/5.0
- Rent growth +3.1/5.0
- Schools +2.7/10.0
- Condition / age +2.5/5.0
- Appreciation +0.0/10.0
$450,000
🖨 Deal sheet (PDF) 📄 Offer letter ✓ Due diligence
Multi-family units
County records classify this as Multi-Family (5+ Unit). Listing-text estimate: 1 unit. estimate disagrees with records
5+ unit building — per-unit beds/baths from public records are typically unavailable; the breakdown below (if shown) is an estimate from the listing text.
Listing remarks
2 Story Fourplex in the front 4 1 bedroom units. with a 2 Story single family 3 bedroom home in the back. Back house and one unit in 4 plex rented. so front units available for looking close to U of H and train line great property for owner occupy or investor. no carpet!!! All 4 units recently updated.
Key facts
- Recently updated
- 2 story fourplex
- Single family home
Tags
Property features AI
Finance
- Financial info: Annual tax information available
Exterior
- Security: Security gate
- Utilities: Has heating and cooling
- Home design: Residential income property; Built in 1940
- Construction: Composition roof
- Exterior features: 8,000 sq ft lot
Interior
- Bedrooms: One bedroom in Unit 1; Five units total (four 1-bedroom units + one additional unit)
- Heating & cooling: Central heating (gas); Window cooling units
- Interior features: Security gate
Neighborhood map
What this means for you Summary
Snapshot
- This is a 4-bed/?-bath multifamily listed at $450k.
Deal economics
- At list price, monthly cash flow is $363 ($4k/yr) — positive.
- The deal already cash-flows at list — no discount required.
- To meet the 1% rule (rent ≥ 1% of price), the offer needs to be $440k (2.3% below list).
- Recommended offer: $440k (2.3% below list) — sets the bar for 1% rule.
- Cap rate 7.3% vs local median 3.2% in Houston — top-decile yield for the area; either an underpriced asset or a hidden risk that comps aren't pricing in. Stress-test before assuming the spread holds.
Location & tenants
- Location reads 74/100 on livability (#184 in TX, #4,771 nationally) — a middle-class / working-renter tenant base. Strengths: amenities A+, cost of living A+, housing A+; Watch: crime F.
- Houston ISD (urban): math 27% / reading 35% proficiency, ranked #593 of 826 in TX (top 72%) — families likely to look elsewhere, expect single-tenant / working-renter base with shorter leases; 71% free/reduced lunch — lower-income household profile, screen leases tightly.
- Zoned schools: Carrillo El (math 25% / reading 35%, grade F, #2,500 of 4,322 statewide, top 58%, 358 students, 87% FRL); Navarro Middle (math 8% / reading 13%, grade F, #1,639 of 1,662 statewide, top 99%, 547 students, 98% FRL); Austin H S (math 9% / reading 18%, grade F, #1,530 of 1,632 statewide, top 94%, 1,448 students, 97% FRL) — zoned schools average 94% FRL vs 71% district-wide (23 pts higher); higher-poverty schools than district average — tighter screening recommended.
- Zoned-school proficiency averages 18% at this address vs 31% district-wide (-13 pts) — the specific schools serving this property underperform the Houston ISD average; the district grade overstates school quality for this exact location.
- Market conditions: Rents rising (+2.4%/yr); 170 active listings in the ZIP; 7 comparable units currently listed for rent nearby; rentals leasing fast (median 1d on market — plan ~1-2 weeks tenant-placement turnaround); 29,883 units permitted in Harris County in 2024 (8,621 in 5+ unit buildings).
- At $4,396/mo this rent would consume 103% of the median local household income ($51k/yr) (locally 1311% of renters already pay >50% of income on rent) — very limited rent-growth headroom before tenants either downsize or default.
Forward outlook
- Local home prices are declining (-3.0%/yr); year-one equity from $3k of loan paydown is wiped out by about $14k of value loss. Plan a longer hold.
- Harris County population projected at +47% by 2050 — long-run rental-demand tailwind backs the buy-and-hold thesis.
Negotiation context
- It's been on market 17 days — a 2% lower offer ($443k) is reasonable based on typical stale-listing flexibility.
- 8 sale attempts since 18y ago; this cycle's ask has dropped $49k (10%) from the opening price — seller is motivated, your offer sets the floor, not the list.
Risks & watch-outs
- Watch-outs: built in 1940 — expect roof / HVAC / electrical / plumbing capex.
- Climate carrying-cost: severe wind risk, 99% chance of damaging wind over 30y; extreme-heat days projected 7→24/yr by 2055 (HVAC capex compounding) — expect insurance premiums to compound above CPI over the hold.
Questions for the listing agent
- Built in 1940 — when were the roof, HVAC, electrical panel, plumbing, and water heater last replaced?
- Is there a deadline driving the sale (1031 exchange, divorce, estate, relocation)? That informs how much negotiation room exists.
- Schools are D-rated, which usually means shorter tenancies and higher turnover. Who's the typical renter profile here, and what's been the actual vacancy rate?
- Crime grade is F in this area — have there been break-ins, vandalism, or insurance claims at this property in the last 3 years? What carrier currently insures it and at what premium?
- What's the average days-on-market for RENTAL listings here right now (not sales)? A rising rental-DOM trend means longer vacancies and softer asking-rent achievability than the comps imply.
- What's the recent tenant-quality profile in this submarket — average credit score on applications, eviction rate, late-payment / NSF rate, and stable-employment percentage? A property-management company in the area should have these aggregated.
- How much new apartment / multifamily construction is in the pipeline within 1–3 miles? Heavy new supply (>2% of stock underway) typically softens rents 12–24 months out; light construction supports rent growth.
Investment metrics
- 1% rule
- 0.98% ✗
- Cap rate
- 7.26%
- Cash-on-cash
- 3.46%
- DSCR
- 1.15
- GRM
- 8.5
CMA / ARV
- ARV (on-the-fly)
- $535,392
- Comps found
- 4
Show comp detail 4 sales within ~0.75 mi
| Address | Dist | Beds/Ba | Sqft | Sold | Price | $/sf | Match |
|---|---|---|---|---|---|---|---|
| 5201 Claremont St | 0.26mi | 4/1.0 | 2,642 (+3%) | 14mo | $499,000 | $189 | 72 |
| 1510 Munger St | 0.68mi | 5/5.0 (+1) | 2,616 (+2%) | 13mo | $675,000 | $258 | 50 |
| 1505 Scharpe St | 0.71mi | 4/1.0 | 2,758 (+7%) | 16mo | $450,000 | $163 | 42 |
| 1514 Scharpe St | 0.73mi | 4/2.0 | 2,305 (-10%) | 23mo | $479,000 | $208 | 29 |
Match score weights: distance 35% · size 25% · config 20% · recency 20%. Top-matched comps best support the ARV.
Projected returns pro-forma
-3.0% appreciation · 2.43% rent growth · sell at horizon
- IRR
- -11.5%
- Equity multiple
- 0.59×
- Total profit
- $-52,241
- Equity at exit
- $67,096
- IRR
- -3.1%
- Equity multiple
- 0.80×
- Total profit
- $-25,621
- Equity at exit
- $38,908
Cash invested: $126,000 (down + closing). Projections, not guarantees.
Landlord ↔ Tenant lean methodology
- Overall (STATE)
- 87 Strongly Landlord-Friendly
- State Texas
- 87 Strongly Landlord-Friendly · R+5
- County
- — inherits STATE
- City
- — inherits STATE
ZIP-level market 77023
- Rents YoY
- 2.4%
- Active inventory
- 170
- Price-to-rent
- 38.5×
Monthly cashflow live
- Estimated rent
- $4,396 high interval (Pro) →
- Mortgage (P&I)
- −$2,360
- Tax est. 1.5%
- −$562 /mo · $6,750/yr
- Insurance
- −$188
- HOA
- −$0
- Vacancy / Maint / Mgmt
- −$923
- Net cashflow
- $363
Break-even live
Sensitivity live
| Price | -10% $674 | -5% $518 | +0% $363 | +5% $207 | +10% $52 |
|---|---|---|---|---|---|
| Rent | -10% $16 | -5% $189 | +0% $363 | +5% $537 | +10% $710 |
| Rate | -1.0pp $590 | -0.5pp $477 | base $363 | +0.5pp $246 | +1.0pp $128 |
4-unit breakdown (identical units grouped — click to expand)
| Units | Beds | Baths | Est. rent |
|---|---|---|---|
| 3× units | 1 | 1 | $2,925 |
| #1 | 1 | 1 | $975 |
| #2 | 1 | 1 | $975 |
| #3 | 1 | 1 | $975 |
| 1× unit | 3 | 1 | $1,471 |
| Total (4 units) | $4,396 | ||
UW: 25.0% down · 7.5% · 30yr · 1.5% tax · 5.0% vac · 8.0% maint · 8.0% mgmt
Financing live
Cash to close
- Down payment
- $112,500
- Closing costs
- $13,500
- Reserves months
- —
- Total cash needed
- —
Loan-product check · same deal, 3 products live
Conventional
25% down · 7.5% · 30yr
- Down + closing
- —
- Monthly P&I
- —
- Monthly cashflow
- —
- DSCR
- —
- Eligible?
- —
Personal DTI + credit; lowest rate.
DSCR
20% down · 8.5% · 30yr
- Down + closing
- —
- Monthly P&I
- —
- Monthly cashflow
- —
- DSCR
- —
- Eligible?
- —
No personal income docs; deal must DSCR.
Hard money
10% down · 12.0% · 12mo
- Down + closing
- —
- Monthly P&I
- —
- Monthly cashflow
- —
- DSCR
- —
- Eligible?
- —
Short-term bridge; refi at stabilization.
Rent comps 7 comps
| Address | Beds | Baths | Sqft | Rent | $/sqft | DOM | Units | Dist |
|---|---|---|---|---|---|---|---|---|
| 5504 Texas St Unit 1514810P Houston, TX | 3.0 | 2.5 | 1808 | $7,146 | $3.95 | 0d | 1 | 0.58mi |
| 5502 Texas St Unit 1514806P Houston, TX | 3.0 | 2.5 | 1808 | $7,179 | $3.97 | 0d | 1 | 0.58mi |
| 6403 Avenue C Unit 1019625P Houston, TX | 2.0–8.0 | 1.0–4.0 | 1232 | $4,801 | $3.90 | 0d | 2 | 0.77mi |
| 207 Edgewood St Houston, TX | 3.0 | 4.0 | 2577 | $3,250 | $1.26 | 45d | 1 | 0.83mi |
| 4535 Polk St Houston, TX | 5.0 | 4.0 | 3364 | $10,000 | $2.97 | 18d | 1 | 0.85mi |
| 1907 Cullen Blvd Houston, TX | 5.0 | 5.0 | 1990 | $999 | $0.50 | 26d | 1 | 1.29mi |
| 4001 Dallas St Unit 1029264P Houston, TX | 3.0 | 3.0 | 2174 | $5,220 | $2.40 | 0d | 1 | 1.32mi |
Listing history 11 events
-
2026-06-21days on market $450,000 Active 17 DOM
-
2026-06-18price $450,000 Active 14 DOM
-
2026-06-18days on market $499,000 Active 14 DOM
-
2026-06-17days on market $499,000 Active 13 DOM
-
2026-06-16days on market $499,000 Active 12 DOM
-
2026-06-15days on market $499,000 Active 11 DOM
-
2026-06-13days on market $499,000 Active 9 DOM
-
2026-06-09days on market $499,000 Active 5 DOM
-
2026-06-08days on market $499,000 Active 4 DOM
-
2026-06-07remarks 304-char remark
-
2026-06-07$499,000 Active 3 DOM
ⓘ Source: listings_history table (triggers on properties + properties_extension) + one-shot
backfill from property_details.listing_events for pre-trigger history.
Climate risk First Street
- Flood 4/10 Moderate FEMA zone X (unshaded) · 22% chance over 30 yrs
- Wildfire 1/10 Low
- Heat 9/10 Extreme 7 d/yr ≥109°F today · 24 d/yr by 30 yrs out
- Wind 9/10 Extreme 99% chance of damaging wind over 30 yrs
- Air quality 2/10 Low 2 unhealthy d/yr today · 2 by 30 yrs out
Nearby sold comps map
Loading sold comps map…
Walkable amenities ~0.75 mi
Loading nearby amenities…
Taxation est. · year 1
- Rental income
- $52,752
- − Mortgage interest
- −$25,207
- − Property taxes
- −$6,750
- − Insurance
- −$2,250
- − Repairs & maintenance
- −$4,220
- − Management
- −$4,220
- − Depreciation
- −$13,091
- Taxable loss
- −$2,986
- Est. tax savings @ 24.0%
- +$717
- After-tax cash flow
- $5,073/yr
For passive investors: Depreciation is non-cash, so a rental often shows a tax loss while cash-flowing — sheltering income. Rental losses are passive: they offset passive income freely, and up to $25,000/yr can offset ordinary (W-2) income if you actively participate and your MAGI is under $100k (phasing out to $0 by $150k); unused losses carry forward. On sale, claimed depreciation is recaptured at up to 25%, and gains may owe capital-gains tax (a 1031 exchange can defer both). Figures are a year-1 estimate at your 24.0% rate — not tax advice; consult a CPA.
Schools (NCES district)
- District
- Houston ISD
- NCES district ID
- 4823640
- Math proficiency
- 27% ▼ -18.00%
- Reading proficiency
- 35% ▼ -6.00%
- Median HH income
- $46,054
- Composite
- 26.63/100
- National rank
- #7173
- State rank
- #593 of 826 in TX
Livability — Houston
- Score
- 74/100
- State rank
- #184
- US rank
- #4771
Category grades
Schools grade is shown separately in the Schools card above.
Census & demographics
- Census place
- Houston, TX
- County
- Harris County · 4,702,590 people
- City population
- 3,226,434
- Metro
- Houston-The Woodlands-Sugar Land, TX
- Population (ZIP)
- 24,281
- Household income
- $51,430
- Rent vs Own
- Severe rent burden
- 1311.0
Population outlook (Harris County) Hauer SSP2
- Today (2025)
- 5,571,493 people
- By 2030
- 6,089,821 · +9.3%
- By 2040
- 7,142,806 · +28.2%
- By 2050
- 8,185,864 · +46.9%
- By 2075
- 10,574,329 · +89.8%
- By 2100
- 12,109,958 · +117.4%
Race, ethnicity, and origin ACS 2023
- Neighborhood character
- Predominantly Hispanic (77%)
- Race & ethnicity
- Hispanic / Latino 77% Two or more races 24% White 16% Black 4% Asian 2%
- Hispanic origin (detail)
- Mexican 64% Puerto Rican 1%
- Common ancestry
- Lithuanian 1% Italian 1% Romanian 1%
- Foreign-born
- 23% · Canada, China, Vietnam
- Languages at home
- 36% English-only · Spanish 62%
Political lean MEDSL · Harris
- 2024 margin
- Lean D (+5.5) · D 52.0% · R 46.4% · Other 1.6%
- 2008→2024 swing
- +3.9pp toward D · 2008: 1.6pp · 2024: 5.5pp
- All cycles
- 2024: D+5.5 2020: D+13.3 2016: D+12.4 2012: D+0.1 2008: D+1.6
Not yet ingested
- Civics
- —
Market trends
- HPI YoY
- ▼ -162.09%
- Current HPI
- 284.0587
- Rent YoY
- ▲ 2.43%
- Metro
- Houston-The Woodlands-Sugar Land, TX
- State GDP YoY
- ▲ 3.95%
- F500 in state
- 110
Industry mix (Fortune 500 HQ in TX)
| Industry | F500 HQs | Revenue |
|---|---|---|
| Energy | 16 | $1,198B |
|
||
| Technology | 5 | $198B |
|
||
| Engineering / Construction | 4 | $72B |
|
||
| Energy Services | 3 | $60B |
|
||
| Utilities | 3 | $41B |
|
||
| Healthcare | 2 | $330B |
|
||
Price history
+103.7% since first listed17 events — show timeline
- 2026-06-04 Listed $499,000 HARMLS
- 2026-01-05 Listing Removed — HARMLS
- 2025-11-07 Listed $555,000 HARMLS
- 2013-02-22 Listing Removed — HARMLS
- 2013-02-14 Relisted — HARMLS
- 2013-01-28 Pending — HARMLS
- 2013-01-17 Price Changed $149,900 HARMLS
- 2012-09-04 Listed $155,000 HARMLS
- 2009-06-01 Sold (MLS) — HARMLS
- 2009-04-21 Listing Removed — HARMLS
- 2009-03-30 Listed $185,000 HARMLS
- 2009-02-03 Listing Removed — HARMLS
- 2008-10-02 Listed $219,000 HARMLS
- 2008-09-28 Listing Removed — HARMLS
- 2008-05-30 Listing Removed — HARMLS
- 2008-05-30 Listed $219,000 HARMLS
- 2008-05-29 Listed $245,000 HARMLS
Cash-flow waterfall
monthlySold comps — $/sqft
last 12 mo · ≤1 miLoading sold comps…