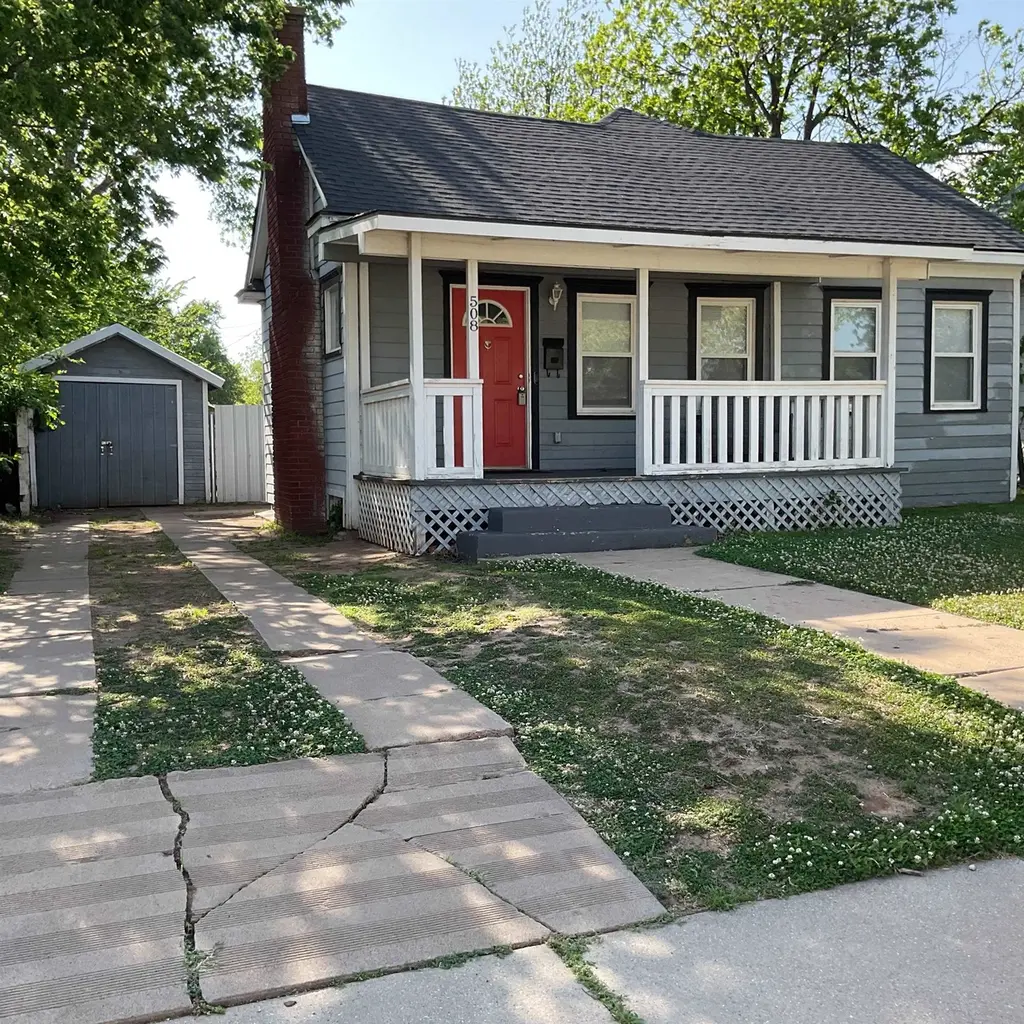
508 S Buchanan St · Enid, OK
Flood risk 1/10 · Minimal
- FEMA flood zone
- X (unshaded)
- Chance of flooding over 30 yrs
- 0.0%
- Est. flood insurance / yr
- $507 – $1,088
Fire risk 1/10 · Minimal
- Est. fire insurance / yr
- $2,463 – $4,575
Heat risk 6/10 · Moderate
- Hot days now (above 107°F)
- 7 days/yr
- Hot days in 30 yrs
- 19 days/yr
Wind risk 2/10 · Minimal
- Chance of severe wind over 30 yrs
- 2.0%
Air-quality risk 2/10 · Minimal
- Unhealthy air days now
- 0 days/yr
- Unhealthy air days in 30 yrs
- 1 days/yr
Risk factors via First Street. Map © Google.
Why this score? — see what drove the C grade
The composite is a weighted blend of 9 inputs, each scored 0–100. Each bar is that input's sub-score; the figure is the points it added to the 100-point composite (weight × sub-score).
- Cash flow +26.0/30.0
- DSCR +8.8/10.0
- 1% rule +6.4/10.0
- ARV discount +4.1/15.0
- Livability +3.2/5.0
- Rent growth +3.1/5.0
- Condition / age +2.5/5.0
- Schools +1.8/10.0
- Appreciation +0.0/10.0
$115,000
🖨 Deal sheet (PDF) 📄 Offer letter ✓ Due diligence
Listing remarks MLS
So Cute! This 2-bedroom 1 bathroom home is 1100 sq ft. and features a nice sized dining area fenced yard and lots of light. A definite must see.
Key facts
- Garage
- Built 1920
- Listed 56 days
Property features AI
Exterior
- Parking: Detached 1-car garage
- Security: Smoke detector(s)
- Utilities: Public water; Public sewer
- Home design: Single-family residence; One story; Faces east
- Construction: Wood siding
- Exterior features: Composition roof
Interior
- Kitchen: Dishwasher; Refrigerator; Water softener
- Flooring: Ceramic tile; Laminate; Tile
- Bathrooms: 1 full bathroom
- Heating & cooling: Central heating (natural gas); Central air; Ceiling fan(s)
- Interior features: Storm windows; Window coverings; Fireplace in family room
Neighborhood map
What this means for you Summary
Snapshot
- This is a 2-bed/1.0-bath single-family listed at $115k.
Deal economics
- At list price, monthly cash flow is $287 ($3k/yr) — positive.
- The deal already cash-flows at list — no discount required.
- Meets the 1% rule at list price ($1k rent vs $115k).
- Recommended offer: $112k (3.0% below list) — sets the bar for market timing.
- Cap rate 9.3% vs local median 5.0% in Enid — top-decile yield for the area; either an underpriced asset or a hidden risk that comps aren't pricing in. Stress-test before assuming the spread holds.
Location & tenants
- Location reads 63/100 on livability (#212 in OK) — a middle-class / working-renter tenant base. Strengths: cost of living A+, housing A+; Watch: employment C-, schools D-, crime F.
- Enid (town): math 19% / reading 22% proficiency, ranked #168 of 270 in OK (top 62%) — low school quality limits family demand, transient renter base, plan for 1-2y turnover; 64% free/reduced lunch — lower-income household profile, screen leases tightly.
- Market conditions: Rents rising (+2.4%/yr); 171 active listings in the ZIP; 19 units permitted in Garfield County in 2024 (0 in 5+ unit buildings).
Forward outlook
- Local home prices are declining (-3.0%/yr); year-one equity from $795 of loan paydown is wiped out by about $3k of value loss. Plan a longer hold.
- Garfield County population projected at +27% by 2050 — long-run rental-demand tailwind backs the buy-and-hold thesis.
Negotiation context
- It's been on market 57 days — a 3% lower offer ($112k) is reasonable based on typical stale-listing flexibility.
- 2 sale attempts since 4y ago with the ask held roughly flat each time — persistent listings suggest the price (not the market) is what's stuck; bring a comps-based counter.
- Current owner paid $85k; 35% above their basis — modest negotiation headroom, anchor on the comps not their cost.
Risks & watch-outs
- Watch-outs: built in 1920 — expect roof / HVAC / electrical / plumbing capex.
- Climate carrying-cost: extreme-heat days projected 7→19/yr by 2055 (HVAC capex compounding) — expect insurance premiums to compound above CPI over the hold.
Questions for the listing agent
- It's been on market 57 days. Have you received any prior offers? Is the seller open to a 3% concession, seller financing, or rate buy-down credit?
- Built in 1920 — when were the roof, HVAC, electrical panel, plumbing, and water heater last replaced?
- Is there a deadline driving the sale (1031 exchange, divorce, estate, relocation)? That informs how much negotiation room exists.
- Schools are D-rated, which usually means shorter tenancies and higher turnover. Who's the typical renter profile here, and what's been the actual vacancy rate?
- Crime grade is F in this area — have there been break-ins, vandalism, or insurance claims at this property in the last 3 years? What carrier currently insures it and at what premium?
- What's the average days-on-market for RENTAL listings here right now (not sales)? A rising rental-DOM trend means longer vacancies and softer asking-rent achievability than the comps imply.
- What's the recent tenant-quality profile in this submarket — average credit score on applications, eviction rate, late-payment / NSF rate, and stable-employment percentage? A property-management company in the area should have these aggregated.
- How much new for-sale + rental construction is in the pipeline within 1–3 miles? Heavy new supply typically softens prices + rents 12–24 months out; constrained supply supports both.
Investment metrics
- 1% rule
- 1.14% ✓
- Cap rate
- 9.29%
- Cash-on-cash
- 10.69%
- DSCR
- 1.48
- GRM
- 7.3
CMA / ARV
- ARV (on-the-fly)
- $106,894
- Comps found
- 12
Show comp detail 12 sales within ~0.75 mi
| Address | Dist | Beds/Ba | Sqft | Sold | Price | $/sf | Match |
|---|---|---|---|---|---|---|---|
| 1815 W Oklahoma Ave | 0.14mi | 3/2.0 (+1) | 1,062 (-4%) | 0mo | $120,000 | $113 | 78 |
| 2522 W Oklahoma Ave | 0.63mi | 2/1.0 | 1,134 (+3%) | 1mo | $99,000 | $87 | 65 |
| 1006 Seneca Ave | 0.66mi | 2/1.0 | 1,140 (+3%) | 2mo | $135,000 | $118 | 62 |
| 902 W York Ave | 0.62mi | 3/1.0 (+1) | 1,120 (+2%) | 4mo | $97,500 | $87 | 60 |
| 1024 W Oklahoma Ave | 0.47mi | 2/1.0 | 1,182 (+7%) | 8mo | $120,000 | $102 | 59 |
| 805 W Indiana Ave | 0.72mi | 2/1.0 | 1,027 (-7%) | 5mo | $70,000 | $68 | 51 |
| 1002 Sunset Ave | 0.71mi | 3/1.0 (+1) | 1,159 (+5%) | 6mo | $72,000 | $62 | 48 |
| 2418 W Broadway Ave | 0.66mi | 2/1.0 | 1,256 (+14%) | 1mo | $65,000 | $52 | 45 |
| 1401 S Johnson St | 0.66mi | 3/1.0 (+1) | 1,230 (+12%) | 1mo | $150,000 | $122 | 44 |
| 809 W Indiana Ave | 0.71mi | 2/1.0 | 975 (-12%) | 7mo | $133,000 | $136 | 42 |
| 1424 W Pine Ave | 0.67mi | 3/1.5 (+1) | 1,000 (-9%) | 6mo | $97,000 | $97 | 41 |
| 1824 W Elm Ave | 0.59mi | 3/1.0 (+1) | 1,248 (+13%) | 10mo | $65,500 | $52 | 37 |
Match score weights: distance 35% · size 25% · config 20% · recency 20%. Top-matched comps best support the ARV.
Projected returns pro-forma
-3.0% appreciation · 2.42% rent growth · sell at horizon
- IRR
- -0.9%
- Equity multiple
- 0.96×
- Total profit
- $-1,139
- Equity at exit
- $17,147
- IRR
- 8.1%
- Equity multiple
- 1.60×
- Total profit
- $19,409
- Equity at exit
- $9,943
Cash invested: $32,200 (down + closing). Projections, not guarantees.
Landlord ↔ Tenant lean methodology
- Overall (STATE)
- 83 Strongly Landlord-Friendly
- State Oklahoma
- 83 Strongly Landlord-Friendly · R+20
- County
- — inherits STATE
- City
- — inherits STATE
ZIP-level market 73703
- Rents YoY
- 2.4%
- Active inventory
- 171
- Price-to-rent
- 7.3×
Monthly cashflow live
- Estimated rent
- $1,308 medium interval (Pro) →
- Mortgage (P&I)
- −$603
- Tax from tax record
- −$96 /mo · $1,147/yr
- Insurance
- −$48
- HOA
- −$0
- Vacancy / Maint / Mgmt
- −$275
- Net cashflow
- $287
Break-even live
Sensitivity live
| Price | -10% $352 | -5% $319 | +0% $287 | +5% $254 | +10% $222 |
|---|---|---|---|---|---|
| Rent | -10% $183 | -5% $235 | +0% $287 | +5% $338 | +10% $390 |
| Rate | -1.0pp $345 | -0.5pp $316 | base $287 | +0.5pp $257 | +1.0pp $227 |
UW: 25.0% down · 7.5% · 30yr · 1.5% tax · 5.0% vac · 8.0% maint · 8.0% mgmt
Financing live
Cash to close
- Down payment
- $28,750
- Closing costs
- $3,450
- Reserves months
- —
- Total cash needed
- —
Loan-product check · same deal, 3 products live
Conventional
25% down · 7.5% · 30yr
- Down + closing
- —
- Monthly P&I
- —
- Monthly cashflow
- —
- DSCR
- —
- Eligible?
- —
Personal DTI + credit; lowest rate.
DSCR
20% down · 8.5% · 30yr
- Down + closing
- —
- Monthly P&I
- —
- Monthly cashflow
- —
- DSCR
- —
- Eligible?
- —
No personal income docs; deal must DSCR.
Hard money
10% down · 12.0% · 12mo
- Down + closing
- —
- Monthly P&I
- —
- Monthly cashflow
- —
- DSCR
- —
- Eligible?
- —
Short-term bridge; refi at stabilization.
Listing history 20 events
-
2026-06-19days on market $115,000 Active 57 DOM
-
2026-06-18days on market $115,000 Active 56 DOM
-
2026-06-17days on market $115,000 Active 55 DOM
-
2026-06-16days on market $115,000 Active 54 DOM
-
2026-06-15days on market $115,000 Active 53 DOM
-
2026-06-14days on market $115,000 Active 51 DOM
-
2026-06-12days on market $115,000 Active 50 DOM
-
2026-06-09days on market $115,000 Active 47 DOM
-
2026-06-08days on market $115,000 Active 46 DOM
-
2026-06-07days on market $115,000 Active 45 DOM
-
2026-06-02days on market $115,000 Active 40 DOM
-
2026-06-01days on market $115,000 Active 39 DOM
-
2026-05-31days on market $115,000 Active 38 DOM
-
2026-05-30days on market $115,000 Active 37 DOM
-
2026-04-22$115,000 Active
-
2022-07-08soldstatus $85,000 144-char remark
Show marketing remark (144 chars)
So Cute! This 2-bedroom 1 bathroom home is 1100 sq ft. and features a nice sized dining area fenced yard and lots of light. A definite must see.
-
2022-07-07soldstatus $85,000
-
2022-03-16$85,000 144-char remark
Show marketing remark (144 chars)
So Cute! This 2-bedroom 1 bathroom home is 1100 sq ft. and features a nice sized dining area fenced yard and lots of light. A definite must see.
-
2018-01-05soldstatus $53,000
-
2015-12-16soldstatus $78,500
ⓘ Source: listings_history table (triggers on properties + properties_extension) + one-shot
backfill from property_details.listing_events for pre-trigger history.
Tax reassessment forecast OK · Resets to sale price
- Current annual tax
- $1,147 · $96/mo
- Projected year-2 tax
- $1,147 · $96/mo
- Expected delta
- $0/yr ($0/mo · 0.0%)
ⓘ Screening estimate from a state-policy table — verify with the county assessor before closing.
Climate risk First Street
- Flood 1/10 Low FEMA zone X (unshaded) · 0% chance over 30 yrs
- Wildfire 1/10 Low
- Heat 6/10 Major 7 d/yr ≥107°F today · 19 d/yr by 30 yrs out
- Wind 2/10 Low 2% chance of damaging wind over 30 yrs
- Air quality 2/10 Low 0 unhealthy d/yr today · 1 by 30 yrs out
Nearby sold comps map
Loading sold comps map…
Walkable amenities ~0.75 mi
Loading nearby amenities…
Taxation est. · year 1
- Rental income
- $15,696
- − Mortgage interest
- −$6,442
- − Property taxes
- −$1,147
- − Insurance
- −$575
- − Repairs & maintenance
- −$1,256
- − Management
- −$1,256
- − Depreciation
- −$3,345
- Taxable income
- $1,676
- Est. tax owed @ 24.0%
- −$402
- After-tax cash flow
- $3,039/yr
For passive investors: Depreciation is non-cash, so a rental often shows a tax loss while cash-flowing — sheltering income. Rental losses are passive: they offset passive income freely, and up to $25,000/yr can offset ordinary (W-2) income if you actively participate and your MAGI is under $100k (phasing out to $0 by $150k); unused losses carry forward. On sale, claimed depreciation is recaptured at up to 25%, and gains may owe capital-gains tax (a 1031 exchange can defer both). Figures are a year-1 estimate at your 24.0% rate — not tax advice; consult a CPA.
Schools (NCES district)
- District
- Enid
- NCES district ID
- 4010920
- Math proficiency
- 19% ▼ -11.00%
- Reading proficiency
- 22% ▼ -9.00%
- Median HH income
- $42,389
- Composite
- 17.59/100
- National rank
- #9040
- State rank
- #168 of 270 in OK
Livability — Enid
- Score
- 63/100
- State rank
- #212
- US rank
- #15472
Category grades
Schools grade is shown separately in the Schools card above.
Census & demographics
- Census place
- Enid, OK
- County
- Garfield County · 55,032 people
- City population
- 55,032
- Metro
- Enid, OK
- Population (ZIP)
- 30,556
- Household income
- $73,333
- Rent vs Own
- Severe rent burden
- 702.0
Population outlook (Garfield County) Hauer SSP2
- Today (2025)
- 69,026 people
- By 2030
- 72,171 · +4.6%
- By 2040
- 79,366 · +15.0%
- By 2050
- 87,847 · +27.3%
- By 2075
- 112,714 · +63.3%
- By 2100
- 135,682 · +96.6%
Race, ethnicity, and origin ACS 2023
- Neighborhood character
- Predominantly White (78%)
- Race & ethnicity
- White 78% Hispanic / Latino 10% Two or more races 9% Black 2% Asian 2% Native American 2%
- Hispanic origin (detail)
- Mexican 8%
- Common ancestry
- Iranian 2% Slovak 2% Serbian 1%
- Foreign-born
- 4% · Canada, China
- Languages at home
- 92% English-only · Spanish 5% Other Asian/Pacific 2% Chinese 1%
Political lean MEDSL · Garfield
- 2024 margin
- Solid R (+53.8) · D 22.2% · R 76.0% · Other 1.8%
- 2008→2024 swing
- -2.8pp toward R · 2008: -51.0pp · 2024: -53.8pp
- All cycles
- 2024: R+53.8 2020: R+53.7 2016: R+53.5 2012: R+52.5 2008: R+51.0
Not yet ingested
- Civics
- —
Market trends
- HPI YoY
- ▼ -111.61%
- Current HPI
- 187.8197
- Rent YoY
- ▲ 2.42%
- Metro
- Enid, OK
- State GDP YoY
- ▲ 1.55%
- F500 in state
- 6
Industry mix (Fortune 500 HQ in OK)
| Industry | F500 HQs | Revenue |
|---|---|---|
| Energy | 3 | $48B |
|
||
Price history
+46.5% since first listed6 events — show timeline
- 2026-04-22 Listed $115,000 NWOAR
- 2022-07-08 Sold (MLS) $85,000 NWOAR
- 2022-07-07 Sold (Public Records) $85,000 Public Records
- 2022-03-16 Listed $85,000 NWOAR
- 2018-01-05 Sold (Public Records) $53,000 Public Records
- 2015-12-16 Sold (Public Records) $78,500 Public Records
Property tax history
+11.0%/yrLatest (2025): $1,147 · +4.3% YoY. Source: county tax records.
Cash-flow waterfall
monthlySold comps — $/sqft
last 12 mo · ≤1 miLoading sold comps…