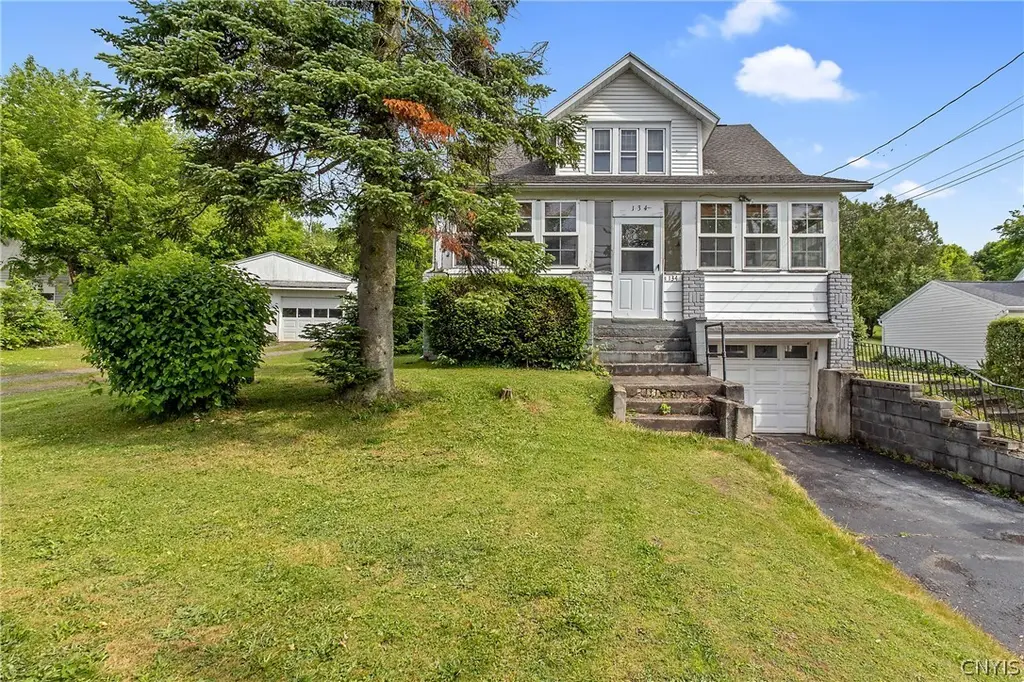
134 Armstrong Rd Rd · Lakeland, NY
Flood risk 1/10 · Minimal
- FEMA flood zone
- X (unshaded)
- Chance of flooding over 30 yrs
- 0.0%
- Est. flood insurance / yr
- $473 – $860
Fire risk 1/10 · Minimal
- Est. fire insurance / yr
- $691 – $1,283
Heat risk 3/10 · Minor
- Hot days now (above 95°F)
- 7 days/yr
- Hot days in 30 yrs
- 15 days/yr
Wind risk 1/10 · Minimal
- Chance of severe wind over 30 yrs
- 1.0%
Air-quality risk 2/10 · Minimal
- Unhealthy air days now
- 0 days/yr
- Unhealthy air days in 30 yrs
- 1 days/yr
Risk factors via First Street. Map © Google.
Why this score? — see what drove the C+ grade
The composite is a weighted blend of 9 inputs, each scored 0–100. Each bar is that input's sub-score; the figure is the points it added to the 100-point composite (weight × sub-score).
- Cash flow +20.4/30.0
- ARV discount +15.0/15.0
- 1% rule +6.8/10.0
- DSCR +6.5/10.0
- Livability +3.8/5.0
- Schools +3.1/10.0
- Rent growth +2.5/5.0
- Condition / age +2.5/5.0
- Appreciation +0.0/10.0
$179,900
🖨 Deal sheet 📄 Offer letter ✓ Due diligence
Listing remarks
A home that has truly stood the test of time, cherished by the same family for four generations, 102 years in total, is officially hitting the market for the very first time. Welcome to 134 Armstrong Rd! This Old-Style property sits on nearly 3 acres and offers 4 bedrooms, 1.5 baths, a living room and family room, and a sun-drenched enclosed patio with newer windows. You’ll also find a one-car garage under the house with additional storage. Outdoors, the property spans 2.95 acres, including a wooded section that may offer future development potential. A bonus detached 2-car garage with shop space, and a rear access door leads to an additional shed. While the home may need some TLC to
Key facts
- Wooded section
- Rear access door
- Additional shed
Tags
Property features AI
Exterior
- Parking: Attached garage with 3 spaces; Underground parking available; Garage with electricity
- Utilities: Electricity connected (circuit breakers); Public water connected; Sewer connected
- Home design: Single-story property; Existing construction
- Construction: Aluminum and vinyl siding; Asphalt roof; Block foundation
- Exterior features: Blacktop driveway; Enclosed porch; Front porch; Private yard; Shed(s) and storage; Second garage; See remarks
Interior
- Kitchen: Gas oven and gas range; Dishwasher; Range hood; Exhaust fan; Refrigerator; Eat-in kitchen (listed under interior features)
- Bedrooms: One bedroom on the main level; Total rooms: 9; Room types include bedroom, laundry, living room, bonus room, family room
- Flooring: Carpet; Laminate; Vinyl; Varies
- Bathrooms: 1 full bathroom; 1 half bathroom; One main-level bathroom
- Heating & cooling: Gas forced-air heating
- Interior features: Ceiling fan(s); Eat-in kitchen; Separate/formal living room; Pull-down attic stairs; Convertible bedroom
- Laundry & utility: Washer and dryer; Laundry located in the basement
Neighborhood map
What this means for you Summary
Snapshot
- This is a 4-bed/1.5-bath single-family listed at $180k.
Deal economics
- At list price, monthly cash flow is $234 ($3k/yr) — positive.
- The deal already cash-flows at list — no discount required.
- Meets the 1% rule at list price ($2k rent vs $180k).
Location & tenants
- Location reads 76/100 on livability (#219 in NY, #3,457 nationally) — a middle-class / working-renter tenant base. Strengths: employment A+, housing A+, crime A; Watch: schools C-, amenities F, commute F.
- Solvay Union Free School District (suburban): math 31% / reading 42% proficiency, ranked #550 of 590 in NY (top 93%) — families likely to look elsewhere, expect single-tenant / working-renter base with shorter leases.
- Market conditions: 59 active listings in the ZIP; 616 units permitted in Onondaga County in 2024 (256 in 5+ unit buildings).
- This rent runs 37% of the median local income ($68k/yr) — at the standard rent-burdened threshold; future hikes will face affordability resistance.
Forward outlook
- Local home prices are declining (-3.0%/yr); year-one equity from $1k of loan paydown is wiped out by about $5k of value loss. Plan a longer hold.
- Onondaga County population projected to shrink 9% by 2050 — rents likely to lag national; underwrite the cash flow, not the appreciation.
Negotiation context
- Only 6 days on market — expect competitive offers; lowballing is unlikely to land.
Risks & watch-outs
- Watch-outs: property tax is 2.8% of price; built in 1924 — expect roof / HVAC / electrical / plumbing capex.
Questions for the listing agent
- Built in 1924 — when were the roof, HVAC, electrical panel, plumbing, and water heater last replaced?
- Property tax is high relative to price — has the assessment been appealed recently, and will the sale trigger a re-assessment?
- Is there a deadline driving the sale (1031 exchange, divorce, estate, relocation)? That informs how much negotiation room exists.
- What's the average days-on-market for RENTAL listings here right now (not sales)? A rising rental-DOM trend means longer vacancies and softer asking-rent achievability than the comps imply.
- What's the recent tenant-quality profile in this submarket — average credit score on applications, eviction rate, late-payment / NSF rate, and stable-employment percentage? A property-management company in the area should have these aggregated.
- How much new for-sale + rental construction is in the pipeline within 1–3 miles? Heavy new supply typically softens prices + rents 12–24 months out; constrained supply supports both.
Investment metrics
- 1% rule
- 1.18% ✓
- Cap rate
- 7.85%
- Cash-on-cash
- 5.58%
- DSCR
- 1.25
- GRM
- 7.1
CMA / ARV
- ARV (on-the-fly)
- $264,992
- Comps found
- 7
Show comp detail 7 sales within ~0.75 mi
| Address | Dist | Beds/Ba | Sqft | Sold | Price | $/sf | Match |
|---|---|---|---|---|---|---|---|
| 105 Dubiel Ave | 0.30mi | 4/2.0 | 1,500 (+3%) | 9mo | $324,465 | $216 | 72 |
| 201 Lakeland Ave | 0.15mi | 3/1.5 (-1) | 1,600 (+10%) | 5mo | $220,000 | $138 | 68 |
| 109 Crosswalk Cir | 0.41mi | 3/2.5 (-1) | 1,500 (+3%) | 17mo | $285,000 | $190 | 53 |
| 704 State Fair Blvd | 0.55mi | 4/1.0 | 1,611 (+11%) | 2mo | $209,900 | $130 | 53 |
| 103 Benoit Dr | 0.46mi | 3/1.5 (-1) | 1,532 (+5%) | 22mo | $260,000 | $170 | 47 |
| 157 Alhan Pkwy | 0.71mi | 3/1.5 (-1) | 1,568 (+8%) | 5mo | $285,000 | $182 | 45 |
| 154 Golden Meadows Way | 0.65mi | 4/3.0 | 1,396 (-4%) | 15mo | $350,000 | $251 | 44 |
Match score weights: distance 35% · size 25% · config 20% · recency 20%. Top-matched comps best support the ARV.
Projected returns pro-forma
-3.0% appreciation · 3.0% rent growth · sell at horizon
- IRR
- -7.6%
- Equity multiple
- 0.72×
- Total profit
- $-14,086
- Equity at exit
- $26,824
- IRR
- 2.1%
- Equity multiple
- 1.15×
- Total profit
- $7,554
- Equity at exit
- $15,554
Cash invested: $50,372 (down + closing). Projections, not guarantees.
Landlord ↔ Tenant lean methodology
- Overall (STATE)
- 15 Strongly Tenant-Friendly
- State New York
- 15 Strongly Tenant-Friendly · D+10
- County
- — inherits STATE
- City
- — inherits STATE
ZIP-level market 13209
- Home prices YoY
- -7.7%
- Active inventory
- 59
- Price-to-rent
- 7.1×
Monthly cashflow live
- Estimated rent
- $2,116 medium interval (Pro) →
- Mortgage (P&I)
- −$943
- Tax from tax record
- −$419 /mo · $5,027/yr
- Insurance
- −$75
- HOA
- −$0
- Vacancy / Maint / Mgmt
- −$444
- Net cashflow
- $234
Break-even live
UW: 25.0% down · 7.5% · 30yr · 1.5% tax · 5.0% vac · 8.0% maint · 8.0% mgmt
Financing live
Cash to close
- Down payment
- $44,975
- Closing costs
- $5,397
- Reserves months
- —
- Total cash needed
- —
Loan-product check · same deal, 3 products live
Conventional
25% down · 7.5% · 30yr
- Down + closing
- —
- Monthly P&I
- —
- Monthly cashflow
- —
- DSCR
- —
- Eligible?
- —
Personal DTI + credit; lowest rate.
DSCR
20% down · 8.5% · 30yr
- Down + closing
- —
- Monthly P&I
- —
- Monthly cashflow
- —
- DSCR
- —
- Eligible?
- —
No personal income docs; deal must DSCR.
Hard money
10% down · 12.0% · 12mo
- Down + closing
- —
- Monthly P&I
- —
- Monthly cashflow
- —
- DSCR
- —
- Eligible?
- —
Short-term bridge; refi at stabilization.
Listing history 6 events
-
2026-06-18days on market $179,900 Active 6 DOM
-
2026-06-17days on market $179,900 Active 5 DOM
-
2026-06-16days on market $179,900 Active 4 DOM
-
2026-06-15days on market $179,900 Active 3 DOM
-
2026-06-13remarks 693-char remark
-
2026-06-13$179,900 Active 1 DOM
ⓘ Source: listings_history table (triggers on properties + properties_extension) + one-shot
backfill from property_details.listing_events for pre-trigger history.
Tax reassessment forecast NY · Partial reset (capped growth)
- Current annual tax
- $5,027 · $419/mo
- Projected year-2 tax
- $5,027 · $419/mo
- Expected delta
- $0/yr ($0/mo · 0.0%)
ⓘ Screening estimate from a state-policy table — verify with the county assessor before closing.
Climate risk First Street
- Flood 1/10 Low FEMA zone X (unshaded) · 0% chance over 30 yrs
- Wildfire 1/10 Low
- Heat 3/10 Moderate 7 d/yr ≥95°F today · 15 d/yr by 30 yrs out
- Wind 1/10 Low 100% chance of damaging wind over 30 yrs
- Air quality 2/10 Low 0 unhealthy d/yr today · 1 by 30 yrs out
Nearby sold comps map
Loading sold comps map…
Walkable amenities ~0.75 mi
Loading nearby amenities…
Taxation est. · year 1
- Rental income
- $25,389
- − Mortgage interest
- −$10,077
- − Property taxes
- −$5,027
- − Insurance
- −$900
- − Repairs & maintenance
- −$2,031
- − Management
- −$2,031
- − Depreciation
- −$5,233
- Taxable income
- $90
- Est. tax owed @ 24.0%
- −$22
- After-tax cash flow
- $2,789/yr
For passive investors: Depreciation is non-cash, so a rental often shows a tax loss while cash-flowing — sheltering income. Rental losses are passive: they offset passive income freely, and up to $25,000/yr can offset ordinary (W-2) income if you actively participate and your MAGI is under $100k (phasing out to $0 by $150k); unused losses carry forward. On sale, claimed depreciation is recaptured at up to 25%, and gains may owe capital-gains tax (a 1031 exchange can defer both). Figures are a year-1 estimate at your 24.0% rate — not tax advice; consult a CPA.
Schools (NCES district)
- District
- Solvay Union Free School District
- NCES district ID
- 3627150
- Math proficiency
- 31% ▼ -14.00%
- Reading proficiency
- 42% ▼ -4.00%
- Median HH income
- $47,163
- Composite
- 31.28/100
- National rank
- #6018
- State rank
- #550 of 590 in NY
Livability — Lakeland
- Score
- 76/100
- State rank
- #219
- US rank
- #3457
Category grades
Schools grade is shown separately in the Schools card above.
Census & demographics
- Census place
- Lakeland, NY
- County
- Onondaga County · 247,257 people
- City population
- 12,995
- Metro
- Syracuse, NY
- Population (ZIP)
- 12,714
- Household income
- $68,138
- Rent vs Own
- Severe rent burden
- 210.0
Population outlook (Onondaga County) Hauer SSP2
- Today (2025)
- 467,894 people
- By 2030
- 463,381 · -1.0%
- By 2040
- 447,697 · -4.3%
- By 2050
- 426,399 · -8.9%
- By 2075
- 373,661 · -20.1%
- By 2100
- 307,967 · -34.2%
Race, ethnicity, and origin ACS 2023
- Neighborhood character
- Predominantly White (86%)
- Race & ethnicity
- White 86% Two or more races 6% Hispanic / Latino 6% Black 3%
- Hispanic origin (detail)
- Mexican 1% Puerto Rican 4%
- Common ancestry
- Romanian 11% Subsaharan African 6% Lithuanian 2%
- Foreign-born
- 11% · Canada, China
- Languages at home
- 87% English-only · Russian/Polish/Slavic 5% Spanish 3% Arabic 2%
Political lean MEDSL · Onondaga
- 2024 margin
- D (+17.3) · D 58.6% · R 41.4%
- 2008→2024 swing
- -3.0pp toward R · 2008: 20.3pp · 2024: 17.3pp
- All cycles
- 2024: D+17.3 2020: D+20.6 2016: D+12.8 2012: D+21.1 2008: D+20.3
Not yet ingested
- Civics
- —
Market trends
- HPI YoY
- ▼ -27.23%
- Current HPI
- 326.7671
- Rent YoY
- —
- Metro
- Syracuse, NY
- State GDP YoY
- ▲ 2.60%
- F500 in state
- 92
Industry mix (Fortune 500 HQ in NY)
| Industry | F500 HQs | Revenue |
|---|---|---|
| Financial Services | 10 | $950B |
|
||
| Consumer Goods | 9 | $162B |
|
||
| Insurance | 4 | $225B |
|
||
| Telecommunications | 2 | $144B |
|
||
| Pharmaceuticals | 2 | $112B |
|
||
| Media / Entertainment | 2 | $69B |
|
||
Price history
1 event — show timeline
- 2026-06-12 Listed $179,900 CNYIS
Property tax history
+12.0%/yrLatest (2025): $5,027 · +1.3% YoY. Source: county tax records.
Cash-flow waterfall
monthlySold comps — $/sqft
last 12 mo · ≤1 miLoading sold comps…