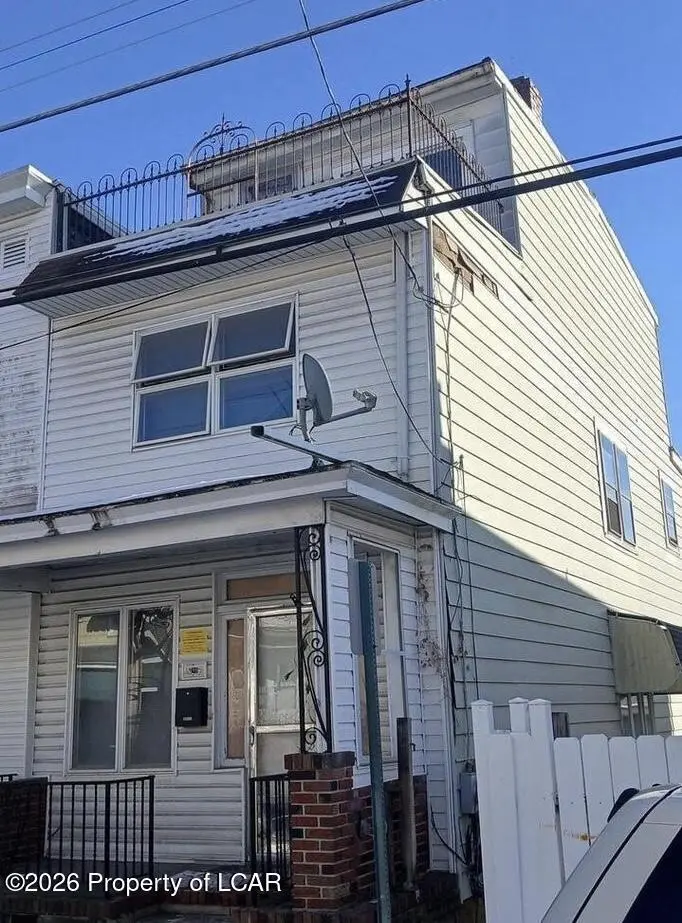
532 Coal St · Shenandoah, PA
Flood risk 6/10 · Moderate
- FEMA flood zone
- X (unshaded)
- Chance of flooding over 30 yrs
- 0.71%
- Est. flood insurance / yr
- $473 – $860
Fire risk 3/10 · Minor
- Est. fire insurance / yr
- $511 – $949
Heat risk 3/10 · Minor
- Hot days now (above 92°F)
- 7 days/yr
- Hot days in 30 yrs
- 16 days/yr
Wind risk 4/10 · Minor
- Chance of severe wind over 30 yrs
- 7.0%
Air-quality risk 2/10 · Minimal
- Unhealthy air days now
- 1 days/yr
- Unhealthy air days in 30 yrs
- 1 days/yr
Risk factors via First Street. Map © Google.
Why this score? — see what drove the C- grade
The composite is a weighted blend of 9 inputs, each scored 0–100. Each bar is that input's sub-score; the figure is the points it added to the 100-point composite (weight × sub-score).
- Cash flow +15.0/30.0
- ARV discount +7.5/15.0
- Appreciation +6.9/10.0
- 1% rule +5.0/10.0
- DSCR +5.0/10.0
- Livability +3.6/5.0
- Rent growth +2.5/5.0
- Condition / age +2.5/5.0
- Schools +2.4/10.0
$25,000
🖨 Deal sheet 📄 Offer letter ✓ Due diligence
Listing remarks MLS
FIXER UPPER, Drive by showing only. sold as is. Cash sale only.
Key facts
- 1,005 sq ft lot
- Listed 22 days
Property features AI
Finance
- Financial info: Annual tax amount approximately $803
Exterior
- Home design: Single-family residence; Three or more levels
- Construction: Above-grade finished area approximately 1,694
- Exterior features: Lot dimensions approximately 15 x 67; Located in the Abington Meadows subdivision; Residential zoning
Interior
- Bedrooms: 5 total rooms (bedroom count not specified)
- Bathrooms: 1 full bathroom
- Interior features: Basement
Neighborhood map
What this means for you Summary
Snapshot
- This is a 3-bed/1.5-bath single-family listed at $25k.
Deal economics
- At list price, monthly cash flow is $914 ($11k/yr) — positive.
- The deal already cash-flows at list — no discount required.
- Meets the 1% rule at list price ($1k rent vs $25k).
- Recommended offer: $25k (1.5% below list) — sets the bar for market timing.
- Cap rate 50.2% vs local median 12.5% in Shenandoah — top-decile yield for the area; either an underpriced asset or a hidden risk that comps aren't pricing in. Stress-test before assuming the spread holds.
Location & tenants
- Location reads 71/100 on livability (#720 in PA) — a middle-class / working-renter tenant base. Strengths: amenities A+, cost of living A+, health & safety A+; Watch: schools D-, commute F, employment F.
- Shenandoah Valley SD (town): math 20% / reading 38% proficiency, ranked #454 of 539 in PA (top 84%) — low school quality limits family demand, transient renter base, plan for 1-2y turnover; 66% free/reduced lunch — lower-income household profile, screen leases tightly.
- Market conditions: 63 active listings in the ZIP; 2 comparable units currently listed for rent nearby; 169 units permitted in Schuylkill County in 2024 (0 in 5+ unit buildings).
Forward outlook
- In year one you build about $1k of equity ($173 loan paydown + $961 appreciation (3.8% local appreciation)).
- Schuylkill County population projected at -16% by 2050 — secular population decline; favor cash flow + early exit over multi-decade hold.
- At projected returns (3.8% appreciation + 3.0% rent growth), your $7k cash investment doubles in ~1 year — after that, you're playing with house money.
Negotiation context
- It's been on market 23 days — a 2% lower offer ($25k) is reasonable based on typical stale-listing flexibility.
- 3 sale attempts with the ask held roughly flat each time — persistent listings suggest the price (not the market) is what's stuck; bring a comps-based counter.
Risks & watch-outs
- Watch-outs: property tax is 3.1% of price; built in 1945 — expect roof / HVAC / electrical / plumbing capex.
- Climate carrying-cost: major flood risk — expect insurance premiums to compound above CPI over the hold.
Questions for the listing agent
- Built in 1945 — when were the roof, HVAC, electrical panel, plumbing, and water heater last replaced?
- Property tax is high relative to price — has the assessment been appealed recently, and will the sale trigger a re-assessment?
- Is there a deadline driving the sale (1031 exchange, divorce, estate, relocation)? That informs how much negotiation room exists.
- Schools are D-rated, which usually means shorter tenancies and higher turnover. Who's the typical renter profile here, and what's been the actual vacancy rate?
- What's the average days-on-market for RENTAL listings here right now (not sales)? A rising rental-DOM trend means longer vacancies and softer asking-rent achievability than the comps imply.
- What's the recent tenant-quality profile in this submarket — average credit score on applications, eviction rate, late-payment / NSF rate, and stable-employment percentage? A property-management company in the area should have these aggregated.
- How much new for-sale + rental construction is in the pipeline within 1–3 miles? Heavy new supply typically softens prices + rents 12–24 months out; constrained supply supports both.
Investment metrics
- 1% rule
- 5.67% ✓
- Cap rate
- 50.15%
- Cash-on-cash
- 156.64%
- DSCR
- 7.97
- GRM
- 1.5
CMA / ARV
- ARV (on-the-fly)
- $157,542
- Comps found
- 9
Show comp detail 9 sales within ~0.75 mi
| Address | Dist | Beds/Ba | Sqft | Sold | Price | $/sf | Match |
|---|---|---|---|---|---|---|---|
| 28 N Gilbert St | 0.14mi | 4/1.0 (+1) | 1,678 (-1%) | 12mo | $90,000 | $54 | 74 |
| 142 Schuylkill Ave | 0.32mi | 3/1.0 | 1,607 (-5%) | 8mo | $68,250 | $42 | 68 |
| 39 S Schuylkill Ave | 0.39mi | 3/1.0 | 1,765 (+4%) | 11mo | $159,000 | $90 | 63 |
| 382 Ohio Ave | 0.57mi | 4/2.0 (+1) | 1,650 (-3%) | 10mo | $210,000 | $127 | 54 |
| 162 Swatara Rd | 0.53mi | 4/2.0 (+1) | 1,859 (+10%) | 4mo | $191,000 | $103 | 49 |
| 284 Indiana Ave | 0.46mi | 3/1.5 | 1,812 (+7%) | 23mo | $170,000 | $94 | 48 |
| 60 Schuylkill Ave | 0.36mi | 4/3.0 (+1) | 1,827 (+8%) | 20mo | $258,000 | $141 | 43 |
| 332 W Columbus St | 0.33mi | 4/1.0 (+1) | 1,525 (-10%) | 23mo | $60,000 | $39 | 42 |
| 250 Ohio Ave | 0.39mi | 4/1.5 (+1) | 1,900 (+12%) | 21mo | $176,000 | $93 | 39 |
Match score weights: distance 35% · size 25% · config 20% · recency 20%. Top-matched comps best support the ARV.
Projected returns pro-forma
3.84% appreciation · 3.0% rent growth · sell at horizon
- IRR
- —
- Equity multiple
- 9.91×
- Total profit
- $62,383
- Equity at exit
- $12,448
- IRR
- —
- Equity multiple
- 20.89×
- Total profit
- $139,227
- Equity at exit
- $20,181
Cash invested: $7,000 (down + closing). Projections, not guarantees.
Landlord ↔ Tenant lean methodology
- Overall (STATE)
- 62 Landlord-Friendly
- State Pennsylvania
- 62 Landlord-Friendly · EVEN
- County
- — inherits STATE
- City
- — inherits STATE
ZIP-level market 17976
- Home prices YoY
- 1.3%
- Active inventory
- 63
- Price-to-rent
- 1.5×
Monthly cashflow live
- Estimated rent
- $1,418 medium interval (Pro) →
- Mortgage (P&I)
- −$131
- Tax from tax record
- −$65 /mo · $779/yr
- Insurance
- −$10
- HOA
- −$0
- Vacancy / Maint / Mgmt
- −$298
- Net cashflow
- $914
Break-even live
UW: 25.0% down · 7.5% · 30yr · 1.5% tax · 5.0% vac · 8.0% maint · 8.0% mgmt
Financing live
Cash to close
- Down payment
- $6,250
- Closing costs
- $750
- Reserves months
- —
- Total cash needed
- —
Loan-product check · same deal, 3 products live
Conventional
25% down · 7.5% · 30yr
- Down + closing
- —
- Monthly P&I
- —
- Monthly cashflow
- —
- DSCR
- —
- Eligible?
- —
Personal DTI + credit; lowest rate.
DSCR
20% down · 8.5% · 30yr
- Down + closing
- —
- Monthly P&I
- —
- Monthly cashflow
- —
- DSCR
- —
- Eligible?
- —
No personal income docs; deal must DSCR.
Hard money
10% down · 12.0% · 12mo
- Down + closing
- —
- Monthly P&I
- —
- Monthly cashflow
- —
- DSCR
- —
- Eligible?
- —
Short-term bridge; refi at stabilization.
Rent comps 2 comps
| Address | Beds | Baths | Sqft | Rent | $/sqft | DOM | Units | Dist |
|---|---|---|---|---|---|---|---|---|
| 230 W Arlington St Shenandoah, PA | 3.0 | 1.0 | 1143 | $1,400 | $1.22 | 43d | 1 | 0.23mi |
| 25 E Oak St Shenandoah, PA | 4.0 | 1.5 | 2220 | $1,450 | $0.65 | 43d | 1 | 0.47mi |
Listing history 25 events
-
2026-06-18days on market $25,000 Active 23 DOM
-
2026-06-17days on market $25,000 Active 22 DOM
-
2026-06-16days on market $25,000 Active 21 DOM
-
2026-06-15days on market $25,000 Active 20 DOM
-
2026-06-13days on market $25,000 Active 18 DOM
-
2026-06-12days on market $25,000 Active 17 DOM
-
2026-06-09days on market $25,000 Active 14 DOM
-
2026-06-08days on market $25,000 Active 13 DOM
-
2026-06-08days on market $25,000 Active 12 DOM
-
2026-06-07days on market $25,000 Active 11 DOM
-
2026-06-04days on market $25,000 Active 8 DOM
-
2026-06-02days on market $25,000 Active 7 DOM
-
2026-06-01days on market $25,000 Active 6 DOM
-
2026-05-31days on market $25,000 Active 5 DOM
-
2026-05-02$25,000 Active
-
2026-04-10soldstatus $26,000 Closed 63-char remark
Show marketing remark (63 chars)
FIXER UPPER, Drive by showing only. sold as is. Cash sale only.
-
2026-04-03status Pending 63-char remark
Show marketing remark (63 chars)
FIXER UPPER, Drive by showing only. sold as is. Cash sale only.
-
2026-03-20price $29,000 63-char remark
Show marketing remark (63 chars)
FIXER UPPER, Drive by showing only. sold as is. Cash sale only.
-
2026-03-02$35,000 Active 63-char remark
Show marketing remark (63 chars)
FIXER UPPER, Drive by showing only. sold as is. Cash sale only.
-
2026-02-16soldstatus $20,000 Closed 276-char remark
Show marketing remark (276 chars)
Rehab Home in Shenandoah, PA. Drive by showings only. No interior access. Sold as-is. Buyer responsible for any clean out. Cash sales only. Title insurance is not available for this property due to it being purchased at tax sale less than one year ago. Call for any questions!
-
2026-02-01status Pending 276-char remark
Show marketing remark (276 chars)
Rehab Home in Shenandoah, PA. Drive by showings only. No interior access. Sold as-is. Buyer responsible for any clean out. Cash sales only. Title insurance is not available for this property due to it being purchased at tax sale less than one year ago. Call for any questions!
-
2026-02-01historical Active Under Contract 276-char remark
Show marketing remark (276 chars)
Rehab Home in Shenandoah, PA. Drive by showings only. No interior access. Sold as-is. Buyer responsible for any clean out. Cash sales only. Title insurance is not available for this property due to it being purchased at tax sale less than one year ago. Call for any questions!
-
2026-01-29$14,900 Active 276-char remark
Show marketing remark (276 chars)
Rehab Home in Shenandoah, PA. Drive by showings only. No interior access. Sold as-is. Buyer responsible for any clean out. Cash sales only. Title insurance is not available for this property due to it being purchased at tax sale less than one year ago. Call for any questions!
-
2026-01-27historical $14,900 276-char remark
Show marketing remark (276 chars)
Rehab Home in Shenandoah, PA. Drive by showings only. No interior access. Sold as-is. Buyer responsible for any clean out. Cash sales only. Title insurance is not available for this property due to it being purchased at tax sale less than one year ago. Call for any questions!
-
2006-07-06soldstatus $12,500
ⓘ Source: listings_history table (triggers on properties + properties_extension) + one-shot
backfill from property_details.listing_events for pre-trigger history.
Tax reassessment forecast PA · Partial reset (capped growth)
- Current annual tax
- $779 · $65/mo
- Projected year-2 tax
- $779 · $65/mo
- Expected delta
- $0/yr ($0/mo · 0.0%)
ⓘ Screening estimate from a state-policy table — verify with the county assessor before closing.
Climate risk First Street
- Flood 6/10 Major FEMA zone X (unshaded) · 71% chance over 30 yrs
- Wildfire 3/10 Moderate
- Heat 3/10 Moderate 7 d/yr ≥92°F today · 16 d/yr by 30 yrs out
- Wind 4/10 Moderate 7% chance of damaging wind over 30 yrs
- Air quality 2/10 Low 1 unhealthy d/yr today · 1 by 30 yrs out
Nearby sold comps map
Loading sold comps map…
Walkable amenities ~0.75 mi
Loading nearby amenities…
Taxation est. · year 1
- Rental income
- $17,015
- − Mortgage interest
- −$1,400
- − Property taxes
- −$779
- − Insurance
- −$125
- − Repairs & maintenance
- −$1,361
- − Management
- −$1,361
- − Depreciation
- −$727
- Taxable income
- $11,261
- Est. tax owed @ 24.0%
- −$2,703
- After-tax cash flow
- $8,262/yr
For passive investors: Depreciation is non-cash, so a rental often shows a tax loss while cash-flowing — sheltering income. Rental losses are passive: they offset passive income freely, and up to $25,000/yr can offset ordinary (W-2) income if you actively participate and your MAGI is under $100k (phasing out to $0 by $150k); unused losses carry forward. On sale, claimed depreciation is recaptured at up to 25%, and gains may owe capital-gains tax (a 1031 exchange can defer both). Figures are a year-1 estimate at your 24.0% rate — not tax advice; consult a CPA.
Schools (NCES district)
- District
- Shenandoah Valley SD
- NCES district ID
- 4221490
- Math proficiency
- 20% ▼ -8.00%
- Reading proficiency
- 38% ▼ -6.00%
- Median HH income
- $31,968
- Composite
- 23.58/100
- National rank
- #7851
- State rank
- #454 of 539 in PA
Livability — Shenandoah
- Score
- 71/100
- State rank
- #720
- US rank
- #7134
Category grades
Schools grade is shown separately in the Schools card above.
Census & demographics
- Census place
- Shenandoah, PA
- City population
- 5,988
- Population (ZIP)
- 5,988
Population outlook (Schuylkill County) Hauer SSP2
- Today (2025)
- 137,447 people
- By 2030
- 133,121 · -3.1%
- By 2040
- 124,172 · -9.7%
- By 2050
- 115,611 · -15.9%
- By 2075
- 100,796 · -26.7%
- By 2100
- 86,667 · -36.9%
Race, ethnicity, and origin ACS 2023
- Neighborhood character
- Majority White (63%)
- Race & ethnicity
- White 63% Hispanic / Latino 34% Two or more races 12% Black 2%
- Hispanic origin (detail)
- Mexican 10% Puerto Rican 8% Dominican 11%
- Common ancestry
- Romanian 20% Iranian 2% Scotch-Irish 2%
- Foreign-born
- 10% · Canada
- Languages at home
- 68% English-only · Spanish 30% Russian/Polish/Slavic 1%
Political lean MEDSL · Schuylkill
- 2024 margin
- Solid R (+42.1) · D 28.5% · R 70.6%
- 2008→2024 swing
- -33.4pp toward R · 2008: -8.7pp · 2024: -42.1pp
- All cycles
- 2024: R+42.1 2020: R+39.9 2016: R+43.4 2012: R+13.4 2008: R+8.7
Not yet ingested
- Civics
- —
Market trends
- HPI YoY
- ▲ 3.84%
- Current HPI
- 308.8036
- Rent YoY
- —
- Metro
- —
- State GDP YoY
- ▲ 1.68%
- F500 in state
- 34
Industry mix (Fortune 500 HQ in PA)
| Industry | F500 HQs | Revenue |
|---|---|---|
| Healthcare | 2 | $309B |
|
||
| Insurance | 2 | $27B |
|
||
| Telecommunications / Media | 1 | $124B |
|
||
| Industrial Distribution | 1 | $22B |
|
||
| Financial Services | 1 | $20B |
|
||
| Chemicals / Materials | 1 | $18B |
|
||
Price history
+100.0% since first listed11 events — show timeline
- 2026-05-02 Listed $25,000 LCAR
- 2026-04-10 Sold (MLS) $26,000 LCAR
- 2026-04-03 Pending — LCAR
- 2026-03-20 Price Changed $29,000 LCAR
- 2026-03-02 Listed $35,000 LCAR
- 2026-02-16 Sold (MLS) $20,000 BRIGHT MLS
- 2026-02-01 Pending — BRIGHT MLS
- 2026-02-01 Contingent — BRIGHT MLS
- 2026-01-29 Listed $14,900 BRIGHT MLS
- 2026-01-27 Coming Soon $14,900 BRIGHT MLS
- 2006-07-06 Sold (Public Records) $12,500 Public Records
Property tax history
+1.1%/yrLatest (2025): $779 · +3.3% YoY. Source: county tax records.
Cash-flow waterfall
monthlySold comps — $/sqft
last 12 mo · ≤1 miLoading sold comps…