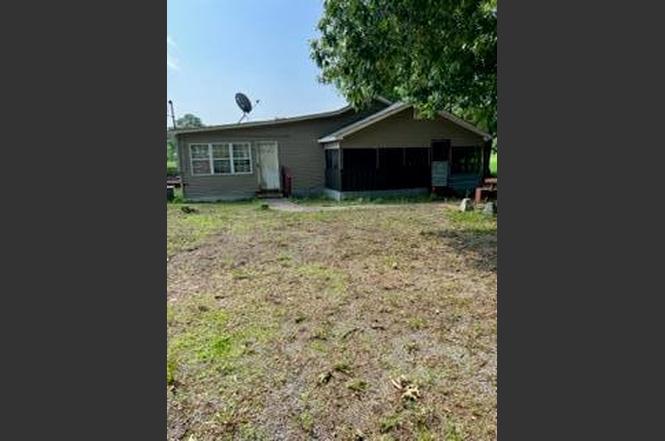
126/146 Cuble Rd · Birdsong, AR
Flood risk No data
- FEMA flood zone
- —
- Chance of flooding over 30 yrs
- —
- Est. flood insurance / yr
- —
Fire risk No data
- Est. fire insurance / yr
- —
Heat risk No data
- Hot days now (above threshold)
- —
- Hot days in 30 yrs
- —
Wind risk No data
- Chance of severe wind over 30 yrs
- —
Air-quality risk No data
- Unhealthy air days now
- —
- Unhealthy air days in 30 yrs
- —
Risk factors via First Street. Map © Google.
Why this score? — see what drove the B grade
The composite is a weighted blend of 9 inputs, each scored 0–100. Each bar is that input's sub-score; the figure is the points it added to the 100-point composite (weight × sub-score).
- Cash flow +30.0/30.0
- 1% rule +10.0/10.0
- DSCR +10.0/10.0
- ARV discount +7.5/15.0
- Appreciation +5.0/10.0
- Schools +2.8/10.0
- Rent growth +2.5/5.0
- Condition / age +2.5/5.0
- Livability +1.8/5.0
$35,000
🖨 Deal sheet (PDF) 📄 Offer letter ✓ Due diligence
Listing remarks
Sold as is!!! Could be rehabbed 2 homes & lot located in small community, only minutes from I40 North & 555.
Key facts
- I40 north
- Small community
- 0.82 acre lot
Tags
Neighborhood map
What this means for you Summary
Snapshot
- This is a 1-bed/1.0-bath single-family listed at $35k.
Deal economics
- At list price, monthly cash flow is $540 ($6k/yr) — positive.
- The deal already cash-flows at list — no discount required.
- Meets the 1% rule at list price ($990 rent vs $35k).
- Recommended offer: $31k (12.0% below list) — sets the bar for market timing.
Location & tenants
- Location reads 35/100 on livability (#539 in AR) — a limited-amenity area; tenant pool skews transient or value-seeking. Strengths: cost of living A+, crime A; Watch: schools F, amenities F, commute F.
- Rivercrest School District #57 (rural): math 32% / reading 37% proficiency, ranked #128 of 238 in AR (top 54%) — families likely to look elsewhere, expect single-tenant / working-renter base with shorter leases; 68% free/reduced lunch — lower-income household profile, screen leases tightly.
- Market conditions: 6 active listings in the ZIP; 69 units permitted in Mississippi County in 2024 (0 in 5+ unit buildings).
Forward outlook
- In year one you build about $1k of equity ($242 loan paydown + $1k appreciation (3.0% local appreciation)).
- Mississippi County population projected at -30% by 2050 — secular population decline; favor cash flow + early exit over multi-decade hold.
- At projected returns (3.0% appreciation + 3.0% rent growth), your $10k cash investment doubles in ~2 years — after that, you're playing with house money.
Negotiation context
- It's been on market 199 days — a 12% lower offer ($31k) is reasonable based on typical stale-listing flexibility.
Questions for the listing agent
- It's been on market 199 days. Have you received any prior offers? Is the seller open to a 12% concession, seller financing, or rate buy-down credit?
- Why hasn't it sold? Are there any deal-killer items the seller is aware of (foundation, flood, title, zoning, code violations)?
- Is there a deadline driving the sale (1031 exchange, divorce, estate, relocation)? That informs how much negotiation room exists.
- Schools are F-rated, which usually means shorter tenancies and higher turnover. Who's the typical renter profile here, and what's been the actual vacancy rate?
- What's the average days-on-market for RENTAL listings here right now (not sales)? A rising rental-DOM trend means longer vacancies and softer asking-rent achievability than the comps imply.
- What's the recent tenant-quality profile in this submarket — average credit score on applications, eviction rate, late-payment / NSF rate, and stable-employment percentage? A property-management company in the area should have these aggregated.
- How much new for-sale + rental construction is in the pipeline within 1–3 miles? Heavy new supply typically softens prices + rents 12–24 months out; constrained supply supports both.
Investment metrics
- 1% rule
- 2.83% ✓
- Cap rate
- 24.80%
- Cash-on-cash
- 66.11%
- DSCR
- 3.94
- GRM
- 2.9
CMA / ARV
No comps found within radius.
Projected returns pro-forma
3.0% appreciation · 3.0% rent growth · sell at horizon
- IRR
- 70.8%
- Equity multiple
- 4.94×
- Total profit
- $38,617
- Equity at exit
- $15,738
- IRR
- 70.4%
- Equity multiple
- 10.11×
- Total profit
- $89,308
- Equity at exit
- $24,253
Cash invested: $9,800 (down + closing). Projections, not guarantees.
Landlord ↔ Tenant lean methodology
- Overall (STATE)
- 92 Strongly Landlord-Friendly
- State Arkansas
- 92 Strongly Landlord-Friendly · R+14
- County
- — inherits STATE
- City
- — inherits STATE
ZIP-level market 72386
- Active inventory
- 6
- Price-to-rent
- 2.9×
Monthly cashflow live
- Estimated rent
- $990 medium interval (Pro) →
- Mortgage (P&I)
- −$184
- Tax est. 1.5%
- −$44 /mo · $525/yr
- Insurance
- −$15
- HOA
- −$0
- Vacancy / Maint / Mgmt
- −$208
- Net cashflow
- $540
Break-even live
Sensitivity live
| Price | -10% $564 | -5% $552 | +0% $540 | +5% $528 | +10% $516 |
|---|---|---|---|---|---|
| Rent | -10% $462 | -5% $501 | +0% $540 | +5% $579 | +10% $618 |
| Rate | -1.0pp $558 | -0.5pp $549 | base $540 | +0.5pp $531 | +1.0pp $522 |
UW: 25.0% down · 7.5% · 30yr · 1.5% tax · 5.0% vac · 8.0% maint · 8.0% mgmt
Financing live
Cash to close
- Down payment
- $8,750
- Closing costs
- $1,050
- Reserves months
- —
- Total cash needed
- —
Loan-product check · same deal, 3 products live
Conventional
25% down · 7.5% · 30yr
- Down + closing
- —
- Monthly P&I
- —
- Monthly cashflow
- —
- DSCR
- —
- Eligible?
- —
Personal DTI + credit; lowest rate.
DSCR
20% down · 8.5% · 30yr
- Down + closing
- —
- Monthly P&I
- —
- Monthly cashflow
- —
- DSCR
- —
- Eligible?
- —
No personal income docs; deal must DSCR.
Hard money
10% down · 12.0% · 12mo
- Down + closing
- —
- Monthly P&I
- —
- Monthly cashflow
- —
- DSCR
- —
- Eligible?
- —
Short-term bridge; refi at stabilization.
Listing history 3 events
-
2024-12-07status Pending
-
2024-09-30price $35,000
-
2024-05-22$45,000 Active
ⓘ Source: listings_history table (triggers on properties + properties_extension) + one-shot
backfill from property_details.listing_events for pre-trigger history.
Nearby sold comps map
Loading sold comps map…
Walkable amenities ~0.75 mi
Loading nearby amenities…
Taxation est. · year 1
- Rental income
- $11,875
- − Mortgage interest
- −$1,961
- − Property taxes
- −$525
- − Insurance
- −$175
- − Repairs & maintenance
- −$950
- − Management
- −$950
- − Depreciation
- −$1,018
- Taxable income
- $6,296
- Est. tax owed @ 24.0%
- −$1,511
- After-tax cash flow
- $4,968/yr
For passive investors: Depreciation is non-cash, so a rental often shows a tax loss while cash-flowing — sheltering income. Rental losses are passive: they offset passive income freely, and up to $25,000/yr can offset ordinary (W-2) income if you actively participate and your MAGI is under $100k (phasing out to $0 by $150k); unused losses carry forward. On sale, claimed depreciation is recaptured at up to 25%, and gains may owe capital-gains tax (a 1031 exchange can defer both). Figures are a year-1 estimate at your 24.0% rate — not tax advice; consult a CPA.
Schools (NCES district)
- District
- Rivercrest School District #57
- NCES district ID
- 0500045
- Math proficiency
- 32% ▼ -3.00%
- Reading proficiency
- 37% ▬ 0.00%
- Median HH income
- $34,115
- Composite
- 28.4/100
- National rank
- #6764
- State rank
- #128 of 238 in AR
Livability — Birdsong
- Score
- 35/100
- State rank
- #539
- US rank
- #27730
Category grades
Schools grade is shown separately in the Schools card above.
Census & demographics
- Census place
- Birdsong, AR
- Population (ZIP)
- 1,385
Population outlook (Mississippi County) Hauer SSP2
- Today (2025)
- 38,959 people
- By 2030
- 36,401 · -6.6%
- By 2040
- 31,526 · -19.1%
- By 2050
- 27,058 · -30.5%
- By 2075
- 17,847 · -54.2%
- By 2100
- 11,024 · -71.7%
Race, ethnicity, and origin ACS 2023
- Neighborhood character
- Predominantly White (90%)
- Race & ethnicity
- White 90% Two or more races 6% Black 4%
- Common ancestry
- Lithuanian 2% Slovak 1% Serbian 1%
- Foreign-born
- 1% · Canada
- Languages at home
- 99% English-only · Spanish 1%
Political lean MEDSL · Mississippi
- 2024 margin
- Solid R (+31.6) · D 33.4% · R 65.0% · Other 1.7%
- 2008→2024 swing
- -29.4pp toward R · 2008: -2.2pp · 2024: -31.6pp
- All cycles
- 2024: R+31.6 2020: R+22.2 2016: R+10.5 2012: R+1.1 2008: R+2.2
Not yet ingested
- Civics
- —
Market trends
- HPI YoY
- —
- Current HPI
- —
- Rent YoY
- —
- Metro
- —
- State GDP YoY
- ▲ 3.80%
- F500 in state
- 10
Industry mix (Fortune 500 HQ in AR)
| Industry | F500 HQs | Revenue |
|---|---|---|
| Retail | 1 | $681B |
|
||
| Food / Agriculture | 1 | $53B |
|
||
| Retail / Energy | 1 | $22B |
|
||
| Transportation / Logistics | 1 | $12B |
|
||
| Energy | 1 | $4B |
|
||
Price history
-22.2% since first listed3 events — show timeline
- 2024-12-07 Pending — EARA
- 2024-09-30 Price Changed $35,000 EARA
- 2024-05-22 Listed $45,000 EARA
Property tax history
+4.3%/yrLatest (2025): $35 · +4.3% YoY. Source: county tax records.
Cash-flow waterfall
monthlySold comps — $/sqft
last 12 mo · ≤1 miLoading sold comps…