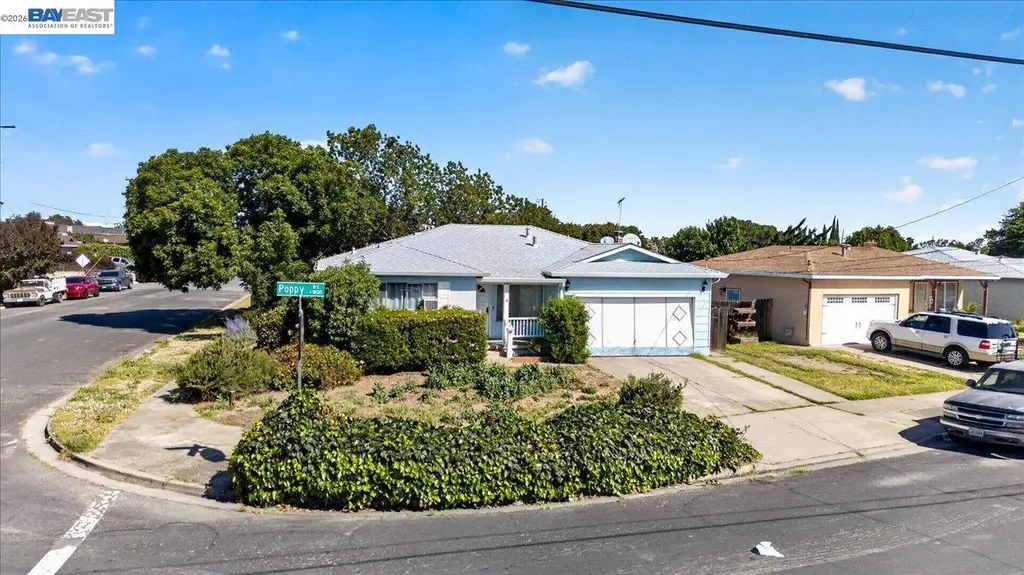
1712 Poppy Way · Antioch, CA
Flood risk 4/10 · Minor
- FEMA flood zone
- X (unshaded)
- Chance of flooding over 30 yrs
- 0.2%
- Est. flood insurance / yr
- $507 – $1,088
Fire risk 5/10 · Moderate
- Est. fire insurance / yr
- $659 – $1,223
Heat risk 6/10 · Moderate
- Hot days now (above 100°F)
- 7 days/yr
- Hot days in 30 yrs
- 14 days/yr
Wind risk 1/10 · Minimal
- Chance of severe wind over 30 yrs
- —
Air-quality risk 9/10 · Severe
- Unhealthy air days now
- 16 days/yr
- Unhealthy air days in 30 yrs
- 19 days/yr
Risk factors via First Street. Map © Google.
Why this score? — see what drove the D+ grade
The composite is a weighted blend of 9 inputs, each scored 0–100. Each bar is that input's sub-score; the figure is the points it added to the 100-point composite (weight × sub-score).
- ARV discount +15.0/15.0
- Cash flow +14.0/30.0
- DSCR +4.2/10.0
- Schools +3.8/10.0
- 1% rule +3.4/10.0
- Rent growth +2.8/5.0
- Livability +2.8/5.0
- Condition / age +2.5/5.0
- Appreciation +0.0/10.0
$300,000
🖨 Deal sheet 📄 Offer letter ✓ Due diligence
Listing remarks
Fixer-upper located in the heart of Antioch is a canvas ready for your home renovation design. This is a prime opportunity to bring your creative vision to life. Features a functional layout with ample living space with 3 bed and 2 bath Good family room space and open kitchen. Corner lot with lots of opportunity. Situated in prime location just minutes from local shopping, and freeway access. Great investment opportunity!
Key facts
- 6,660 sq ft lot
- 2 garage spots
- Built 1964
Property features AI
Exterior
- Parking: Attached garage with 2 covered spaces (2 garage spaces)
- Utilities: Public water; Public sewer
- Home design: Single family residence; Residential property; Built in 1964
- Construction: Stucco construction
- Exterior features: Front yard; Back yard; Shingle roof
Interior
- Kitchen: Electric range / cooktop
- Bedrooms: 3 bedrooms (street level)
- Flooring: Laminate flooring
- Bathrooms: 2 full bathrooms
- Heating & cooling: Forced air heating; Central air conditioning
- Interior features: No additional rooms; Brick fireplace
- Laundry & utility: Laundry in garage
Neighborhood map
What this means for you Summary
Snapshot
- This is a 3-bed/2.0-bath single-family listed at $300k.
Deal economics
- At list price, monthly cash flow is $36 ($438/yr) — positive.
- The deal already cash-flows at list — no discount required.
- To meet the 1% rule (rent ≥ 1% of price), the offer needs to be $252k (15.9% below list).
- Recommended offer: $252k (15.9% below list) — sets the bar for 1% rule.
- Cap rate 6.4% vs local median 3.9% in Antioch — top-decile yield for the area; either an underpriced asset or a hidden risk that comps aren't pricing in. Stress-test before assuming the spread holds.
Location & tenants
- Location reads 56/100 on livability (#782 in CA) — a working-class tenant base; expect higher turnover. Strengths: employment A+, housing A+, health & safety A; Watch: schools F, crime F, amenities F.
- Antioch Unified (suburban): math 29% / reading 55% proficiency, ranked #200 of 517 in CA (top 39%) — families likely to look elsewhere, expect single-tenant / working-renter base with shorter leases.
- Market conditions: Rents rising (+1.1%/yr); 206 active listings in the ZIP; 40 comparable units currently listed for rent nearby; rentals at typical pace (median 25d on market — plan ~3-4 weeks tenant-placement turnaround); 48% of comp listings sitting > 30 days — soft ceiling on asking rent; solid renter incomes; 2,169 units permitted in Contra Costa County in 2024 (896 in 5+ unit buildings).
- This rent runs 35% of the median local income ($86k/yr) — at the standard rent-burdened threshold; future hikes will face affordability resistance.
Forward outlook
- Local home prices are declining (-3.0%/yr); year-one equity from $2k of loan paydown is wiped out by about $9k of value loss. Plan a longer hold.
- Contra Costa County population projected at +26% by 2050 — long-run rental-demand tailwind backs the buy-and-hold thesis.
Negotiation context
- Only 12 days on market — expect competitive offers; lowballing is unlikely to land.
- Current owner paid $130k; list at $300k implies a 132% gain — meaningful room to come down on a strong offer.
Risks & watch-outs
- Climate carrying-cost: moderate wildfire risk; extreme-heat days projected 7→14/yr by 2055 (HVAC capex compounding) — expect insurance premiums to compound above CPI over the hold.
Questions for the listing agent
- Built in 1964 — when were the roof, HVAC, electrical panel, plumbing, and water heater last replaced?
- Is there a deadline driving the sale (1031 exchange, divorce, estate, relocation)? That informs how much negotiation room exists.
- Schools are F-rated, which usually means shorter tenancies and higher turnover. Who's the typical renter profile here, and what's been the actual vacancy rate?
- Crime grade is F in this area — have there been break-ins, vandalism, or insurance claims at this property in the last 3 years? What carrier currently insures it and at what premium?
- The area grade is low — what's the realistic commute time and amenity access for the typical tenant pool here? Any planned neighborhood developments (good or bad) we should know about?
- What's the average days-on-market for RENTAL listings here right now (not sales)? A rising rental-DOM trend means longer vacancies and softer asking-rent achievability than the comps imply.
- What's the recent tenant-quality profile in this submarket — average credit score on applications, eviction rate, late-payment / NSF rate, and stable-employment percentage? A property-management company in the area should have these aggregated.
- How much new for-sale + rental construction is in the pipeline within 1–3 miles? Heavy new supply typically softens prices + rents 12–24 months out; constrained supply supports both.
Investment metrics
- 1% rule
- 0.84% ✗
- Cap rate
- 6.44%
- Cash-on-cash
- 0.52%
- DSCR
- 1.02
- GRM
- 9.9
CMA / ARV
- ARV (on-the-fly)
- $503,064
- Comps found
- 12
Show comp detail 12 sales within ~0.75 mi
| Address | Dist | Beds/Ba | Sqft | Sold | Price | $/sf | Match |
|---|---|---|---|---|---|---|---|
| 1708 Crestview Dr | 0.05mi | 3/2.0 | 1,197 (-2%) | 1mo | $510,000 | $426 | 94 |
| 1405 Tulip Dr | 0.12mi | 3/2.0 | 1,344 (+10%) | 4mo | $520,000 | $387 | 75 |
| 2705 Adobe Ct | 0.58mi | 4/2.0 (+1) | 1,289 (+5%) | 1mo | $525,000 | $407 | 59 |
| 1745 San Jose Dr | 0.59mi | 3/2.0 | 1,302 (+6%) | 4mo | $555,000 | $426 | 59 |
| 1746 San Jose Dr | 0.58mi | 3/2.0 | 1,302 (+6%) | 5mo | $525,000 | $403 | 58 |
| 2709 Cabrillo Ct | 0.67mi | 3/2.0 | 1,302 (+6%) | 2mo | $555,000 | $426 | 56 |
| 2788 Entrada Cir | 0.61mi | 3/2.0 | 1,302 (+6%) | 7mo | $540,000 | $415 | 56 |
| 2725 Entrada Cir | 0.67mi | 3/2.0 | 1,302 (+6%) | 3mo | $535,000 | $411 | 55 |
| 2737 Barcelona Cir | 0.67mi | 3/2.0 | 1,302 (+6%) | 5mo | $500,000 | $384 | 54 |
| 2101 L St | 0.63mi | 3/2.0 | 1,322 (+8%) | 4mo | $388,000 | $293 | 54 |
| 1143 Cook St | 0.70mi | 3/2.0 | 1,065 (-13%) | 2mo | $470,000 | $441 | 44 |
| 1216 W 7th St | 0.57mi | 3/1.0 | 1,053 (-14%) | 7mo | $415,000 | $394 | 40 |
Match score weights: distance 35% · size 25% · config 20% · recency 20%. Top-matched comps best support the ARV.
Projected returns pro-forma
-3.0% appreciation · 1.09% rent growth · sell at horizon
- IRR
- -17.5%
- Equity multiple
- 0.39×
- Total profit
- $-51,083
- Equity at exit
- $44,731
- IRR
- -13.4%
- Equity multiple
- 0.28×
- Total profit
- $-60,423
- Equity at exit
- $25,939
Cash invested: $84,000 (down + closing). Projections, not guarantees.
Landlord ↔ Tenant lean methodology
- Overall (STATE)
- 18 Strongly Tenant-Friendly
- State California
- 18 Strongly Tenant-Friendly · D+13
- County
- — inherits STATE
- City
- — inherits STATE
ZIP-level market 94509
- Rents YoY
- 1.1%
- Active inventory
- 206
- Price-to-rent
- 9.9×
Monthly cashflow live
- Estimated rent
- $2,524 high interval (Pro) →
- Mortgage (P&I)
- −$1,573
- Tax from tax record
- −$259 /mo · $3,109/yr
- Insurance
- −$125
- HOA
- −$0
- Vacancy / Maint / Mgmt
- −$530
- Net cashflow
- $36
Break-even live
UW: 25.0% down · 7.5% · 30yr · 1.5% tax · 5.0% vac · 8.0% maint · 8.0% mgmt
Financing live
Cash to close
- Down payment
- $75,000
- Closing costs
- $9,000
- Reserves months
- —
- Total cash needed
- —
Loan-product check · same deal, 3 products live
Conventional
25% down · 7.5% · 30yr
- Down + closing
- —
- Monthly P&I
- —
- Monthly cashflow
- —
- DSCR
- —
- Eligible?
- —
Personal DTI + credit; lowest rate.
DSCR
20% down · 8.5% · 30yr
- Down + closing
- —
- Monthly P&I
- —
- Monthly cashflow
- —
- DSCR
- —
- Eligible?
- —
No personal income docs; deal must DSCR.
Hard money
10% down · 12.0% · 12mo
- Down + closing
- —
- Monthly P&I
- —
- Monthly cashflow
- —
- DSCR
- —
- Eligible?
- —
Short-term bridge; refi at stabilization.
Rent comps 40 comps
| Address | Beds | Baths | Sqft | Rent | $/sqft | DOM | Units | Dist |
|---|---|---|---|---|---|---|---|---|
| 1508 Crestview Dr Antioch, CA | 3.0 | 2.0 | 1197 | $2,949 | $2.46 | 43d | 1 | 0.11mi |
| 2200 Sycamore Dr Antioch, CA | 2.0 | 1.0–2.0 | 777 | $1,917 | $2.47 | 2d | 12 | 0.12mi |
| 2200 Sycamore Dr Antioch, CA | 2.0 | 1.0 | 755 | $1,815 | $2.40 | 10d | 1 | 0.12mi |
| 1209 Tulip Dr Antioch, CA | 3.0 | 2.0 | 1344 | $2,995 | $2.23 | 43d | 1 | 0.20mi |
| 2301 Sycamore Dr Antioch, CA | 1.0–2.0 | 1.0–1.5 | 716 | $2,180 | $3.04 | 1d | 22 | 0.23mi |
| 1600 Aster Dr Antioch, CA | 1.0–3.0 | 1.0–2.0 | 838 | $3,069 | $3.66 | 1d | 8 | 0.25mi |
| 1461 Aster Dr Antioch, CA | 2.0 | 1.0 | 900 | $1,795 | $1.99 | 24d | 1 | 0.26mi |
| 1461 Aster Dr Antioch, CA | 2.0 | 1.0 | 900 | $1,795 | $1.99 | 43d | 1 | 0.26mi |
| 2201 Sycamore Dr Antioch, CA | 1.0–3.0 | 1.0–2.0 | 1015 | $2,400 | $2.36 | 1d | 10 | 0.27mi |
| 1608 Sycamore Dr Apt 2 Antioch, CA | 2.0 | 1.0 | 900 | $2,150 | $2.39 | 5d | 1 | 0.29mi |
| 2112 Banyan Way Antioch, CA | 3.0 | 2.0 | 1154 | $2,900 | $2.51 | 43d | 1 | 0.33mi |
| 2202 Banyan Way Antioch, CA | 4.0 | 2.5 | 1487 | $3,500 | $2.35 | 43d | 1 | 0.35mi |
| 2221 Dogwood Way Antioch, CA | 3.0 | 2.0 | 1154 | $2,995 | $2.60 | 43d | 1 | 0.36mi |
| 2400 Horizon Ln #140 Antioch, CA | 2.0 | 1.0 | 845 | $1,850 | $2.19 | 43d | 1 | 0.38mi |
| 2415 Horizon Ln #129 Antioch, CA | 2.0 | 2.0 | 944 | $2,800 | $2.97 | 43d | 1 | 0.40mi |
| 2005 San Jose Dr Antioch, CA | 2.0 | 2.0 | 830 | $1,850 | $2.23 | 44d | 1 | 0.45mi |
| 1902 San Jose Dr Antioch, CA | 3.0 | 2.0 | 1152 | $3,100 | $2.69 | 43d | 1 | 0.47mi |
| 712 O St Antioch, CA | 2.0 | 1.0 | 860 | $1,822 | $2.12 | 10d | 1 | 0.47mi |
| 2005 San Jose Dr #241 Antioch, CA | 2.0 | 1.5 | 782 | $1,900 | $2.43 | 5d | 1 | 0.48mi |
| 2104 Lemontree Way Antioch, CA | 2.0 | 1.0 | 822 | $1,695 | $2.06 | 43d | 1 | 0.49mi |
| 2005 San Jose Dr Unit F130 Antioch, CA | 2.0 | 2.0 | 830 | $1,795 | $2.16 | 5d | 1 | 0.49mi |
| 2201 San Jose Dr Antioch, CA | 1.0–2.0 | 1.0–2.0 | 686 | $2,437 | $3.55 | 1d | 8 | 0.52mi |
| 2106 Peppertree Way #3 Antioch, CA | 2.0 | 1.0 | 903 | $2,311 | $2.56 | 43d | 1 | 0.55mi |
| 2106 Peppertree Way Antioch, CA | 2.0 | 1.0 | 903 | $2,311 | $2.56 | 5d | 1 | 0.55mi |
| 2308 Lemontree Way #4 Antioch, CA | 2.0 | 1.0 | 925 | $1,695 | $1.83 | 43d | 1 | 0.55mi |
| 2608 Nevada Ln Antioch, CA | 3.0 | 1.5 | 1056 | $2,450 | $2.32 | 43d | 1 | 0.57mi |
| 2500 Florida Ln Antioch, CA | 2.0 | 1.0 | 1000 | $2,395 | $2.40 | 43d | 1 | 0.58mi |
| 2205 Peppertree Way Antioch, CA | 2.0 | 1.0 | 903 | $1,695 | $1.88 | 15d | 1 | 0.60mi |
| 2725 Entrada Cir Antioch, CA | 3.0 | 2.0 | 1302 | $2,000 | $1.54 | 18d | 1 | 0.65mi |
| 1108 W 5th St Unit 2 Antioch, CA | 2.0 | 1.0 | 846 | $1,750 | $2.07 | 22d | 1 | 0.72mi |
| 1002 W 4th St Antioch, CA | 2.0 | 1.0 | 1000 | $2,495 | $2.50 | 43d | 1 | 0.81mi |
| 1017 H St Antioch, CA | 2.0 | 1.0 | 825 | $1,950 | $2.36 | 24d | 1 | 0.86mi |
| 1015 Fitzuren Rd Unit 2 Antioch, CA | 2.0 | 2.0 | 1035 | $2,500 | $2.42 | 43d | 1 | 0.87mi |
| 1015 Fitzuren Rd Unit 18 Antioch, CA | 2.0 | 2.0 | 1034 | $2,800 | $2.71 | 43d | 1 | 0.87mi |
| 1312 Mission Dr Antioch, CA | 3.0 | 2.0 | 1440 | $2,975 | $2.07 | 4d | 1 | 0.88mi |
| 618 W 7th St Unit 8 Antioch, CA | 2.0 | 1.0 | 1150 | $2,095 | $1.82 | 22d | 1 | 0.91mi |
| 618 W 7th St Unit 2 Antioch, CA | 2.0 | 1.0 | 1150 | $1,995 | $1.73 | 5d | 1 | 0.91mi |
| 3601 Fairview Dr Antioch, CA | 2.0 | 1.0 | 800 | $1,693 | $2.12 | 12d | 1 | 0.94mi |
| 3521 Fairview Dr Apt B Antioch, CA | 2.0 | 1.0 | 827 | $2,000 | $2.42 | 43d | 1 | 0.95mi |
| 2811 Cadiz Ln Antioch, CA | 1.0–2.0 | 1.0 | 715 | $1,962 | $2.74 | 22d | 1 | 0.95mi |
Listing history 9 events
-
2026-06-04status $300,000 Pending 12 DOM
-
2026-06-03days on market $300,000 Active 12 DOM
-
2026-06-02days on market $300,000 Active 11 DOM
-
2026-06-01days on market $300,000 Active 10 DOM
-
2026-05-31days on market $300,000 Active 9 DOM
-
2026-05-20historical $300,000
-
1991-04-30soldstatus $129,500
-
1978-01-20soldstatus $48,500
-
1978-01-01soldstatus $48,500
ⓘ Source: listings_history table (triggers on properties + properties_extension) + one-shot
backfill from property_details.listing_events for pre-trigger history.
Tax reassessment forecast CA · Resets to sale price
- Current annual tax
- $3,109 · $259/mo
- Projected year-2 tax
- $3,109 · $259/mo
- Expected delta
- $0/yr ($0/mo · 0.0%)
ⓘ Screening estimate from a state-policy table — verify with the county assessor before closing.
Climate risk First Street
- Flood 4/10 Moderate FEMA zone X (unshaded) · 20% chance over 30 yrs
- Wildfire 5/10 Major
- Heat 6/10 Major 7 d/yr ≥100°F today · 14 d/yr by 30 yrs out
- Wind 1/10 Low
- Air quality 9/10 Extreme 16 unhealthy d/yr today · 19 by 30 yrs out
Nearby sold comps map
Loading sold comps map…
Walkable amenities ~0.75 mi
Loading nearby amenities…
Taxation est. · year 1
- Rental income
- $30,285
- − Mortgage interest
- −$16,805
- − Property taxes
- −$3,109
- − Insurance
- −$1,500
- − Repairs & maintenance
- −$2,423
- − Management
- −$2,423
- − Depreciation
- −$8,727
- Taxable loss
- −$4,701
- Est. tax savings @ 24.0%
- +$1,128
- After-tax cash flow
- $1,566/yr
For passive investors: Depreciation is non-cash, so a rental often shows a tax loss while cash-flowing — sheltering income. Rental losses are passive: they offset passive income freely, and up to $25,000/yr can offset ordinary (W-2) income if you actively participate and your MAGI is under $100k (phasing out to $0 by $150k); unused losses carry forward. On sale, claimed depreciation is recaptured at up to 25%, and gains may owe capital-gains tax (a 1031 exchange can defer both). Figures are a year-1 estimate at your 24.0% rate — not tax advice; consult a CPA.
Schools (NCES district)
- District
- Antioch Unified
- NCES district ID
- 0602850
- Math proficiency
- 29% ▲ 12.00%
- Reading proficiency
- 55% ▲ 25.00%
- Median HH income
- $65,935
- Composite
- 37.57/100
- National rank
- #4386
- State rank
- #200 of 517 in CA
Livability — Antioch
- Score
- 56/100
- State rank
- #782
- US rank
- #22472
Category grades
Schools grade is shown separately in the Schools card above.
Census & demographics
- Census place
- Antioch, CA
- County
- Contra Costa County · 1,059,880 people
- City population
- 116,477
- Metro
- San Francisco-Oakland-Berkeley, CA
- Population (ZIP)
- 70,090
- Household income
- $86,196
- Rent vs Own
- Severe rent burden
- 3063.0
Population outlook (Contra Costa County) Hauer SSP2
- Today (2025)
- 1,287,720 people
- By 2030
- 1,364,937 · +6.0%
- By 2040
- 1,506,209 · +17.0%
- By 2050
- 1,624,373 · +26.1%
- By 2075
- 1,853,193 · +43.9%
- By 2100
- 1,901,231 · +47.6%
Race, ethnicity, and origin ACS 2023
- Neighborhood character
- Highly diverse neighborhood (Simpson 0.72)
- Race & ethnicity
- Hispanic / Latino 43% White 25% Two or more races 18% Black 16% Asian 9% Native American 2% Pacific Islander 2%
- Hispanic origin (detail)
- Mexican 30%
- Common ancestry
- Russian 2% Italian 2% Lithuanian 1%
- Foreign-born
- 23% · Canada, China, Vietnam
- Languages at home
- 62% English-only · Spanish 29% Tagalog/Filipino 3% Other Asian/Pacific 1%
Political lean MEDSL · Contra Costa
- 2024 margin
- Solid D (+38.0) · D 67.3% · R 29.4% · Other 3.3%
- 2008→2024 swing
- +0.2pp no change · 2008: 37.8pp · 2024: 38.0pp
- All cycles
- 2024: D+38.0 2020: D+45.3 2016: D+43.5 2012: D+33.7 2008: D+37.8
Not yet ingested
- Civics
- —
Market trends
- HPI YoY
- ▼ -477.30%
- Current HPI
- 309.3499
- Rent YoY
- ▲ 1.09%
- Metro
- San Francisco-Oakland-Berkeley, CA
- State GDP YoY
- ▲ 3.21%
- F500 in state
- 116
Industry mix (Fortune 500 HQ in CA)
| Industry | F500 HQs | Revenue |
|---|---|---|
| Technology | 27 | $1,492B |
|
||
| Financial Services | 3 | $174B |
|
||
| Retail | 3 | $44B |
|
||
| Insurance | 3 | $26B |
|
||
| Media / Entertainment | 2 | $115B |
|
||
| Pharmaceuticals / Biotech | 2 | $62B |
|
||
Price history
+518.6% since first listed4 events — show timeline
- 2026-05-20 Coming Soon $300,000 bridgeMLS, Bay East AOR, or Contra Costa AOR
- 1991-04-30 Sold (Public Records) $129,500 Public Records
- 1978-01-20 Sold (Public Records) $48,500 Public Records
- 1978-01-01 Sold (Public Records) $48,500 Public Records
Property tax history
+2.6%/yrLatest (2025): $3,109 · +3.0% YoY. Source: county tax records.
Cash-flow waterfall
monthlySold comps — $/sqft
last 12 mo · ≤1 miLoading sold comps…