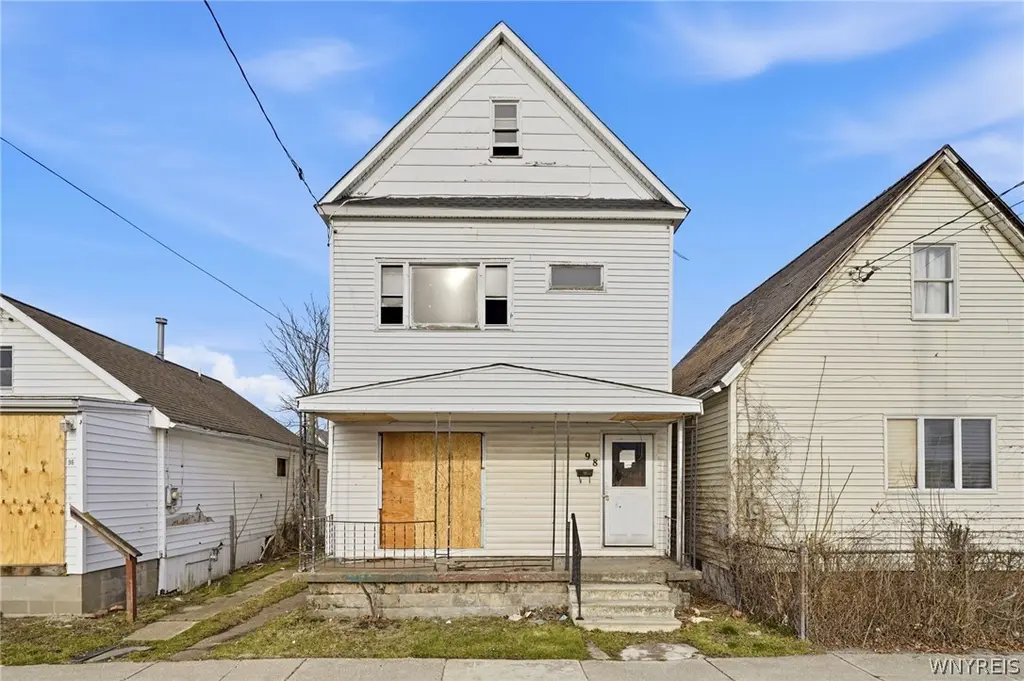
98 Tennessee St · Buffalo, NY
Flood risk 8/10 · Major
- FEMA flood zone
- X (unshaded)
- Chance of flooding over 30 yrs
- 0.97%
- Est. flood insurance / yr
- $507 – $1,088
Fire risk 1/10 · Minimal
- Est. fire insurance / yr
- $691 – $1,283
Heat risk 3/10 · Minor
- Hot days now (above 91°F)
- 7 days/yr
- Hot days in 30 yrs
- 15 days/yr
Wind risk 1/10 · Minimal
- Chance of severe wind over 30 yrs
- —
Air-quality risk 4/10 · Minor
- Unhealthy air days now
- 4 days/yr
- Unhealthy air days in 30 yrs
- 9 days/yr
Risk factors via First Street. Map © Google.
Why this score? — see what drove the B grade
The composite is a weighted blend of 9 inputs, each scored 0–100. Each bar is that input's sub-score; the figure is the points it added to the 100-point composite (weight × sub-score).
- Cash flow +30.0/30.0
- 1% rule +10.0/10.0
- DSCR +10.0/10.0
- ARV discount +7.5/15.0
- Rent growth +3.9/5.0
- Livability +3.9/5.0
- Appreciation +3.3/10.0
- Schools +3.3/10.0
- Condition / age +2.5/5.0
$59,000
🖨 Deal sheet 📄 Offer letter ✓ Due diligence
Listing remarks MLS
Don’t miss your chance to finish what’s already been started at 98 Tennessee Street. This property has been completely gutted to the studs and features a newer roof and framed interior, providing a solid head start for your next project. Located in the rapidly developing First Ward, just minutes from downtown, the waterfront, and Larkinville, this is a prime opportunity to add value in a sought-after area. Whether you’re planning a flip, rental, or custom home, the heavy lifting is done—just bring your finishing touches and bring this property back to life!
Key facts
- Newer roof
- Sought-after area
- Framed interior
Tags
Neighborhood map
What this means for you Summary
Snapshot
- This is a 3-bed/1.0-bath single-family listed at $59k.
Deal economics
- At list price, monthly cash flow is $2k ($18k/yr) — positive.
- The deal already cash-flows at list — no discount required.
- Meets the 1% rule at list price ($2k rent vs $59k).
- Recommended offer: $55k (6.0% below list) — sets the bar for market timing.
- Cap rate 38.2% vs local median 8.0% in Buffalo — top-decile yield for the area; either an underpriced asset or a hidden risk that comps aren't pricing in. Stress-test before assuming the spread holds.
Location & tenants
- Location reads 77/100 on livability (#195 in NY, #3,011 nationally) — a middle-class / working-renter tenant base. Strengths: commute A+, housing A+, health & safety A+; Watch: crime F, employment D-.
- Buffalo City School District (urban): math 41% / reading 40% proficiency, ranked #535 of 590 in NY (top 91%) — families likely to look elsewhere, expect single-tenant / working-renter base with shorter leases; 75% free/reduced lunch — lower-income household profile, screen leases tightly.
- Market conditions: Rents rising fast (+5.5%/yr); 33 active listings in the ZIP; 11 comparable units currently listed for rent nearby; rentals leasing fast (median 3d on market — plan ~1-2 weeks tenant-placement turnaround); lower-income renter base — watch delinquency; 1,244 units permitted in Erie County in 2024 (563 in 5+ unit buildings).
- At $2,433/mo this rent would consume 104% of the median local household income ($28k/yr) (locally 945% of renters already pay >50% of income on rent) — very limited rent-growth headroom before tenants either downsize or default.
Forward outlook
- Local home prices are declining (-3.0%/yr); year-one equity from $408 of loan paydown is wiped out by about $2k of value loss. Plan a longer hold.
- At projected returns (-3.0% appreciation + 5.5% rent growth), your $17k cash investment doubles in ~1 year — after that, you're playing with house money.
Negotiation context
- It's been on market 80 days — a 6% lower offer ($55k) is reasonable based on typical stale-listing flexibility.
- 8 sale attempts since 6y ago with the ask held roughly flat each time — persistent listings suggest the price (not the market) is what's stuck; bring a comps-based counter.
- Current owner paid $28k; list at $59k implies a 111% gain — meaningful room to come down on a strong offer.
Risks & watch-outs
- Watch-outs: flood insurance adds $66/mo; built in 1900 — expect roof / HVAC / electrical / plumbing capex.
- Climate carrying-cost: severe flood risk — expect insurance premiums to compound above CPI over the hold.
Questions for the listing agent
- It's been on market 80 days. Have you received any prior offers? Is the seller open to a 6% concession, seller financing, or rate buy-down credit?
- Built in 1900 — when were the roof, HVAC, electrical panel, plumbing, and water heater last replaced?
- What's the actual annual flood-insurance premium (NFIP or private), and is the property in a SFHA with mandatory coverage?
- Why hasn't it sold? Are there any deal-killer items the seller is aware of (foundation, flood, title, zoning, code violations)?
- Is there a deadline driving the sale (1031 exchange, divorce, estate, relocation)? That informs how much negotiation room exists.
- Crime grade is F in this area — have there been break-ins, vandalism, or insurance claims at this property in the last 3 years? What carrier currently insures it and at what premium?
- What's the average days-on-market for RENTAL listings here right now (not sales)? A rising rental-DOM trend means longer vacancies and softer asking-rent achievability than the comps imply.
- What's the recent tenant-quality profile in this submarket — average credit score on applications, eviction rate, late-payment / NSF rate, and stable-employment percentage? A property-management company in the area should have these aggregated.
- How much new for-sale + rental construction is in the pipeline within 1–3 miles? Heavy new supply typically softens prices + rents 12–24 months out; constrained supply supports both.
Investment metrics
- 1% rule
- 4.12% ✓
- Cap rate
- 38.22%
- Cash-on-cash
- 114.03%
- DSCR
- 6.07
- GRM
- 2.0
CMA / ARV
- ARV (median comp)
- $152,052
- List price
- $59,000
- Delta
- -61.20%
- Verdict
- UNDERPRICED
- Comps
- 20 within 1.0 mi
Show comp detail 5 sales within ~0.75 mi
| Address | Dist | Beds/Ba | Sqft | Sold | Price | $/sf | Match |
|---|---|---|---|---|---|---|---|
| 136 Tennessee St | 0.07mi | 3/1.0 | 1,196 (-10%) | 10mo | $75,000 | $63 | 72 |
| 161 Oconnell Ave | 0.21mi | 3/1.5 | 1,232 (-7%) | 16mo | $245,000 | $199 | 63 |
| 541 Perry St | 0.47mi | 3/1.0 | 1,367 (+3%) | 15mo | $72,500 | $53 | 60 |
| 530 Fulton St | 0.67mi | 3/1.5 | 1,484 (+12%) | 18mo | $115,000 | $77 | 32 |
| 404 Seneca St | 0.75mi | 3/1.5 | 1,461 (+10%) | 17mo | $245,000 | $168 | 32 |
Match score weights: distance 35% · size 25% · config 20% · recency 20%. Top-matched comps best support the ARV.
Projected returns pro-forma
-3.0% appreciation · 5.48% rent growth · sell at horizon
- IRR
- —
- Equity multiple
- 6.60×
- Total profit
- $92,451
- Equity at exit
- $8,797
- IRR
- —
- Equity multiple
- 14.97×
- Total profit
- $230,836
- Equity at exit
- $5,101
Cash invested: $16,520 (down + closing). Projections, not guarantees.
Landlord ↔ Tenant lean methodology
- Overall (STATE)
- 15 Strongly Tenant-Friendly
- State New York
- 15 Strongly Tenant-Friendly · D+10
- County
- — inherits STATE
- City
- — inherits STATE
ZIP-level market 14204
- Home prices YoY
- -1.1%
- Rents YoY
- 5.5%
- Active inventory
- 33
- Price-to-rent
- 2.0×
Monthly cashflow live
- Estimated rent
- $2,433 high interval (Pro) →
- Mortgage (P&I)
- −$309
- Tax from tax record
- −$19 /mo · $224/yr
- Insurance
- −$25
- Flood insurance flood zone
- −$66 /mo · $798/yr
- HOA
- −$0
- Vacancy / Maint / Mgmt
- −$511
- Net cashflow
- $1,503
Break-even live
UW: 25.0% down · 7.5% · 30yr · 1.5% tax · 5.0% vac · 8.0% maint · 8.0% mgmt
Financing live
Cash to close
- Down payment
- $14,750
- Closing costs
- $1,770
- Reserves months
- —
- Total cash needed
- —
Loan-product check · same deal, 3 products live
Conventional
25% down · 7.5% · 30yr
- Down + closing
- —
- Monthly P&I
- —
- Monthly cashflow
- —
- DSCR
- —
- Eligible?
- —
Personal DTI + credit; lowest rate.
DSCR
20% down · 8.5% · 30yr
- Down + closing
- —
- Monthly P&I
- —
- Monthly cashflow
- —
- DSCR
- —
- Eligible?
- —
No personal income docs; deal must DSCR.
Hard money
10% down · 12.0% · 12mo
- Down + closing
- —
- Monthly P&I
- —
- Monthly cashflow
- —
- DSCR
- —
- Eligible?
- —
Short-term bridge; refi at stabilization.
Rent comps 11 comps
| Address | Beds | Baths | Sqft | Rent | $/sqft | DOM | Units | Dist |
|---|---|---|---|---|---|---|---|---|
| 225 Louisiana St Buffalo, NY | 1.0–3.0 | 1.0–2.0 | 1164 | $2,653 | $2.28 | 1d | 7 | 0.07mi |
| 230 Scott St Buffalo, NY | 1.0–2.0 | 1.0–2.0 | 1285 | $2,325 | $1.81 | 1d | 4 | 0.52mi |
| 901 S Park Ave Unit Lower Buffalo, NY | 4.0 | 1.0 | 1729 | $1,600 | $0.93 | 23d | 1 | 0.79mi |
| 149 Swan St #404 Buffalo, NY | 2.0 | 2.0 | 1237 | $2,050 | $1.66 | 11d | 1 | 0.92mi |
| 149 Swan St #404 Buffalo, NY | 2.0 | 2.0 | 1237 | $2,100 | $1.70 | 23d | 1 | 0.92mi |
| 140 Seymour St Buffalo, NY | 2.0 | 1.0 | 1300 | $1,800 | $1.38 | 23d | 1 | 1.07mi |
| 140 Seymour St Unit First Floor Buffalo, NY | 2.0 | 1.0 | 1300 | $1,800 | $1.38 | 3d | 1 | 1.07mi |
| 237 Main St Buffalo, NY | 1.0–3.0 | 1.5–2.5 | 1608 | $4,035 | $2.51 | 1d | 9 | 1.07mi |
| 298 Main St Buffalo, NY | 2.0 | 2.0 | 1768 | $3,400 | $1.92 | 2d | 1 | 1.15mi |
| 130 Pearl St #304 Buffalo, NY | 2.0 | 1.0 | 1010 | $2,475 | $2.45 | 23d | 1 | 1.21mi |
| 465 Washington St Buffalo, NY | 1.0–2.0 | 1.0–2.0 | 1388 | $2,285 | $1.65 | 2d | 5 | 1.36mi |
Listing history 36 events
-
2026-06-18days on market $59,000 Active 80 DOM
-
2026-06-17days on market $59,000 Active 79 DOM
-
2026-06-16days on market $59,000 Active 78 DOM
-
2026-06-15days on market $59,000 Active 77 DOM
-
2026-06-13days on market $59,000 Active 75 DOM
-
2026-06-13days on market $59,000 Active 74 DOM
-
2026-06-10days on market $59,000 Active 72 DOM
-
2026-06-09days on market $59,000 Active 71 DOM
-
2026-06-08days on market $59,000 Active 70 DOM
-
2026-06-07days on market $59,000 Active 69 DOM
-
2026-06-03days on market $59,000 Active 65 DOM
-
2026-06-02days on market $59,000 Active 64 DOM
-
2026-06-01days on market $59,000 Active 63 DOM
-
2026-05-31days on market $59,000 Active 62 DOM
-
2026-03-30$59,000 Active 587-char remark
Show marketing remark (587 chars)
Don’t miss your chance to finish what’s already been started at 98 Tennessee Street. This property has been completely gutted to the studs and features a newer roof and framed interior, providing a solid head start for your next project. Located in the rapidly developing First Ward, just minutes from downtown, the waterfront, and Larkinville, this is a prime opportunity to add value in a sought-after area. Whether you’re planning a flip, rental, or custom home, the heavy lifting is done—just bring your finishing touches and bring this property back to life!
-
2026-03-29historical
-
2025-08-21price $59,000
-
2025-05-16$70,000 Active
-
2022-10-07soldstatus $28,000 Closed Sale or Rented
-
2022-08-21status Under Contract- Do Not Show
-
2022-07-29price $34,800
-
2022-07-20$34,900 Active
-
2022-07-11historical
-
2022-06-27price $35,000
-
2022-04-29$44,000 Active
-
2021-10-26historical
-
2021-10-01price $44,400
-
2021-07-20$45,900 Active
-
2021-07-16historical
-
2021-06-01price $39,000
-
2021-06-01status Active
-
2021-04-05historical
-
2021-03-17$50,000 Active
-
2021-02-19soldstatus $36,000 Closed Sale or Rented
-
2020-12-08status Pending Sale
-
2020-11-28$29,000 Active
ⓘ Source: listings_history table (triggers on properties + properties_extension) + one-shot
backfill from property_details.listing_events for pre-trigger history.
Tax reassessment forecast NY · Partial reset (capped growth)
- Current annual tax
- $224 · $19/mo
- Projected year-2 tax
- $611 · $51/mo
- Expected delta
- +$386/yr (+$32/mo · 172.4%)
ⓘ Screening estimate from a state-policy table — verify with the county assessor before closing.
Climate risk First Street
- Flood 8/10 Severe FEMA zone X (unshaded) · 97% chance over 30 yrs
- Wildfire 1/10 Low
- Heat 3/10 Moderate 7 d/yr ≥91°F today · 15 d/yr by 30 yrs out
- Wind 1/10 Low
- Air quality 4/10 Moderate 4 unhealthy d/yr today · 9 by 30 yrs out
Nearby sold comps map
Loading sold comps map…
Walkable amenities ~0.75 mi
Loading nearby amenities…
Taxation est. · year 1
- Rental income
- $29,201
- − Mortgage interest
- −$3,305
- − Property taxes
- −$224
- − Insurance
- −$1,092
- − Repairs & maintenance
- −$2,336
- − Management
- −$2,336
- − Depreciation
- −$1,716
- Taxable income
- $18,191
- Est. tax owed @ 24.0%
- −$4,366
- After-tax cash flow
- $13,674/yr
For passive investors: Depreciation is non-cash, so a rental often shows a tax loss while cash-flowing — sheltering income. Rental losses are passive: they offset passive income freely, and up to $25,000/yr can offset ordinary (W-2) income if you actively participate and your MAGI is under $100k (phasing out to $0 by $150k); unused losses carry forward. On sale, claimed depreciation is recaptured at up to 25%, and gains may owe capital-gains tax (a 1031 exchange can defer both). Figures are a year-1 estimate at your 24.0% rate — not tax advice; consult a CPA.
Schools (NCES district)
- District
- Buffalo City School District
- NCES district ID
- 3605850
- Math proficiency
- 41% ▲ 11.00%
- Reading proficiency
- 40% ▲ 7.00%
- Median HH income
- $31,665
- Composite
- 33.17/100
- National rank
- #5544
- State rank
- #535 of 590 in NY
Livability — Buffalo
- Score
- 77/100
- State rank
- #195
- US rank
- #3011
Category grades
Schools grade is shown separately in the Schools card above.
Census & demographics
- Census place
- Buffalo, NY
- County
- Erie County · 714,559 people
- City population
- 440,021
- Metro
- Buffalo-Cheektowaga, NY
- Population (ZIP)
- 7,932
- Household income
- $28,182
- Rent vs Own
- Severe rent burden
- 945.0
Population outlook (Erie County) Hauer SSP2
- Today (2025)
- 933,037 people
- By 2030
- 935,181 · +0.2%
- By 2040
- 928,531 · -0.5%
- By 2050
- 905,725 · -2.9%
- By 2075
- 834,037 · -10.6%
- By 2100
- 708,033 · -24.1%
Race, ethnicity, and origin ACS 2023
- Neighborhood character
- Diverse neighborhood (Simpson 0.60)
- Race & ethnicity
- Black 58% White 19% Hispanic / Latino 18% Two or more races 4%
- Hispanic origin (detail)
- Puerto Rican 14% Dominican 1%
- Common ancestry
- Romanian 2% Subsaharan African 1%
- Foreign-born
- 6% · Canada
- Languages at home
- 81% English-only · Spanish 14% French/Haitian/Cajun 2% Russian/Polish/Slavic 1%
Political lean MEDSL · Erie
- 2024 margin
- Lean D (+9.7) · D 54.8% · R 45.2%
- 2008→2024 swing
- -7.9pp toward R · 2008: 17.5pp · 2024: 9.7pp
- All cycles
- 2024: D+9.7 2020: D+14.7 2016: D+4.8 2012: D+15.6 2008: D+17.5
Not yet ingested
- Civics
- —
Market trends
- HPI YoY
- ▼ -3.36%
- Current HPI
- 312.6232
- Rent YoY
- ▲ 5.48%
- Metro
- Buffalo-Cheektowaga, NY
- State GDP YoY
- ▲ 2.60%
- F500 in state
- 92
Industry mix (Fortune 500 HQ in NY)
| Industry | F500 HQs | Revenue |
|---|---|---|
| Financial Services | 10 | $950B |
|
||
| Consumer Goods | 9 | $162B |
|
||
| Insurance | 4 | $225B |
|
||
| Telecommunications | 2 | $144B |
|
||
| Pharmaceuticals | 2 | $112B |
|
||
| Media / Entertainment | 2 | $69B |
|
||
Price history
+103.4% since first listed22 events — show timeline
- 2026-03-30 Listed $59,000 WNYREIS
- 2026-03-29 Listing Removed — WNYREIS
- 2025-08-21 Price Changed $59,000 WNYREIS
- 2025-05-16 Listed $70,000 WNYREIS
- 2022-10-07 Sold (MLS) $28,000 WNYREIS
- 2022-08-21 Pending — WNYREIS
- 2022-07-29 Price Changed $34,800 WNYREIS
- 2022-07-20 Listed $34,900 WNYREIS
- 2022-07-11 Listing Removed — WNYREIS
- 2022-06-27 Price Changed $35,000 WNYREIS
- 2022-04-29 Listed $44,000 WNYREIS
- 2021-10-26 Listing Removed — WNYREIS
- 2021-10-01 Price Changed $44,400 WNYREIS
- 2021-07-20 Listed $45,900 WNYREIS
- 2021-07-16 Listing Removed — WNYREIS
- 2021-06-01 Price Changed $39,000 WNYREIS
- 2021-06-01 Relisted — WNYREIS
- 2021-04-05 Listing Removed — WNYREIS
- 2021-03-17 Listed $50,000 WNYREIS
- 2021-02-19 Sold (MLS) $36,000 WNYREIS
- 2020-12-08 Pending — WNYREIS
- 2020-11-28 Listed $29,000 WNYREIS
Property tax history
+7.3%/yrLatest (2025): $224 · +0.0% YoY. Source: county tax records.
Cash-flow waterfall
monthlySold comps — $/sqft
last 12 mo · ≤1 miLoading sold comps…