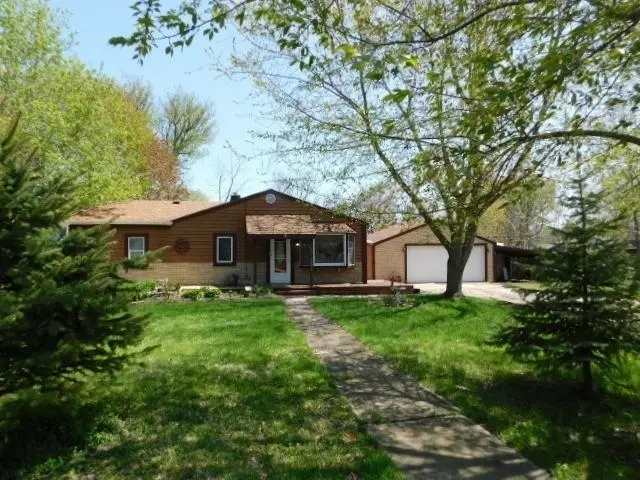
514 Garver St · Rockford, IL
Flood risk 1/10 · Minimal
- FEMA flood zone
- X (unshaded)
- Chance of flooding over 30 yrs
- 0.0%
- Est. flood insurance / yr
- $473 – $860
Fire risk 1/10 · Minimal
- Est. fire insurance / yr
- $804 – $1,492
Heat risk 2/10 · Minimal
- Hot days now (above 101°F)
- 7 days/yr
- Hot days in 30 yrs
- 15 days/yr
Wind risk 2/10 · Minimal
- Chance of severe wind over 30 yrs
- —
Air-quality risk 3/10 · Minor
- Unhealthy air days now
- 2 days/yr
- Unhealthy air days in 30 yrs
- 3 days/yr
Risk factors via First Street. Map © Google.
Why this score? — see what drove the B- grade
The composite is a weighted blend of 9 inputs, each scored 0–100. Each bar is that input's sub-score; the figure is the points it added to the 100-point composite (weight × sub-score).
- Cash flow +30.0/30.0
- 1% rule +10.0/10.0
- DSCR +10.0/10.0
- ARV discount +7.5/15.0
- Livability +3.1/5.0
- Rent growth +2.5/5.0
- Condition / age +2.5/5.0
- Schools +1.2/10.0
- Appreciation +0.0/10.0
$45,000
🖨 Deal sheet (PDF) 📄 Offer letter ✓ Due diligence
Listing remarks MLS
Nice 1014 square foot ranch in county on a large double lot with fenced yard and 2 1/2 car garage. Attached shed and car port. Oak kitchen with white appliances include gas stove, refrigerator, and dishwasher. Washer and dryer also stay. Laminate flooring with carpeted 3 bedrooms. Large bath room with large shower. New ceiling fan in living room. Nice deck porch on front and south side of the house. Deck at the rear for entertaining! Window air conditioner. Estate sale sold as is.
Key facts
- 0.3 acre lot
- 2 garage spots
- Built 1962
Neighborhood map
What this means for you Summary
Snapshot
- This is a 3-bed/1.0-bath single-family listed at $45k.
Deal economics
- At list price, monthly cash flow is $661 ($8k/yr) — positive.
- The deal already cash-flows at list — no discount required.
- Meets the 1% rule at list price ($1k rent vs $45k).
- Cap rate 23.9% vs local median 6.1% in Rockford — top-decile yield for the area; either an underpriced asset or a hidden risk that comps aren't pricing in. Stress-test before assuming the spread holds.
Location & tenants
- Location reads 62/100 on livability (#876 in IL) — a middle-class / working-renter tenant base. Strengths: cost of living A+, housing A+, health & safety A+; Watch: crime F, amenities F, commute F.
- Rockford SD 205 (urban): math 12% / reading 16% proficiency, ranked #533 of 620 in IL (top 86%) — low school quality limits family demand, transient renter base, plan for 1-2y turnover; 73% free/reduced lunch — lower-income household profile, screen leases tightly.
- Zoned schools: Mcintosh Elementary (math 2% / reading 2%, grade F, #1,927 of 2,056 statewide, top 100%, 333 students, 0% FRL); Thurgood Marshall School (math 82% / reading 82%, grade A+, #1 of 665 statewide, top 0%, 482 students, 0% FRL); Auburn High School (math 26% / reading 32%, grade F, #210 of 693 statewide, top 30%, 1,936 students, 0% FRL) — zoned schools average 0% FRL vs 73% district-wide (73 pts lower); this property's tenant base skews higher-income than the district average.
- Zoned-school proficiency averages 38% at this address vs 14% district-wide (+24 pts) — the actual schools serving this property are materially stronger than the Rockford SD 205 average implies; a family-tenant draw the district grade alone would hide.
- Market conditions: 72 active listings in the ZIP; 4 comparable units currently listed for rent nearby; rentals at typical pace (median 16d on market — plan ~3-4 weeks tenant-placement turnaround); 285 units permitted in Winnebago County in 2024 (0 in 5+ unit buildings).
Forward outlook
- Local home prices are declining (-3.0%/yr); year-one equity from $311 of loan paydown is wiped out by about $1k of value loss. Plan a longer hold.
- Winnebago County population projected at -20% by 2050 — secular population decline; favor cash flow + early exit over multi-decade hold.
- At projected returns (-3.0% appreciation + 3.0% rent growth), your $13k cash investment doubles in ~2 years — after that, you're playing with house money.
Negotiation context
- Only 0 days on market — expect competitive offers; lowballing is unlikely to land.
- 3 sale attempts since 7y ago with the ask held roughly flat each time — persistent listings suggest the price (not the market) is what's stuck; bring a comps-based counter.
Risks & watch-outs
- Watch-outs: property tax is 3.4% of price.
Questions for the listing agent
- Built in 1962 — when were the roof, HVAC, electrical panel, plumbing, and water heater last replaced?
- Property tax is high relative to price — has the assessment been appealed recently, and will the sale trigger a re-assessment?
- Is there a deadline driving the sale (1031 exchange, divorce, estate, relocation)? That informs how much negotiation room exists.
- Schools are F-rated, which usually means shorter tenancies and higher turnover. Who's the typical renter profile here, and what's been the actual vacancy rate?
- Crime grade is F in this area — have there been break-ins, vandalism, or insurance claims at this property in the last 3 years? What carrier currently insures it and at what premium?
- What's the average days-on-market for RENTAL listings here right now (not sales)? A rising rental-DOM trend means longer vacancies and softer asking-rent achievability than the comps imply.
- What's the recent tenant-quality profile in this submarket — average credit score on applications, eviction rate, late-payment / NSF rate, and stable-employment percentage? A property-management company in the area should have these aggregated.
- How much new for-sale + rental construction is in the pipeline within 1–3 miles? Heavy new supply typically softens prices + rents 12–24 months out; constrained supply supports both.
Investment metrics
- 1% rule
- 2.93% ✓
- Cap rate
- 23.92%
- Cash-on-cash
- 62.94%
- DSCR
- 3.80
- GRM
- 2.8
CMA / ARV
- ARV (on-the-fly)
- $113,568
- Comps found
- 8
Show comp detail 8 sales within ~0.75 mi
| Address | Dist | Beds/Ba | Sqft | Sold | Price | $/sf | Match |
|---|---|---|---|---|---|---|---|
| 615 S Memorial Ave | 0.14mi | 3/1.0 | 1,080 (+6%) | 9mo | $75,000 | $69 | 75 |
| 503 Vincent Ave | 0.17mi | 3/1.0 | 1,120 (+10%) | 2mo | $140,000 | $125 | 73 |
| 448 Garver Ave | 0.08mi | 2/1.0 (-1) | 900 (-11%) | 13mo | $100,000 | $111 | 62 |
| 423 Atwood Ave | 0.13mi | 2/1.0 (-1) | 864 (-15%) | 3mo | $147,500 | $171 | 62 |
| 426 Vincent Ave | 0.15mi | 2/1.0 (-1) | 912 (-10%) | 13mo | $79,000 | $87 | 60 |
| 510 Garver Ave | 0.02mi | 2/1.0 (-1) | 924 (-9%) | 24mo | $22,500 | $24 | 60 |
| 3911 Delaware St | 0.66mi | 3/1.0 | 924 (-9%) | 1mo | $106,000 | $115 | 54 |
| 321 Atwood Ave | 0.24mi | 3/2.5 | 1,120 (+10%) | 18mo | $125,000 | $112 | 50 |
Match score weights: distance 35% · size 25% · config 20% · recency 20%. Top-matched comps best support the ARV.
Projected returns pro-forma
-3.0% appreciation · 3.0% rent growth · sell at horizon
- IRR
- 62.0%
- Equity multiple
- 3.77×
- Total profit
- $34,863
- Equity at exit
- $6,710
- IRR
- 66.5%
- Equity multiple
- 7.73×
- Total profit
- $84,814
- Equity at exit
- $3,891
Cash invested: $12,600 (down + closing). Projections, not guarantees.
Landlord ↔ Tenant lean methodology
- Overall (STATE)
- 43 Moderately Tenant-Leaning
- State Illinois
- 43 Moderately Tenant-Leaning · D+7
- County
- — inherits STATE
- City
- — inherits STATE
ZIP-level market 61102
- Home prices YoY
- -33.1%
- Active inventory
- 72
- Price-to-rent
- 2.8×
Monthly cashflow live
- Estimated rent
- $1,318 medium interval (Pro) →
- Mortgage (P&I)
- −$236
- Tax from tax record
- −$126 /mo · $1,508/yr
- Insurance
- −$19
- HOA
- −$0
- Vacancy / Maint / Mgmt
- −$277
- Net cashflow
- $661
Break-even live
Sensitivity live
| Price | -10% $686 | -5% $674 | +0% $661 | +5% $648 | +10% $635 |
|---|---|---|---|---|---|
| Rent | -10% $557 | -5% $609 | +0% $661 | +5% $713 | +10% $765 |
| Rate | -1.0pp $684 | -0.5pp $672 | base $661 | +0.5pp $649 | +1.0pp $637 |
UW: 25.0% down · 7.5% · 30yr · 1.5% tax · 5.0% vac · 8.0% maint · 8.0% mgmt
Financing live
Cash to close
- Down payment
- $11,250
- Closing costs
- $1,350
- Reserves months
- —
- Total cash needed
- —
Loan-product check · same deal, 3 products live
Conventional
25% down · 7.5% · 30yr
- Down + closing
- —
- Monthly P&I
- —
- Monthly cashflow
- —
- DSCR
- —
- Eligible?
- —
Personal DTI + credit; lowest rate.
DSCR
20% down · 8.5% · 30yr
- Down + closing
- —
- Monthly P&I
- —
- Monthly cashflow
- —
- DSCR
- —
- Eligible?
- —
No personal income docs; deal must DSCR.
Hard money
10% down · 12.0% · 12mo
- Down + closing
- —
- Monthly P&I
- —
- Monthly cashflow
- —
- DSCR
- —
- Eligible?
- —
Short-term bridge; refi at stabilization.
Rent comps 4 comps
| Address | Beds | Baths | Sqft | Rent | $/sqft | DOM | Units | Dist |
|---|---|---|---|---|---|---|---|---|
| 3834 Preston St Rockford, IL | 3.0 | 1.0 | 912 | $1,300 | $1.43 | 15d | 1 | 0.68mi |
| 615 Newport Ave Rockford, IL | 2.0 | 1.0 | 700 | $1,300 | $1.86 | 15d | 1 | 0.70mi |
| 504 Lexington Ave Rockford, IL | 2.0 | 1.0 | 700 | $1,300 | $1.86 | 15d | 1 | 1.00mi |
| 3016 School St Rockford, IL | 4.0 | 1.0 | 1090 | $1,400 | $1.28 | 46d | 1 | 1.40mi |
Listing history 2 events
-
2026-06-03remarks 3-char remark
-
2026-06-03$45,000 Pending
ⓘ Source: listings_history table (triggers on properties + properties_extension) + one-shot
backfill from property_details.listing_events for pre-trigger history.
Tax reassessment forecast IL · Partial reset (capped growth)
- Current annual tax
- $1,508 · $126/mo
- Projected year-2 tax
- $1,508 · $126/mo
- Expected delta
- $0/yr ($0/mo · 0.0%)
ⓘ Screening estimate from a state-policy table — verify with the county assessor before closing.
Climate risk First Street
- Flood 1/10 Low FEMA zone X (unshaded) · 0% chance over 30 yrs
- Wildfire 1/10 Low
- Heat 2/10 Low 7 d/yr ≥101°F today · 15 d/yr by 30 yrs out
- Wind 2/10 Low
- Air quality 3/10 Moderate 2 unhealthy d/yr today · 3 by 30 yrs out
Nearby sold comps map
Loading sold comps map…
Walkable amenities ~0.75 mi
Loading nearby amenities…
Taxation est. · year 1
- Rental income
- $15,817
- − Mortgage interest
- −$2,521
- − Property taxes
- −$1,508
- − Insurance
- −$225
- − Repairs & maintenance
- −$1,265
- − Management
- −$1,265
- − Depreciation
- −$1,309
- Taxable income
- $7,724
- Est. tax owed @ 24.0%
- −$1,854
- After-tax cash flow
- $6,077/yr
For passive investors: Depreciation is non-cash, so a rental often shows a tax loss while cash-flowing — sheltering income. Rental losses are passive: they offset passive income freely, and up to $25,000/yr can offset ordinary (W-2) income if you actively participate and your MAGI is under $100k (phasing out to $0 by $150k); unused losses carry forward. On sale, claimed depreciation is recaptured at up to 25%, and gains may owe capital-gains tax (a 1031 exchange can defer both). Figures are a year-1 estimate at your 24.0% rate — not tax advice; consult a CPA.
Schools (NCES district)
- District
- Rockford SD 205
- NCES district ID
- 1734510
- Math proficiency
- 12% ▼ -2.00%
- Reading proficiency
- 16% ▼ -3.00%
- Median HH income
- $42,533
- Composite
- 12.21/100
- National rank
- #9649
- State rank
- #533 of 620 in IL
Livability — Rockford
- Score
- 62/100
- State rank
- #876
- US rank
- #17035
Category grades
Schools grade is shown separately in the Schools card above.
Census & demographics
- City population
- 147,297
- Population (ZIP)
- 16,620
Population outlook (Winnebago County) Hauer SSP2
- Today (2025)
- 271,080 people
- By 2030
- 260,684 · -3.8%
- By 2040
- 238,405 · -12.1%
- By 2050
- 216,129 · -20.3%
- By 2075
- 172,882 · -36.2%
- By 2100
- 135,336 · -50.1%
Race, ethnicity, and origin ACS 2023
- Neighborhood character
- Highly diverse neighborhood (Simpson 0.70)
- Race & ethnicity
- White 36% Black 33% Hispanic / Latino 25% Two or more races 15%
- Hispanic origin (detail)
- Mexican 23%
- Common ancestry
- Portuguese 2% Iranian 1% Romanian 1%
- Foreign-born
- 9% · Canada
- Languages at home
- 81% English-only · Spanish 18%
Political lean MEDSL · Winnebago
- 2024 margin
- Toss-up / Even · D 49.5% · R 49.0% · Other 1.5%
- 2008→2024 swing
- -12.2pp toward R · 2008: 12.8pp · 2024: 0.6pp
- All cycles
- 2024: D+0.6 2020: D+2.5 2016: R+1.2 2012: D+5.7 2008: D+12.8
Not yet ingested
- Civics
- —
Market trends
- HPI YoY
- ▼ -93.81%
- Current HPI
- 189.9634
- Rent YoY
- —
- Metro
- —
- State GDP YoY
- ▲ 1.59%
- F500 in state
- 60
Industry mix (Fortune 500 HQ in IL)
| Industry | F500 HQs | Revenue |
|---|---|---|
| Insurance | 4 | $201B |
|
||
| Consumer Goods | 4 | $87B |
|
||
| Industrial Machinery | 3 | $64B |
|
||
| Healthcare | 2 | $55B |
|
||
| Retail / Pharmacy | 1 | $148B |
|
||
| Agriculture / Food | 1 | $86B |
|
||
Price history
-24.9% since first listed8 events — show timeline
- 2026-06-01 Delisted — NWIAR
- 2026-06-01 Listed $45,000 NWIAR
- 2019-07-23 Sold (Public Records) $54,900 Public Records
- 2019-07-22 Sold (MLS) $54,900 MRED as Distributed by MLS Grid
- 2019-07-19 Sold (MLS) $54,900 NWIAR
- 2019-05-13 Pending — MRED as Distributed by MLS Grid
- 2019-04-29 Listed $59,900 MRED as Distributed by MLS Grid
- 2019-04-29 Listed $59,900 NWIAR
Property tax history
+0.8%/yrLatest (2024): $1,508 · +8.8% YoY. Source: county tax records.
Cash-flow waterfall
monthlySold comps — $/sqft
last 12 mo · ≤1 miLoading sold comps…