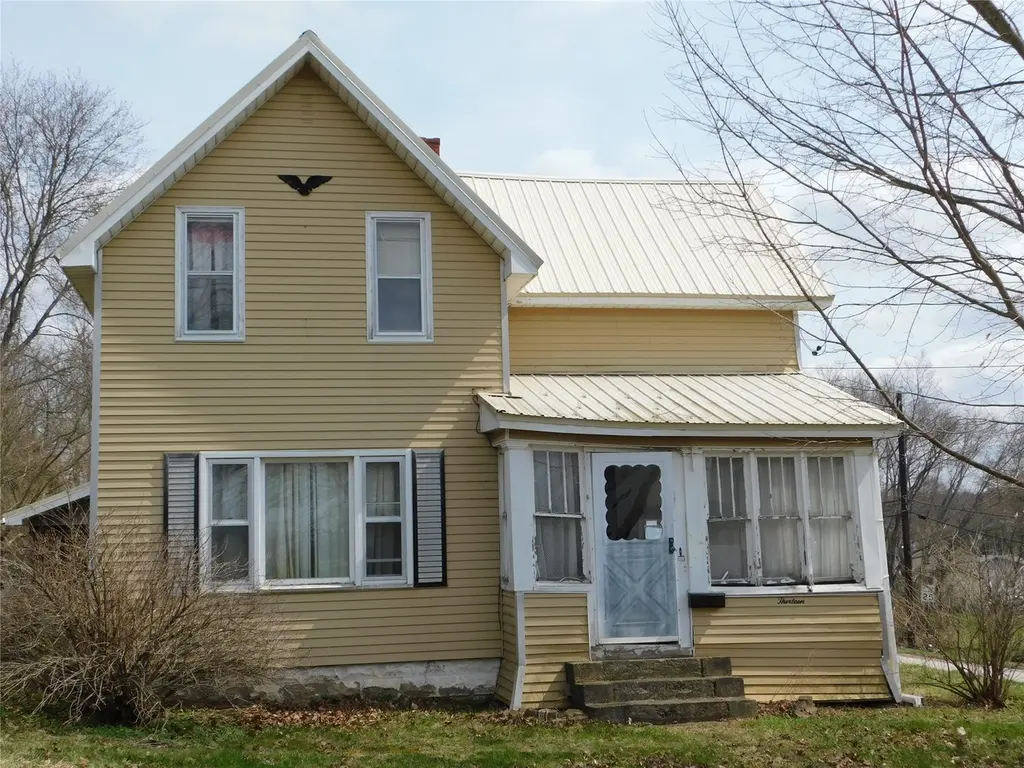
13 Prospect St · Union City, PA
Flood risk 1/10 · Minimal
- FEMA flood zone
- X (unshaded)
- Chance of flooding over 30 yrs
- 0.0%
- Est. flood insurance / yr
- $473 – $860
Fire risk 1/10 · Minimal
- Est. fire insurance / yr
- $511 – $949
Heat risk 2/10 · Minimal
- Hot days now (above 92°F)
- 7 days/yr
- Hot days in 30 yrs
- 18 days/yr
Wind risk 1/10 · Minimal
- Chance of severe wind over 30 yrs
- —
Air-quality risk 2/10 · Minimal
- Unhealthy air days now
- 1 days/yr
- Unhealthy air days in 30 yrs
- 2 days/yr
Risk factors via First Street. Map © Google.
Why this score? — see what drove the B- grade
The composite is a weighted blend of 9 inputs, each scored 0–100. Each bar is that input's sub-score; the figure is the points it added to the 100-point composite (weight × sub-score).
- Cash flow +30.0/30.0
- 1% rule +10.0/10.0
- DSCR +10.0/10.0
- ARV discount +7.5/15.0
- Schools +3.6/10.0
- Livability +3.6/5.0
- Rent growth +2.5/5.0
- Condition / age +2.5/5.0
- Appreciation +0.0/10.0
$65,000
🖨 Deal sheet 📄 Offer letter ✓ Due diligence
Listing remarks
This 4-bedroom, 1-bath home sits on a spacious corner lot and offers a great opportunity to build equity with a little TLC. Featuring a functional layout and generous room sizes, this property is perfect for investors, flippers, or buyers looking to customize their next home. The large lot provides added outdoor space for expansion, entertaining, or future improvements. Conveniently located with easy access to local amenities, schools, and major roadways. Being sold as-is—bring your vision and make it your own! Newer metal roof and furnace.
Key facts
- Newer furnace
- Large lot
- Functional layout
Tags
Property features AI
Finance
- Other: Zoning: R-2
Exterior
- Parking: 3 parking spaces
- Utilities: Public water; Public sewer
- Home design: Single-family residence; Two levels (2 stories)
- Construction: Frame construction
- Exterior features: Corner lot; Paved road access; Metal roof
Interior
- Flooring: Other
- Bathrooms: One full bathroom
- Heating & cooling: Forced air heating; Has heating
- Interior features: Partial basement; Eight total rooms; Other flooring; Forced air heating
Neighborhood map
What this means for you Summary
Snapshot
- This is a 4-bed/1.0-bath single-family listed at $65k.
Deal economics
- At list price, monthly cash flow is $515 ($6k/yr) — positive.
- The deal already cash-flows at list — no discount required.
- Meets the 1% rule at list price ($1k rent vs $65k).
- Recommended offer: $64k (1.5% below list) — sets the bar for market timing.
Location & tenants
- Location reads 71/100 on livability (#707 in PA) — a middle-class / working-renter tenant base. Strengths: crime A+, cost of living A+, housing A+; Watch: amenities F, commute F, employment F.
- Union City Area SD (town): math 34% / reading 51% proficiency, ranked #323 of 539 in PA (top 60%) — families likely to look elsewhere, expect single-tenant / working-renter base with shorter leases.
- Market conditions: 41 active listings in the ZIP; 364 units permitted in Erie County in 2024 (188 in 5+ unit buildings).
Forward outlook
- Local home prices are declining (-3.0%/yr); year-one equity from $449 of loan paydown is wiped out by about $2k of value loss. Plan a longer hold.
- Erie County population projected at -14% by 2050 — secular population decline; favor cash flow + early exit over multi-decade hold.
- At projected returns (-3.0% appreciation + 3.0% rent growth), your $18k cash investment doubles in ~4 years — after that, you're playing with house money.
Negotiation context
- It's been on market 29 days — a 2% lower offer ($64k) is reasonable based on typical stale-listing flexibility.
Risks & watch-outs
- Watch-outs: built in 1890 — expect roof / HVAC / electrical / plumbing capex.
Questions for the listing agent
- Built in 1890 — when were the roof, HVAC, electrical panel, plumbing, and water heater last replaced?
- Is there a deadline driving the sale (1031 exchange, divorce, estate, relocation)? That informs how much negotiation room exists.
- What's the average days-on-market for RENTAL listings here right now (not sales)? A rising rental-DOM trend means longer vacancies and softer asking-rent achievability than the comps imply.
- What's the recent tenant-quality profile in this submarket — average credit score on applications, eviction rate, late-payment / NSF rate, and stable-employment percentage? A property-management company in the area should have these aggregated.
- How much new for-sale + rental construction is in the pipeline within 1–3 miles? Heavy new supply typically softens prices + rents 12–24 months out; constrained supply supports both.
Investment metrics
- 1% rule
- 1.91% ✓
- Cap rate
- 15.80%
- Cash-on-cash
- 33.97%
- DSCR
- 2.51
- GRM
- 4.4
CMA / ARV
- ARV (on-the-fly)
- $137,816
- Comps found
- 4
Show comp detail 4 sales within ~0.75 mi
| Address | Dist | Beds/Ba | Sqft | Sold | Price | $/sf | Match |
|---|---|---|---|---|---|---|---|
| 113 N Main St | 0.47mi | 3/1.5 (-1) | 1,297 (+1%) | 2mo | $208,000 | $160 | 68 |
| 10 Putnam St | 0.39mi | 3/1.0 (-1) | 1,309 (+2%) | 12mo | $140,000 | $107 | 64 |
| 16 Perry St | 0.54mi | 3/2.0 (-1) | 1,200 (-7%) | 14mo | $115,000 | $96 | 43 |
| 40 Grant St | 0.64mi | 3/1.0 (-1) | 1,116 (-13%) | 15mo | $53,000 | $47 | 30 |
Match score weights: distance 35% · size 25% · config 20% · recency 20%. Top-matched comps best support the ARV.
Projected returns pro-forma
-3.0% appreciation · 3.0% rent growth · sell at horizon
- IRR
- 29.3%
- Equity multiple
- 2.23×
- Total profit
- $22,307
- Equity at exit
- $9,692
- IRR
- 36.7%
- Equity multiple
- 4.40×
- Total profit
- $61,792
- Equity at exit
- $5,620
Cash invested: $18,200 (down + closing). Projections, not guarantees.
Landlord ↔ Tenant lean methodology
- Overall (STATE)
- 62 Landlord-Friendly
- State Pennsylvania
- 62 Landlord-Friendly · EVEN
- County
- — inherits STATE
- City
- — inherits STATE
ZIP-level market 16438
- Home prices YoY
- -9.8%
- Active inventory
- 41
- Price-to-rent
- 4.4×
Monthly cashflow live
- Estimated rent
- $1,241 medium interval (Pro) →
- Mortgage (P&I)
- −$341
- Tax from tax record
- −$98 /mo · $1,172/yr
- Insurance
- −$27
- HOA
- −$0
- Vacancy / Maint / Mgmt
- −$261
- Net cashflow
- $515
Break-even live
UW: 25.0% down · 7.5% · 30yr · 1.5% tax · 5.0% vac · 8.0% maint · 8.0% mgmt
Financing live
Cash to close
- Down payment
- $16,250
- Closing costs
- $1,950
- Reserves months
- —
- Total cash needed
- —
Loan-product check · same deal, 3 products live
Conventional
25% down · 7.5% · 30yr
- Down + closing
- —
- Monthly P&I
- —
- Monthly cashflow
- —
- DSCR
- —
- Eligible?
- —
Personal DTI + credit; lowest rate.
DSCR
20% down · 8.5% · 30yr
- Down + closing
- —
- Monthly P&I
- —
- Monthly cashflow
- —
- DSCR
- —
- Eligible?
- —
No personal income docs; deal must DSCR.
Hard money
10% down · 12.0% · 12mo
- Down + closing
- —
- Monthly P&I
- —
- Monthly cashflow
- —
- DSCR
- —
- Eligible?
- —
Short-term bridge; refi at stabilization.
Listing history 4 events
-
2026-04-30status Pending
-
2026-04-01$65,000 Active
-
2003-06-23soldstatus $62,500
-
2003-06-23soldstatus $62,500
ⓘ Source: listings_history table (triggers on properties + properties_extension) + one-shot
backfill from property_details.listing_events for pre-trigger history.
Tax reassessment forecast PA · Partial reset (capped growth)
- Current annual tax
- $1,172 · $98/mo
- Projected year-2 tax
- $1,172 · $98/mo
- Expected delta
- $0/yr ($0/mo · 0.0%)
ⓘ Screening estimate from a state-policy table — verify with the county assessor before closing.
Climate risk First Street
- Flood 1/10 Low FEMA zone X (unshaded) · 0% chance over 30 yrs
- Wildfire 1/10 Low
- Heat 2/10 Low 7 d/yr ≥92°F today · 18 d/yr by 30 yrs out
- Wind 1/10 Low
- Air quality 2/10 Low 1 unhealthy d/yr today · 2 by 30 yrs out
Nearby sold comps map
Loading sold comps map…
Walkable amenities ~0.75 mi
Loading nearby amenities…
Taxation est. · year 1
- Rental income
- $14,898
- − Mortgage interest
- −$3,641
- − Property taxes
- −$1,172
- − Insurance
- −$325
- − Repairs & maintenance
- −$1,192
- − Management
- −$1,192
- − Depreciation
- −$1,891
- Taxable income
- $5,485
- Est. tax owed @ 24.0%
- −$1,316
- After-tax cash flow
- $4,866/yr
For passive investors: Depreciation is non-cash, so a rental often shows a tax loss while cash-flowing — sheltering income. Rental losses are passive: they offset passive income freely, and up to $25,000/yr can offset ordinary (W-2) income if you actively participate and your MAGI is under $100k (phasing out to $0 by $150k); unused losses carry forward. On sale, claimed depreciation is recaptured at up to 25%, and gains may owe capital-gains tax (a 1031 exchange can defer both). Figures are a year-1 estimate at your 24.0% rate — not tax advice; consult a CPA.
Schools (NCES district)
- District
- Union City Area SD
- NCES district ID
- 4224090
- Math proficiency
- 34% ▼ -10.00%
- Reading proficiency
- 51% ▼ -9.00%
- Median HH income
- $44,275
- Composite
- 35.96/100
- National rank
- #4797
- State rank
- #323 of 539 in PA
Livability — Union City
- Score
- 71/100
- State rank
- #707
- US rank
- #6992
Category grades
Schools grade is shown separately in the Schools card above.
Census & demographics
- Census place
- Union City, PA
- City population
- 7,489
- Population (ZIP)
- 7,489
Population outlook (Erie County) Hauer SSP2
- Today (2025)
- 272,159 people
- By 2030
- 266,299 · -2.2%
- By 2040
- 250,987 · -7.8%
- By 2050
- 234,925 · -13.7%
- By 2075
- 199,164 · -26.8%
- By 2100
- 162,985 · -40.1%
Race, ethnicity, and origin ACS 2023
- Neighborhood character
- Predominantly White (92%)
- Race & ethnicity
- White 92% Two or more races 5% Hispanic / Latino 4%
- Common ancestry
- Romanian 7% Slovak 3% Iranian 2%
- Foreign-born
- 1% · Canada
- Languages at home
- 98% English-only · Spanish 1% German/W. Germanic 1%
Political lean MEDSL · Erie
- 2024 margin
- Toss-up / Even · D 49.0% · R 50.0%
- 2008→2024 swing
- -20.9pp toward R · 2008: 19.9pp · 2024: -1.0pp
- All cycles
- 2024: R+1.0 2020: D+1.0 2016: R+2.0 2012: D+16.9 2008: D+19.9
Not yet ingested
- Civics
- —
Market trends
- HPI YoY
- ▼ -23.30%
- Current HPI
- 215.3389
- Rent YoY
- —
- Metro
- —
- State GDP YoY
- ▲ 1.68%
- F500 in state
- 34
Industry mix (Fortune 500 HQ in PA)
| Industry | F500 HQs | Revenue |
|---|---|---|
| Healthcare | 2 | $309B |
|
||
| Insurance | 2 | $27B |
|
||
| Telecommunications / Media | 1 | $124B |
|
||
| Industrial Distribution | 1 | $22B |
|
||
| Financial Services | 1 | $20B |
|
||
| Chemicals / Materials | 1 | $18B |
|
||
Price history
+4.0% since first listed4 events — show timeline
- 2026-04-30 Pending — GEBOR
- 2026-04-01 Listed $65,000 GEBOR
- 2003-06-23 Sold (Public Records) $62,500 Public Records
- 2003-06-23 Sold (Public Records) $62,500 Public Records
Property tax history
-1.0%/yrLatest (2026): $1,172 · -29.8% YoY. Source: county tax records.
Cash-flow waterfall
monthlySold comps — $/sqft
last 12 mo · ≤1 miLoading sold comps…