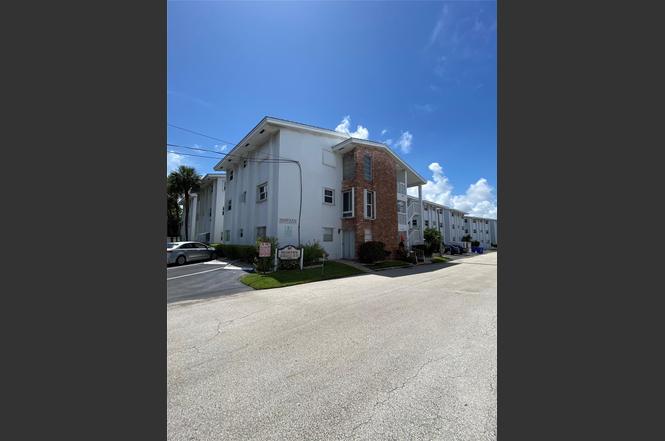
224 Hibiscus Ave #253 · Lauderdale-by-the-Sea, FL
Flood risk 5/10 · Moderate
- FEMA flood zone
- X (unshaded)
- Chance of flooding over 30 yrs
- 0.23%
- Est. flood insurance / yr
- $507 – $1,088
Fire risk 1/10 · Minimal
- Est. fire insurance / yr
- $947 – $1,759
Heat risk 10/10 · Severe
- Hot days now (above 105°F)
- 7 days/yr
- Hot days in 30 yrs
- 26 days/yr
Wind risk 10/10 · Severe
- Chance of severe wind over 30 yrs
- 99.0%
Air-quality risk 2/10 · Minimal
- Unhealthy air days now
- 1 days/yr
- Unhealthy air days in 30 yrs
- 2 days/yr
Risk factors via First Street. Map © Google.
Why this score? — see what drove the C grade
The composite is a weighted blend of 9 inputs, each scored 0–100. Each bar is that input's sub-score; the figure is the points it added to the 100-point composite (weight × sub-score).
- Cash flow +22.8/30.0
- 1% rule +9.7/10.0
- ARV discount +7.5/15.0
- DSCR +7.3/10.0
- Schools +4.1/10.0
- Rent growth +3.4/5.0
- Livability +2.5/5.0
- Condition / age +2.5/5.0
- Appreciation +0.0/10.0
$224,900
🖨 Deal sheet 📄 Offer letter ✓ Due diligence
Listing remarks MLS
BEAUTIFUL FURNISHED CONDO IN WALKING DISTANCE TO BEACH! VERY NICE & CLEAN, NEWER FLOOR & PAINT, OVERLOOKING POOL, HEATED POOL IN TROPICAL SETTINGS, NEWER ROOF, NEW EXT. PAINTING, EASY TO SHOW!!
Key facts
- Tons of closet space
- 2nd floor location
- $625 HOA
Tags
Property features AI
Finance
- Financial info: Land lease not applicable
- HOA & community: Part of an association (South Leisure by the Sea); Monthly HOA fee; Association amenities include pool, shuffleboard court, bocce ball, and storage; HOA covers insurance, grounds and structure maintenance, sewer, trash, water, elevator, legal/accounting, reserve funds, and roof repairs; Community contains 75 units; Pets are not allowed
Exterior
- Parking: Assigned parking (1 space)
- Security: Smoke detector(s)
- Utilities: Public water; Public sewer; 100 Amp electric service; Cable available; Electricity connected; Water available; Sewer available
- Home design: Condominium; One level; West-facing
- Construction: Block/CBS construction; Spanish tile roof; Slab foundation; Built as part of a 3-story building
- Exterior features: Landscaped grounds; Asphalt road frontage; Not waterfront
Interior
- Kitchen: Electric range; Microwave; Refrigerator; Disposal; Electric water heater
- Bedrooms: One bedroom on the main level
- Flooring: Laminate flooring
- Bathrooms: One full bathroom on the main level
- Heating & cooling: Central electric heating; Central air conditioning; Ceiling fan(s)
- Interior features: No notable built-in interior features listed; Furnished
- Laundry & utility: Common area laundry
Neighborhood map
What this means for you Summary
Snapshot
- This is a 1-bed/1.0-bath condo listed at $225k.
Deal economics
- At list price, monthly cash flow is $391 ($5k/yr) — positive.
- The deal already cash-flows at list — no discount required.
- Meets the 1% rule at list price ($3k rent vs $225k).
- Cap rate 8.4% vs local median 2.0% in Lauderdale-by-the-Sea — top-decile yield for the area; either an underpriced asset or a hidden risk that comps aren't pricing in. Stress-test before assuming the spread holds.
Location & tenants
- Location reads: area grade C — affects rentability + tenant quality, not the cash-flow math above.
- Broward (suburban): math 42% / reading 53% proficiency, ranked #46 of 73 in FL (top 63%) — families likely to look elsewhere, expect single-tenant / working-renter base with shorter leases.
- Zoned schools: Bayview Elementary School (math 79% / reading 85%, grade A+, #79 of 2,144 statewide, top 4%, 552 students, 23% FRL); Sunrise Middle School (math 50% / reading 52%, grade C, #237 of 571 statewide, top 43%, 1,242 students, 64% FRL); Fort Lauderdale High School (math 38% / reading 67%, grade C-, #154 of 667 statewide, top 24%, 2,228 students, 57% FRL) — zoned schools at 48% FRL track the district average.
- Zoned-school proficiency averages 62% at this address vs 48% district-wide (+14 pts) — the actual schools serving this property are materially stronger than the Broward average implies; a family-tenant draw the district grade alone would hide.
- Market conditions: Rents rising (+3.6%/yr); 739 active listings in the ZIP; 4 comparable units currently listed for rent nearby; rentals leasing fast (median 5d on market — plan ~1-2 weeks tenant-placement turnaround); solid renter incomes; 2,111 units permitted in Broward County in 2024 (1,265 in 5+ unit buildings).
- This rent runs 42% of the median local income ($94k/yr) — at the standard rent-burdened threshold; future hikes will face affordability resistance.
Forward outlook
- Local home prices are declining (-3.0%/yr); year-one equity from $2k of loan paydown is wiped out by about $7k of value loss. Plan a longer hold.
- Broward County population projected at +34% by 2050 — long-run rental-demand tailwind backs the buy-and-hold thesis.
Negotiation context
- Only 7 days on market — expect competitive offers; lowballing is unlikely to land.
- 5 sale attempts since 20y ago; this cycle's ask is 11737% above the opening price — seller raised mid-cycle; expect resistance to lowballs.
- Current owner paid $190k; 18% above their basis — modest negotiation headroom, anchor on the comps not their cost.
Risks & watch-outs
- Climate carrying-cost: moderate flood risk; severe wind risk, 99% chance of damaging wind over 30y; extreme-heat days projected 7→26/yr by 2055 (HVAC capex compounding) — expect insurance premiums to compound above CPI over the hold.
Questions for the listing agent
- Built in 1966 — when were the roof, HVAC, electrical panel, plumbing, and water heater last replaced?
- What does the HOA fee cover, when was the last increase, and are there any pending special assessments or reserve-fund shortfalls?
- Any open or pending special assessments — roof, HVAC, plumbing, elevator, façade? What's the per-unit balance and payoff schedule, and is the seller paying it off at close or rolling it to the buyer?
- Is there a deadline driving the sale (1031 exchange, divorce, estate, relocation)? That informs how much negotiation room exists.
- What's the average days-on-market for RENTAL listings here right now (not sales)? A rising rental-DOM trend means longer vacancies and softer asking-rent achievability than the comps imply.
- What's the recent tenant-quality profile in this submarket — average credit score on applications, eviction rate, late-payment / NSF rate, and stable-employment percentage? A property-management company in the area should have these aggregated.
- How much new apartment / multifamily construction is in the pipeline within 1–3 miles? Heavy new supply (>2% of stock underway) typically softens rents 12–24 months out; light construction supports rent growth.
Investment metrics
- 1% rule
- 1.47% ✓
- Cap rate
- 8.38%
- Cash-on-cash
- 7.45%
- DSCR
- 1.33
- GRM
- 5.7
CMA / ARV
No comps found within radius.
Projected returns pro-forma
-3.0% appreciation · 3.63% rent growth · sell at horizon
- IRR
- -3.8%
- Equity multiple
- 0.86×
- Total profit
- $-8,967
- Equity at exit
- $33,533
- IRR
- 7.0%
- Equity multiple
- 1.55×
- Total profit
- $34,918
- Equity at exit
- $19,445
Cash invested: $62,972 (down + closing). Projections, not guarantees.
Landlord ↔ Tenant lean methodology
- Overall (STATE)
- 87 Strongly Landlord-Friendly
- State Florida
- 87 Strongly Landlord-Friendly · R+3
- County
- — inherits STATE
- City
- — inherits STATE
ZIP-level market 33308
- Rents YoY
- 3.6%
- Active inventory
- 739
- Price-to-rent
- 5.7×
Monthly cashflow live
- Estimated rent
- $3,312 medium interval (Pro) →
- Mortgage (P&I)
- −$1,179
- Tax from tax record
- −$328 /mo · $3,933/yr
- Insurance
- −$94
- HOA
- −$625
- Vacancy / Maint / Mgmt
- −$696
- Net cashflow
- $391
Break-even live
UW: 25.0% down · 7.5% · 30yr · 1.5% tax · 5.0% vac · 8.0% maint · 8.0% mgmt
Financing live
Cash to close
- Down payment
- $56,225
- Closing costs
- $6,747
- Reserves months
- —
- Total cash needed
- —
Loan-product check · same deal, 3 products live
Conventional
25% down · 7.5% · 30yr
- Down + closing
- —
- Monthly P&I
- —
- Monthly cashflow
- —
- DSCR
- —
- Eligible?
- —
Personal DTI + credit; lowest rate.
DSCR
20% down · 8.5% · 30yr
- Down + closing
- —
- Monthly P&I
- —
- Monthly cashflow
- —
- DSCR
- —
- Eligible?
- —
No personal income docs; deal must DSCR.
Hard money
10% down · 12.0% · 12mo
- Down + closing
- —
- Monthly P&I
- —
- Monthly cashflow
- —
- DSCR
- —
- Eligible?
- —
Short-term bridge; refi at stabilization.
Rent comps 4 comps
| Address | Beds | Baths | Sqft | Rent | $/sqft | DOM | Units | Dist |
|---|---|---|---|---|---|---|---|---|
| 4010 Galt Ocean Dr Fort Lauderdale, FL | 2.0–3.0 | 2.0 | 810 | $5,000 | $6.17 | 5d | 2 | 0.57mi |
| 4010 Galt Ocean Dr Fort Lauderdale, FL | 2.0–3.0 | 2.0 | 810 | $3,200 | $3.95 | 4d | 3 | 0.57mi |
| 4564 El Mar Dr #4 Lauderdale by the Sea, FL | 1.0 | 1.0 | 566 | $3,500 | $6.18 | 17d | 1 | 0.71mi |
| 3020 NE 32nd Ave Fort Lauderdale, FL | 1.0–2.0 | 1.0–2.0 | 920 | $3,200 | $3.48 | 4d | 4 | 1.33mi |
HOA detail condo
- Monthly dues
- $625 · $7,500/yr
- Likely covers
- pool
- Assessments
- None detected in remarks — confirm with the listing agent.
Listing history 6 events
-
2026-06-18days on market $224,900 Active 7 DOM
-
2026-06-17days on market $224,900 Active 6 DOM
-
2026-06-16days on market $224,900 Active 5 DOM
-
2026-06-15days on market $224,900 Active 4 DOM
-
2026-06-13remarks 560-char remark
-
2026-06-13$224,900 Active 2 DOM
ⓘ Source: listings_history table (triggers on properties + properties_extension) + one-shot
backfill from property_details.listing_events for pre-trigger history.
Tax reassessment forecast FL · Resets to sale price
- Current annual tax
- $3,933 · $328/mo
- Projected year-2 tax
- $3,933 · $328/mo
- Expected delta
- $0/yr ($0/mo · 0.0%)
ⓘ Screening estimate from a state-policy table — verify with the county assessor before closing.
Climate risk First Street
- Flood 5/10 Major FEMA zone X (unshaded) · 23% chance over 30 yrs
- Wildfire 1/10 Low
- Heat 10/10 Extreme 7 d/yr ≥105°F today · 26 d/yr by 30 yrs out
- Wind 10/10 Extreme 99% chance of damaging wind over 30 yrs
- Air quality 2/10 Low 1 unhealthy d/yr today · 2 by 30 yrs out
Nearby sold comps map
Loading sold comps map…
Walkable amenities ~0.75 mi
Loading nearby amenities…
Taxation est. · year 1
- Rental income
- $39,749
- − Mortgage interest
- −$12,598
- − Property taxes
- −$3,933
- − Insurance
- −$1,124
- − Repairs & maintenance
- −$3,180
- − Management
- −$3,180
- − HOA
- −$7,500
- − Depreciation
- −$6,543
- Taxable income
- $1,691
- Est. tax owed @ 24.0%
- −$406
- After-tax cash flow
- $4,286/yr
For passive investors: Depreciation is non-cash, so a rental often shows a tax loss while cash-flowing — sheltering income. Rental losses are passive: they offset passive income freely, and up to $25,000/yr can offset ordinary (W-2) income if you actively participate and your MAGI is under $100k (phasing out to $0 by $150k); unused losses carry forward. On sale, claimed depreciation is recaptured at up to 25%, and gains may owe capital-gains tax (a 1031 exchange can defer both). Figures are a year-1 estimate at your 24.0% rate — not tax advice; consult a CPA.
Schools (NCES district)
- District
- Broward
- NCES district ID
- 1200180
- Math proficiency
- 42% ▼ -18.00%
- Reading proficiency
- 53% ▼ -5.00%
- Median HH income
- $52,139
- Composite
- 40.88/100
- National rank
- #3621
- State rank
- #46 of 73 in FL
Livability — Lauderdale-by-the-Sea
No livability data for this city. (Only ~50 U.S. cities are tracked.)
Census & demographics
- Census place
- Lauderdale-by-the-Sea, FL
- County
- Broward County · 1,963,430 people
- Metro
- Miami-Fort Lauderdale-Pompano Beach, FL
- Population (ZIP)
- 27,935
- Household income
- $93,879
- Rent vs Own
- Severe rent burden
- 912.0
Population outlook (Broward County) Hauer SSP2
- Today (2025)
- 2,207,033 people
- By 2030
- 2,360,704 · +7.0%
- By 2040
- 2,661,208 · +20.6%
- By 2050
- 2,946,698 · +33.5%
- By 2075
- 3,602,273 · +63.2%
- By 2100
- 3,970,984 · +79.9%
Race, ethnicity, and origin ACS 2023
- Neighborhood character
- Predominantly White (75%)
- Race & ethnicity
- White 75% Hispanic / Latino 16% Two or more races 14% Asian 3% Black 2%
- Hispanic origin (detail)
- Puerto Rican 2% Cuban 3%
- Common ancestry
- Romanian 4% Lithuanian 3% Scotch-Irish 3%
- Foreign-born
- 24% · Canada, Jamaica, Dominican Republic
- Languages at home
- 75% English-only · Spanish 14% Other Indo-European 5% Russian/Polish/Slavic 2%
Political lean MEDSL · Broward
- 2024 margin
- D (+17.0) · D 58.0% · R 41.0%
- 2008→2024 swing
- -17.8pp toward R · 2008: 34.7pp · 2024: 17.0pp
- All cycles
- 2024: D+17.0 2020: D+29.8 2016: D+35.0 2012: D+34.9 2008: D+34.7
Not yet ingested
- Civics
- —
Market trends
- HPI YoY
- ▼ -417.95%
- Current HPI
- 325.3902
- Rent YoY
- ▲ 3.63%
- Metro
- Miami-Fort Lauderdale-Pompano Beach, FL
- State GDP YoY
- ▲ 3.28%
- F500 in state
- 36
Industry mix (Fortune 500 HQ in FL)
| Industry | F500 HQs | Revenue |
|---|---|---|
| Industrial Technology | 2 | $29B |
|
||
| Insurance | 2 | $17B |
|
||
| Retail | 1 | $60B |
|
||
| Technology Distribution | 1 | $58B |
|
||
| Homebuilding | 1 | $35B |
|
||
| Technology Manufacturing | 1 | $35B |
|
||
Price history
-81.0% since first listed14 events — show timeline
- 2026-06-12 Listed for Rent $1,900 RMLSFL
- 2026-06-11 Listed $224,900 Beaches MLS
- 2025-06-01 Rental Removed $1,995 GFLMLS
- 2025-05-03 Listed for Rent $1,995 GFLMLS
- 2025-04-01 Rental Removed $1,795 GFLMLS
- 2025-02-22 Price Changed $1,795 GFLMLS
- 2025-01-01 Price Changed $1,995 GFLMLS
- 2024-09-12 Listed for Rent $2,250 GFLMLS
- 2006-04-12 Sold (Public Records) $190,000 Public Records
- 2006-03-28 Sold (MLS) $190,000 Beaches MLS
- 2006-02-24 Listing Removed — Beaches MLS
- 2006-01-12 Listed $205,000 Beaches MLS
- 1996-01-29 Sold (Public Records) $55,000 Public Records
- 1966-01-01 Sold (Public Records) $10,000 Public Records
Property tax history
+11.6%/yrLatest (2025): $3,933 · +1.6% YoY. Source: county tax records.
Cash-flow waterfall
monthlySold comps — $/sqft
last 12 mo · ≤1 miLoading sold comps…