406 Providence Dr · Brandon, MS
Flood risk 1/10 · Minimal
- FEMA flood zone
- X (unshaded)
- Chance of flooding over 30 yrs
- 0.0%
- Est. flood insurance / yr
- $507 – $1,088
Fire risk 4/10 · Minor
- Est. fire insurance / yr
- $1,241 – $2,305
Heat risk 7/10 · Major
- Hot days now (above 109°F)
- 7 days/yr
- Hot days in 30 yrs
- 20 days/yr
Wind risk 8/10 · Major
- Chance of severe wind over 30 yrs
- 80.0%
Air-quality risk 2/10 · Minimal
- Unhealthy air days now
- 1 days/yr
- Unhealthy air days in 30 yrs
- 1 days/yr
Risk factors via First Street. Map © Google.
Why this score? — see what drove the D- grade
The composite is a weighted blend of 9 inputs, each scored 0–100. Each bar is that input's sub-score; the figure is the points it added to the 100-point composite (weight × sub-score).
- ARV discount +15.0/15.0
- Cash flow +7.2/30.0
- Schools +4.6/10.0
- Rent growth +4.3/5.0
- Livability +4.0/5.0
- Condition / age +2.5/5.0
- DSCR +1.4/10.0
- 1% rule +0.9/10.0
- Appreciation +0.0/10.0
$309,000
🖨 Deal sheet 📄 Offer letter ✓ Due diligence
Listing remarks MLS
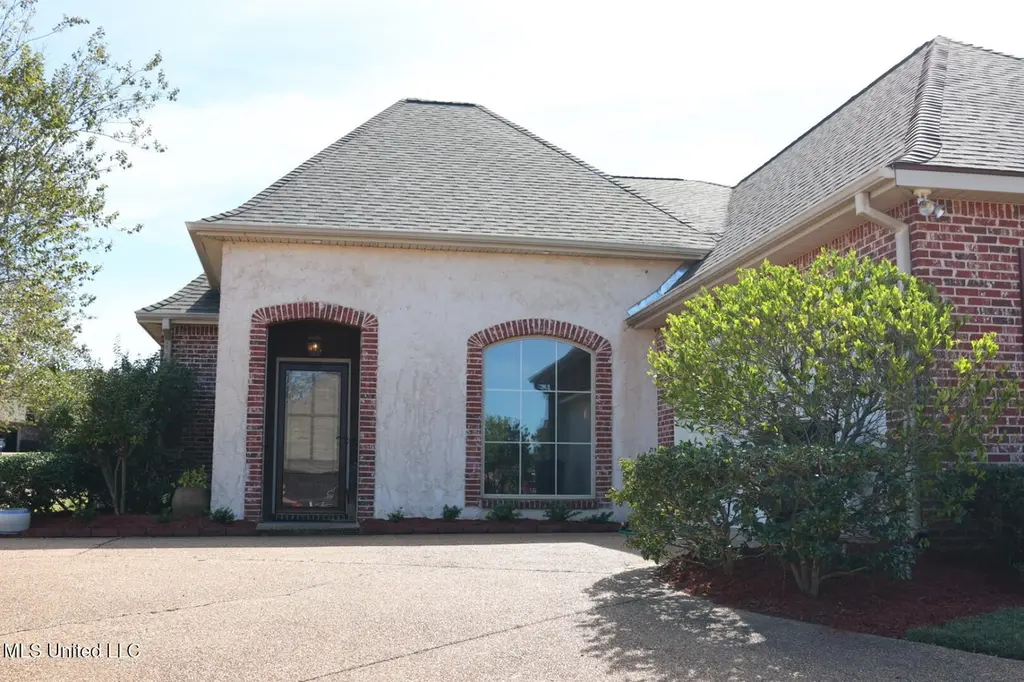
Welcome to the highly sought-after Cornerstone subdivision! This charming & well maintained 3/2 home sits perfectly on a corner lot, offering extra curb appeal and a sense of privacy. Step inside to discover a bright open floor plan designed for modern life. The seamless flow between the kitchen, dining, and living areas makes it the perfect spot for hosting friends or enjoying quiet family evenings. The primary suite offers a peaceful retreat, while the additional bedrooms provide plenty of space for guests or a home office. Located in the heart of Brandon, you're just minutes away from top-rated public and private schools, local dining, and shopping. Schedule your private tour today!
Key facts
- Open floor plan
- Primary suite
- Corner lot
Tags
Neighborhood map
What this means for you Summary
Snapshot
- This is a 3-bed/2.0-bath single-family listed at $309k.
Deal economics
- At list price, monthly cash flow is $-427 ($-5k/yr) — negative.
- To cash-flow at today's rent, offer at most $234k (24.4% below list).
- To meet the 1% rule (rent ≥ 1% of price), the offer needs to be $181k (41.5% below list).
- Recommended offer: $181k (41.5% below list) — sets the bar for 1% rule.
Location & tenants
- Location reads 81/100 on livability (#3 in MS, #1,514 nationally) — a professional / high-income tenant draw. Strengths: crime A+, employment A+, cost of living A+; Watch: amenities F, commute F.
- Rankin County School District (rural): math 56% / reading 48% proficiency, ranked #6 of 130 in MS (top 5%) — acceptable for families but not a draw, mixed tenant base, ~2y average lease.
- Market conditions: Rents rising fast (+7.1%/yr); 302 active listings in the ZIP; solid renter incomes; 343 units permitted in Rankin County in 2024 (0 in 5+ unit buildings).
Forward outlook
- Local home prices are declining (-3.0%/yr); year-one equity from $2k of loan paydown is wiped out by about $9k of value loss. Plan a longer hold.
- Rankin County population projected at +17% by 2050 — long-run rental-demand tailwind backs the buy-and-hold thesis.
Negotiation context
- It's been on market 182 days — a 12% lower offer ($272k) is reasonable based on typical stale-listing flexibility.
- 5 sale attempts since 21y ago with the ask held roughly flat each time — persistent listings suggest the price (not the market) is what's stuck; bring a comps-based counter.
Risks & watch-outs
- Climate carrying-cost: severe wind risk, 80% chance of damaging wind over 30y; extreme-heat days projected 7→20/yr by 2055 (HVAC capex compounding) — expect insurance premiums to compound above CPI over the hold.
Questions for the listing agent
- What do current leases actually rent for vs. the listed asking? Can we see a recent rent roll and the last 12 months of T-12 income?
- It's been on market 182 days. Have you received any prior offers? Is the seller open to a 41% concession, seller financing, or rate buy-down credit?
- Why hasn't it sold? Are there any deal-killer items the seller is aware of (foundation, flood, title, zoning, code violations)?
- Is there a deadline driving the sale (1031 exchange, divorce, estate, relocation)? That informs how much negotiation room exists.
- Schools are A-rated — typically a magnet for longer-tenancy family renters. What's the average tenant stay here, and is there a school-zone premium baked into asking?
- The area grade is low — what's the realistic commute time and amenity access for the typical tenant pool here? Any planned neighborhood developments (good or bad) we should know about?
- What's the average days-on-market for RENTAL listings here right now (not sales)? A rising rental-DOM trend means longer vacancies and softer asking-rent achievability than the comps imply.
- What's the recent tenant-quality profile in this submarket — average credit score on applications, eviction rate, late-payment / NSF rate, and stable-employment percentage? A property-management company in the area should have these aggregated.
- How much new for-sale + rental construction is in the pipeline within 1–3 miles? Heavy new supply typically softens prices + rents 12–24 months out; constrained supply supports both.
Investment metrics
- 1% rule
- 0.59% ✗
- Cap rate
- 4.63%
- Cash-on-cash
- -5.92%
- DSCR
- 0.74
- GRM
- 14.2
CMA / ARV
- ARV (median comp)
- $373,153
- List price
- $309,000
- Delta
- -17.19%
- Verdict
- UNDERPRICED
- Comps
- 20 within 1.0 mi
Show comp detail 10 sales within ~0.75 mi
| Address | Dist | Beds/Ba | Sqft | Sold | Price | $/sf | Match |
|---|---|---|---|---|---|---|---|
| 419 Providence Dr | 0.08mi | 3/2.0 | 1,805 (+0%) | 12mo | $324,750 | $180 | 86 |
| 503 Whistle Stop | 0.57mi | 3/2.0 | 2,004 (+11%) | 7mo | $354,900 | $177 | 49 |
| 256 Penny Ln | 0.51mi | 3/2.0 | 2,044 (+13%) | 12mo | $354,900 | $174 | 44 |
| 159 Cornerstone Dr | 0.51mi | 3/2.0 | 2,029 (+12%) | 14mo | $385,500 | $190 | 43 |
| 652 Prosperity Pl | 0.47mi | 4/3.0 (+1) | 2,006 (+11%) | 10mo | $381,900 | $190 | 42 |
| 659 Prosperity Pl | 0.49mi | 3/2.5 | 2,021 (+12%) | 16mo | $376,000 | $186 | 42 |
| 165 Cornerstone Dr | 0.54mi | 4/2.5 (+1) | 2,020 (+12%) | 10mo | $379,900 | $188 | 40 |
| 402 Caboose Ct | 0.67mi | 3/2.0 | 2,020 (+12%) | 12mo | $349,000 | $173 | 39 |
| 902 Capstone Cv | 0.49mi | 4/3.0 (+1) | 2,024 (+12%) | 19mo | $389,700 | $193 | 32 |
| 614 Wild Horse Ln | 0.73mi | 4/3.0 (+1) | 2,068 (+15%) | 24mo | $357,000 | $173 | 13 |
Match score weights: distance 35% · size 25% · config 20% · recency 20%. Top-matched comps best support the ARV.
Projected returns pro-forma
-3.0% appreciation · 7.13% rent growth · sell at horizon
- IRR
- -22.8%
- Equity multiple
- 0.20×
- Total profit
- $-69,581
- Equity at exit
- $46,073
- IRR
- -10.1%
- Equity multiple
- 0.29×
- Total profit
- $-61,214
- Equity at exit
- $26,717
Cash invested: $86,520 (down + closing). Projections, not guarantees.
Landlord ↔ Tenant lean methodology
- Overall (STATE)
- 90 Strongly Landlord-Friendly
- State Mississippi
- 90 Strongly Landlord-Friendly · R+11
- County
- — inherits STATE
- City
- — inherits STATE
ZIP-level market 39042
- Home prices YoY
- -34.3%
- Rents YoY
- 7.1%
- Active inventory
- 302
- Price-to-rent
- 14.2×
Monthly cashflow live
- Estimated rent
- $1,808 medium interval (Pro) →
- Mortgage (P&I)
- −$1,620
- Tax from tax record
- −$106 /mo · $1,277/yr
- Insurance
- −$129
- HOA
- −$0
- Vacancy / Maint / Mgmt
- −$380
- Net cashflow
- $-427
Break-even live
UW: 25.0% down · 7.5% · 30yr · 1.5% tax · 5.0% vac · 8.0% maint · 8.0% mgmt
Financing live
Cash to close
- Down payment
- $77,250
- Closing costs
- $9,270
- Reserves months
- —
- Total cash needed
- —
Loan-product check · same deal, 3 products live
Conventional
25% down · 7.5% · 30yr
- Down + closing
- —
- Monthly P&I
- —
- Monthly cashflow
- —
- DSCR
- —
- Eligible?
- —
Personal DTI + credit; lowest rate.
DSCR
20% down · 8.5% · 30yr
- Down + closing
- —
- Monthly P&I
- —
- Monthly cashflow
- —
- DSCR
- —
- Eligible?
- —
No personal income docs; deal must DSCR.
Hard money
10% down · 12.0% · 12mo
- Down + closing
- —
- Monthly P&I
- —
- Monthly cashflow
- —
- DSCR
- —
- Eligible?
- —
Short-term bridge; refi at stabilization.
Listing history 26 events
-
2026-06-18days on market $309,000 Active 182 DOM
-
2026-06-17days on market $309,000 Active 181 DOM
-
2026-06-16days on market $309,000 Active 180 DOM
-
2026-06-15days on market $309,000 Active 179 DOM
-
2026-06-14days on market $309,000 Active 177 DOM
-
2026-06-13days on market $309,000 Active 176 DOM
-
2026-06-10days on market $309,000 Active 174 DOM
-
2026-06-09days on market $309,000 Active 173 DOM
-
2026-06-08days on market $309,000 Active 172 DOM
-
2026-06-07days on market $309,000 Active 171 DOM
-
2026-06-03days on market $309,000 Active 167 DOM
-
2026-06-02days on market $309,000 Active 166 DOM
-
2026-06-01days on market $309,000 Active 165 DOM
-
2026-05-31days on market $309,000 Active 164 DOM
-
2026-05-30days on market $309,000 Active 163 DOM
-
2026-03-05price $309,000 701-char remark
Show marketing remark (701 chars)
Welcome to the highly sought-after Cornerstone subdivision! This charming & well maintained 3/2 home sits perfectly on a corner lot, offering extra curb appeal and a sense of privacy. Step inside to discover a bright open floor plan designed for modern life. The seamless flow between the kitchen, dining, and living areas makes it the perfect spot for hosting friends or enjoying quiet family evenings. The primary suite offers a peaceful retreat, while the additional bedrooms provide plenty of space for guests or a home office. Located in the heart of Brandon, you're just minutes away from top-rated public and private schools, local dining, and shopping. Schedule your private tour today!
-
2025-12-18$324,900 Active 701-char remark
Show marketing remark (701 chars)
Welcome to the highly sought-after Cornerstone subdivision! This charming & well maintained 3/2 home sits perfectly on a corner lot, offering extra curb appeal and a sense of privacy. Step inside to discover a bright open floor plan designed for modern life. The seamless flow between the kitchen, dining, and living areas makes it the perfect spot for hosting friends or enjoying quiet family evenings. The primary suite offers a peaceful retreat, while the additional bedrooms provide plenty of space for guests or a home office. Located in the heart of Brandon, you're just minutes away from top-rated public and private schools, local dining, and shopping. Schedule your private tour today!
-
2021-10-08historical
-
2016-05-09soldstatus
-
2015-10-29$208,000
-
2015-10-28historical
-
2015-07-24$214,800
-
2005-12-14soldstatus
-
2005-12-13soldstatus
-
2005-08-04$208,000
-
2005-02-06$208,000
ⓘ Source: listings_history table (triggers on properties + properties_extension) + one-shot
backfill from property_details.listing_events for pre-trigger history.
Tax reassessment forecast MS · Resets to sale price
- Current annual tax
- $1,277 · $106/mo
- Projected year-2 tax
- $2,441 · $203/mo
- Expected delta
- +$1,164/yr (+$97/mo · 91.1%)
ⓘ Screening estimate from a state-policy table — verify with the county assessor before closing.
Climate risk First Street
- Flood 1/10 Low FEMA zone X (unshaded) · 0% chance over 30 yrs
- Wildfire 4/10 Moderate
- Heat 7/10 Severe 7 d/yr ≥109°F today · 20 d/yr by 30 yrs out
- Wind 8/10 Severe 80% chance of damaging wind over 30 yrs
- Air quality 2/10 Low 1 unhealthy d/yr today · 1 by 30 yrs out
Nearby sold comps map
Loading sold comps map…
Walkable amenities ~0.75 mi
Loading nearby amenities…
Taxation est. · year 1
- Rental income
- $21,702
- − Mortgage interest
- −$17,309
- − Property taxes
- −$1,277
- − Insurance
- −$1,545
- − Repairs & maintenance
- −$1,736
- − Management
- −$1,736
- − Depreciation
- −$8,989
- Taxable loss
- −$10,891
- Est. tax savings @ 24.0%
- +$2,614
- After-tax cash flow
- $-2,509/yr
For passive investors: Depreciation is non-cash, so a rental often shows a tax loss while cash-flowing — sheltering income. Rental losses are passive: they offset passive income freely, and up to $25,000/yr can offset ordinary (W-2) income if you actively participate and your MAGI is under $100k (phasing out to $0 by $150k); unused losses carry forward. On sale, claimed depreciation is recaptured at up to 25%, and gains may owe capital-gains tax (a 1031 exchange can defer both). Figures are a year-1 estimate at your 24.0% rate — not tax advice; consult a CPA.
Schools (NCES district)
- District
- Rankin County School District
- NCES district ID
- 2803830
- Math proficiency
- 56% ▼ -4.00%
- Reading proficiency
- 48% ▼ -6.00%
- Median HH income
- $61,867
- Composite
- 45.62/100
- National rank
- #2587
- State rank
- #6 of 130 in MS
Livability — Brandon
- Score
- 81/100
- State rank
- #3
- US rank
- #1514
Category grades
Schools grade is shown separately in the Schools card above.
Census & demographics
- Census place
- Brandon, MS
- County
- Rankin County · 123,614 people
- City population
- 79,950
- Metro
- Jackson, MS
- Population (ZIP)
- 39,142
- Household income
- $88,597
- Rent vs Own
- Severe rent burden
- 474.0
Population outlook (Rankin County) Hauer SSP2
- Today (2025)
- 164,317 people
- By 2030
- 171,013 · +4.1%
- By 2040
- 182,723 · +11.2%
- By 2050
- 192,376 · +17.1%
- By 2075
- 209,535 · +27.5%
- By 2100
- 209,534 · +27.5%
Race, ethnicity, and origin ACS 2023
- Neighborhood character
- Predominantly White (75%)
- Race & ethnicity
- White 75% Black 21% Hispanic / Latino 2% Two or more races 2%
- Common ancestry
- Italian 5% Slovak 2% Iranian 2%
- Foreign-born
- 2% · Canada
- Languages at home
- 97% English-only · Spanish 2%
Political lean MEDSL · Rankin
- 2024 margin
- Solid R (+47.1) · D 25.9% · R 73.0% · Other 1.0%
- 2008→2024 swing
- +6.4pp toward D · 2008: -53.5pp · 2024: -47.1pp
- All cycles
- 2024: R+47.1 2020: R+45.4 2016: R+52.9 2012: R+51.9 2008: R+53.5
Not yet ingested
- Civics
- —
Market trends
- HPI YoY
- ▼ -90.04%
- Current HPI
- 172.5248
- Rent YoY
- ▲ 7.13%
- Metro
- Jackson, MS
- State GDP YoY
- —
- F500 in state
- 0
Price history
+48.6% since first listed11 events — show timeline
- 2026-03-05 Price Changed $309,000 MLSU
- 2025-12-18 Listed $324,900 MLSU
- 2021-10-08 Listing Removed — MLSU
- 2016-05-09 Sold (MLS) — MLSU
- 2015-10-29 Listed $208,000 MLSU
- 2015-10-28 Listing Removed — MLSU
- 2015-07-24 Listed $214,800 MLSU
- 2005-12-14 Sold (Public Records) — Public Records
- 2005-12-13 Sold (MLS) — MLSU
- 2005-08-04 Listed $208,000 MLSU
- 2005-02-06 Listed $208,000 MLSU
Property tax history
+1.4%/yrLatest (2025): $1,277 · +1.4% YoY. Source: county tax records.
Cash-flow waterfall
monthlySold comps — $/sqft
last 12 mo · ≤1 miLoading sold comps…