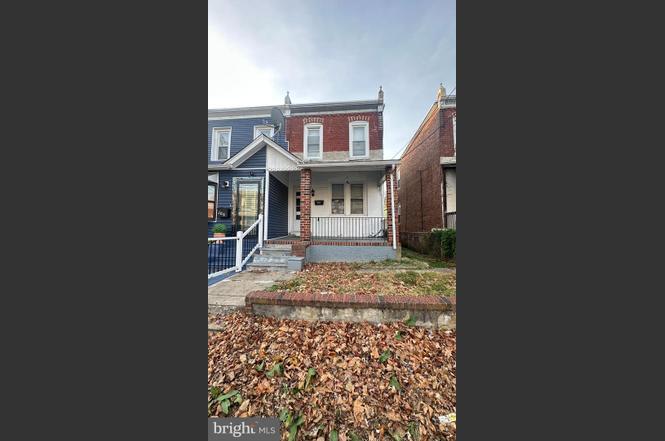
104 S 3rd St · Colwyn, PA
Flood risk 1/10 · Minimal
- FEMA flood zone
- X (unshaded)
- Chance of flooding over 30 yrs
- 0.0%
- Est. flood insurance / yr
- $473 – $860
Fire risk 1/10 · Minimal
- Est. fire insurance / yr
- $511 – $949
Heat risk 7/10 · Major
- Hot days now (above 103°F)
- 7 days/yr
- Hot days in 30 yrs
- 15 days/yr
Wind risk 6/10 · Moderate
- Chance of severe wind over 30 yrs
- 27.0%
Air-quality risk 4/10 · Minor
- Unhealthy air days now
- 3 days/yr
- Unhealthy air days in 30 yrs
- 6 days/yr
Risk factors via First Street. Map © Google.
Why this score? — see what drove the C+ grade
The composite is a weighted blend of 9 inputs, each scored 0–100. Each bar is that input's sub-score; the figure is the points it added to the 100-point composite (weight × sub-score).
- Cash flow +22.3/30.0
- ARV discount +15.0/15.0
- DSCR +7.1/10.0
- 1% rule +6.1/10.0
- Rent growth +5.0/5.0
- Livability +4.2/5.0
- Condition / age +2.5/5.0
- Schools +1.7/10.0
- Appreciation +0.0/10.0
$150,000
🖨 Deal sheet (PDF) 📄 Offer letter ✓ Due diligence
Listing remarks
3 bed, 1bath twin in Colwyn. living room, formal dinning room, kitchen on the first floor, 2nd floor has 3 bedrooms, and a hall bath. for the right buyer, seller will install new vinyl floor on 2nd floor, replace drop ceiling with sheet rock, paint the whole house, replace sewer line, all township requirements.
Key facts
- Built 1940
- Listed 9 days
Neighborhood map
What this means for you Summary
Snapshot
- This is a 3-bed/1.0-bath single-family listed at $150k.
Deal economics
- At list price, monthly cash flow is $246 ($3k/yr) — positive.
- The deal already cash-flows at list — no discount required.
- Meets the 1% rule at list price ($2k rent vs $150k).
Location & tenants
- Location reads 83/100 on livability (#119 in PA, #943 nationally) — a professional / high-income tenant draw. Strengths: crime A+, commute A+, cost of living A+; Watch: schools D.
- William Penn SD (suburban): math 11% / reading 28% proficiency, ranked #491 of 539 in PA (top 91%) — low school quality limits family demand, transient renter base, plan for 1-2y turnover; 69% free/reduced lunch — lower-income household profile, screen leases tightly.
- Market conditions: Rents rising fast (+13.1%/yr); 98 active listings in the ZIP; 25 comparable units currently listed for rent nearby; rentals at typical pace (median 21d on market — plan ~3-4 weeks tenant-placement turnaround); 299 units permitted in Delaware County in 2024 (5 in 5+ unit buildings).
- This rent runs 43% of the median local income ($46k/yr) — at the standard rent-burdened threshold; future hikes will face affordability resistance.
Forward outlook
- Local home prices are declining (-3.0%/yr); year-one equity from $1k of loan paydown is wiped out by about $4k of value loss. Plan a longer hold.
- At projected returns (-3.0% appreciation + 8.0% rent growth), your $42k cash investment doubles in ~9 years — after that, you're playing with house money.
Negotiation context
- Only 9 days on market — expect competitive offers; lowballing is unlikely to land.
- 3 sale attempts; this cycle's ask is 16% above the opening price — seller raised mid-cycle; expect resistance to lowballs.
Risks & watch-outs
- Watch-outs: built in 1940 — expect roof / HVAC / electrical / plumbing capex.
- Climate carrying-cost: major wind risk, 27% chance of damaging wind over 30y; extreme-heat days projected 7→15/yr by 2055 (HVAC capex compounding) — expect insurance premiums to compound above CPI over the hold.
Questions for the listing agent
- Built in 1940 — when were the roof, HVAC, electrical panel, plumbing, and water heater last replaced?
- Is there a deadline driving the sale (1031 exchange, divorce, estate, relocation)? That informs how much negotiation room exists.
- Schools are D-rated, which usually means shorter tenancies and higher turnover. Who's the typical renter profile here, and what's been the actual vacancy rate?
- What's the average days-on-market for RENTAL listings here right now (not sales)? A rising rental-DOM trend means longer vacancies and softer asking-rent achievability than the comps imply.
- What's the recent tenant-quality profile in this submarket — average credit score on applications, eviction rate, late-payment / NSF rate, and stable-employment percentage? A property-management company in the area should have these aggregated.
- How much new for-sale + rental construction is in the pipeline within 1–3 miles? Heavy new supply typically softens prices + rents 12–24 months out; constrained supply supports both.
Investment metrics
- 1% rule
- 1.11% ✓
- Cap rate
- 8.26%
- Cash-on-cash
- 7.04%
- DSCR
- 1.31
- GRM
- 7.5
CMA / ARV
- ARV (on-the-fly)
- $223,040
- Comps found
- 5
Show comp detail 5 sales within ~0.75 mi
| Address | Dist | Beds/Ba | Sqft | Sold | Price | $/sf | Match |
|---|---|---|---|---|---|---|---|
| 2513 S 76th St | 0.51mi | 3/2.0 | 1,264 (-4%) | 4mo | $245,000 | $194 | 63 |
| 9 N Front St | 0.21mi | 3/1.0 | 1,439 (+10%) | 15mo | $107,000 | $74 | 62 |
| 1129 Duncan | 0.62mi | 4/2.0 (+1) | 1,237 (-6%) | 12mo | $240,000 | $194 | 43 |
| 311 N 9th St | 0.54mi | 4/2.0 (+1) | 1,478 (+13%) | 12mo | $250,000 | $169 | 35 |
| 1010 Summit St | 0.65mi | 4/2.0 (+1) | 1,474 (+12%) | 14mo | $250,000 | $170 | 28 |
Match score weights: distance 35% · size 25% · config 20% · recency 20%. Top-matched comps best support the ARV.
Projected returns pro-forma
-3.0% appreciation · 8.0% rent growth · sell at horizon
- IRR
- 0.1%
- Equity multiple
- 1.01×
- Total profit
- $227
- Equity at exit
- $22,365
- IRR
- 14.5%
- Equity multiple
- 2.44×
- Total profit
- $60,612
- Equity at exit
- $12,969
Cash invested: $42,000 (down + closing). Projections, not guarantees.
Landlord ↔ Tenant lean methodology
- Overall (STATE)
- 62 Landlord-Friendly
- State Pennsylvania
- 62 Landlord-Friendly · EVEN
- County
- — inherits STATE
- City
- — inherits STATE
ZIP-level market 19023
- Rents YoY
- 13.1%
- Active inventory
- 98
- Price-to-rent
- 7.5×
Monthly cashflow live
- Estimated rent
- $1,664 high interval (Pro) →
- Mortgage (P&I)
- −$787
- Tax from tax record
- −$219 /mo · $2,628/yr
- Insurance
- −$62
- HOA
- −$0
- Vacancy / Maint / Mgmt
- −$349
- Net cashflow
- $246
Break-even live
Sensitivity live
| Price | -10% $331 | -5% $289 | +0% $246 | +5% $204 | +10% $162 |
|---|---|---|---|---|---|
| Rent | -10% $115 | -5% $181 | +0% $246 | +5% $312 | +10% $378 |
| Rate | -1.0pp $322 | -0.5pp $285 | base $246 | +0.5pp $208 | +1.0pp $168 |
UW: 25.0% down · 7.5% · 30yr · 1.5% tax · 5.0% vac · 8.0% maint · 8.0% mgmt
Financing live
Cash to close
- Down payment
- $37,500
- Closing costs
- $4,500
- Reserves months
- —
- Total cash needed
- —
Loan-product check · same deal, 3 products live
Conventional
25% down · 7.5% · 30yr
- Down + closing
- —
- Monthly P&I
- —
- Monthly cashflow
- —
- DSCR
- —
- Eligible?
- —
Personal DTI + credit; lowest rate.
DSCR
20% down · 8.5% · 30yr
- Down + closing
- —
- Monthly P&I
- —
- Monthly cashflow
- —
- DSCR
- —
- Eligible?
- —
No personal income docs; deal must DSCR.
Hard money
10% down · 12.0% · 12mo
- Down + closing
- —
- Monthly P&I
- —
- Monthly cashflow
- —
- DSCR
- —
- Eligible?
- —
Short-term bridge; refi at stabilization.
Rent comps 25 comps
| Address | Beds | Baths | Sqft | Rent | $/sqft | DOM | Units | Dist |
|---|---|---|---|---|---|---|---|---|
| 304 S 3rd St Darby, PA | 3.0 | 1.0 | 1602 | $1,695 | $1.06 | 44d | 1 | 0.18mi |
| 304 S 3rd St Darby, PA | 3.0 | 1.0 | 1602 | $1,595 | $1.00 | 21d | 1 | 0.18mi |
| 94 S 6th St Darby, PA | 3.0 | 1.5 | 1666 | $2,000 | $1.20 | 25d | 1 | 0.23mi |
| 106 N 6th St Darby, PA | 2.0 | 1.0 | 1200 | $1,550 | $1.29 | 44d | 1 | 0.29mi |
| 412 S 2nd St Darby, PA | 3.0 | 1.0 | 1190 | $1,100 | $0.92 | 6d | 1 | 0.30mi |
| 417 S 2nd St Darby, PA | 3.0 | 1.0 | 1190 | $1,020 | $0.86 | 6d | 1 | 0.33mi |
| 69 S 7th St Darby, PA | 3.0 | 2.0 | 1446 | $1,700 | $1.18 | 44d | 1 | 0.36mi |
| 700 Pine St Unit 2F Darby, PA | 2.0 | 1.0 | 1100 | $1,250 | $1.14 | 19d | 1 | 0.39mi |
| 209 Hamilton Ave Darby, PA | 4.0 | 1.0 | 1400 | $1,595 | $1.14 | 15d | 1 | 0.52mi |
| 924 Maple Ter Darby, PA | 3.0 | 1.5 | 1190 | $2,000 | $1.68 | 6d | 1 | 0.57mi |
| 935 Maple Ter Darby, PA | 3.0 | 1.0 | 1266 | $1,585 | $1.25 | 6d | 1 | 0.59mi |
| 935 Maple Ter Darby, PA | 3.0 | 1.0 | 1266 | $1,585 | $1.25 | 11d | 1 | 0.59mi |
| 909 Springfield Rd Unit D Darby, PA | 4.0 | 1.0 | 900 | $1,600 | $1.78 | 44d | 1 | 0.64mi |
| 601 Poplar St Sharon Hill, PA | 1.0–2.0 | 1.0 | 787 | $1,599 | $2.03 | 15d | 5 | 0.72mi |
| 1300 Main St Unit Basement Darby, PA | 2.0 | 1.0 | 1000 | $1,450 | $1.45 | 25d | 1 | 0.90mi |
| 2 Winthrop Rd Darby, PA | 3.0 | 1.5 | 1224 | $1,900 | $1.55 | 22d | 1 | 0.97mi |
| 37 Concord Rd Darby, PA | 3.0 | 1.0 | 1120 | $1,795 | $1.60 | 44d | 1 | 1.05mi |
| 118 Felton Ave Darby, PA | 3.0 | 1.0 | 1152 | $1,750 | $1.52 | 22d | 1 | 1.23mi |
| 826 Guenther Ave Lansdowne, PA | 2.0 | 1.0–2.0 | 800 | $1,699 | $2.12 | 25d | 1 | 1.23mi |
| 112 Juliana Ter Darby, PA | 3.0 | 1.0 | 1020 | $2,350 | $2.30 | 45d | 1 | 1.26mi |
| 112 Juliana Ter Darby, PA | 3.0 | 1.0 | 1020 | $2,450 | $2.40 | 25d | 1 | 1.26mi |
| 608 Yeadon Ave Unit 2nd Floor Yeadon, PA | 2.0 | 1.0 | 1000 | $1,400 | $1.40 | 13d | 1 | 1.36mi |
| 608 Yeadon Ave Unit 1st Floor Yeadon, PA | 2.0 | 1.0 | 1000 | $1,400 | $1.40 | 19d | 1 | 1.36mi |
| 619 Baily Rd Lansdowne, PA | 3.0 | 1.0 | 1288 | $1,850 | $1.44 | 19d | 1 | 1.38mi |
| 1200 Angora Dr Lansdowne, PA | 3.0 | 1.0 | 1530 | $2,300 | $1.50 | 6d | 1 | 1.46mi |
Listing history 9 events
-
2026-04-20status Pending
-
2026-02-11price $150,000
-
2026-02-11historical Active Under Contract
-
2026-02-02$129,000 Active
-
2026-01-30historical
-
2026-01-09status Active
-
2026-01-02historical Active Under Contract
-
2025-11-29$129,950 Active
-
2025-11-29historical
ⓘ Source: listings_history table (triggers on properties + properties_extension) + one-shot
backfill from property_details.listing_events for pre-trigger history.
Tax reassessment forecast PA · Partial reset (capped growth)
- Current annual tax
- $2,628 · $219/mo
- Projected year-2 tax
- $2,628 · $219/mo
- Expected delta
- $0/yr ($0/mo · 0.0%)
ⓘ Screening estimate from a state-policy table — verify with the county assessor before closing.
Climate risk First Street
- Flood 1/10 Low FEMA zone X (unshaded) · 0% chance over 30 yrs
- Wildfire 1/10 Low
- Heat 7/10 Severe 7 d/yr ≥103°F today · 15 d/yr by 30 yrs out
- Wind 6/10 Major 27% chance of damaging wind over 30 yrs
- Air quality 4/10 Moderate 3 unhealthy d/yr today · 6 by 30 yrs out
Nearby sold comps map
Loading sold comps map…
Walkable amenities ~0.75 mi
Loading nearby amenities…
Taxation est. · year 1
- Rental income
- $19,967
- − Mortgage interest
- −$8,402
- − Property taxes
- −$2,628
- − Insurance
- −$750
- − Repairs & maintenance
- −$1,597
- − Management
- −$1,597
- − Depreciation
- −$4,364
- Taxable income
- $629
- Est. tax owed @ 24.0%
- −$151
- After-tax cash flow
- $2,806/yr
For passive investors: Depreciation is non-cash, so a rental often shows a tax loss while cash-flowing — sheltering income. Rental losses are passive: they offset passive income freely, and up to $25,000/yr can offset ordinary (W-2) income if you actively participate and your MAGI is under $100k (phasing out to $0 by $150k); unused losses carry forward. On sale, claimed depreciation is recaptured at up to 25%, and gains may owe capital-gains tax (a 1031 exchange can defer both). Figures are a year-1 estimate at your 24.0% rate — not tax advice; consult a CPA.
Schools (NCES district)
- District
- William Penn SD
- NCES district ID
- 4226390
- Math proficiency
- 11% ▼ -3.00%
- Reading proficiency
- 28% ▼ -7.00%
- Median HH income
- $48,543
- Composite
- 17.29/100
- National rank
- #9086
- State rank
- #491 of 539 in PA
Livability — Colwyn
- Score
- 83/100
- State rank
- #119
- US rank
- #943
Category grades
Schools grade is shown separately in the Schools card above.
Census & demographics
- Census place
- Colwyn, PA
- County
- Delaware County · 399,863 people
- Metro
- Philadelphia-Camden-Wilmington, PA-NJ-DE-MD
- Population (ZIP)
- 22,247
- Household income
- $46,463
- Rent vs Own
- Severe rent burden
- 1468.0
Population outlook (Delaware County) Hauer SSP2
- Today (2025)
- 577,490 people
- By 2030
- 581,243 · +0.6%
- By 2040
- 584,700 · +1.2%
- By 2050
- 586,581 · +1.6%
- By 2075
- 598,706 · +3.7%
- By 2100
- 590,823 · +2.3%
Race, ethnicity, and origin ACS 2023
- Neighborhood character
- Predominantly Black (76%)
- Race & ethnicity
- Black 76% White 15% Two or more races 5% Hispanic / Latino 3% Asian 2%
- Common ancestry
- Swiss 5% Hispanic 1% Romanian 1%
- Foreign-born
- 18% · Canada
- Languages at home
- 84% English-only · French/Haitian/Cajun 4% Spanish 3% Other Asian/Pacific 1%
Political lean MEDSL · Delaware
- 2024 margin
- Strong D (+23.7) · D 61.4% · R 37.6% · Other 1.0%
- 2008→2024 swing
- +2.3pp toward D · 2008: 21.4pp · 2024: 23.7pp
- All cycles
- 2024: D+23.7 2020: D+26.7 2016: D+22.0 2012: D+21.8 2008: D+21.4
Not yet ingested
- Civics
- —
Market trends
- HPI YoY
- ▼ -190.50%
- Current HPI
- 277.7034
- Rent YoY
- ▲ 13.10%
- Metro
- Philadelphia-Camden-Wilmington, PA-NJ-DE-MD
- State GDP YoY
- ▲ 1.68%
- F500 in state
- 34
Industry mix (Fortune 500 HQ in PA)
| Industry | F500 HQs | Revenue |
|---|---|---|
| Healthcare | 2 | $309B |
|
||
| Insurance | 2 | $27B |
|
||
| Telecommunications / Media | 1 | $124B |
|
||
| Industrial Distribution | 1 | $22B |
|
||
| Financial Services | 1 | $20B |
|
||
| Chemicals / Materials | 1 | $18B |
|
||
Price history
+15.4% since first listed9 events — show timeline
- 2026-04-20 Pending — BRIGHT MLS
- 2026-02-11 Price Changed $150,000 BRIGHT MLS
- 2026-02-11 Contingent — BRIGHT MLS
- 2026-02-02 Listed $129,000 BRIGHT MLS
- 2026-01-30 Listing Removed — BRIGHT MLS
- 2026-01-09 Relisted — BRIGHT MLS
- 2026-01-02 Contingent — BRIGHT MLS
- 2025-11-29 Listed $129,950 BRIGHT MLS
- 2025-11-29 Coming Soon — BRIGHT MLS
Property tax history
-0.1%/yrLatest (2026): $2,628 · +5.4% YoY. Source: county tax records.
Cash-flow waterfall
monthlySold comps — $/sqft
last 12 mo · ≤1 miLoading sold comps…