 Fourplex
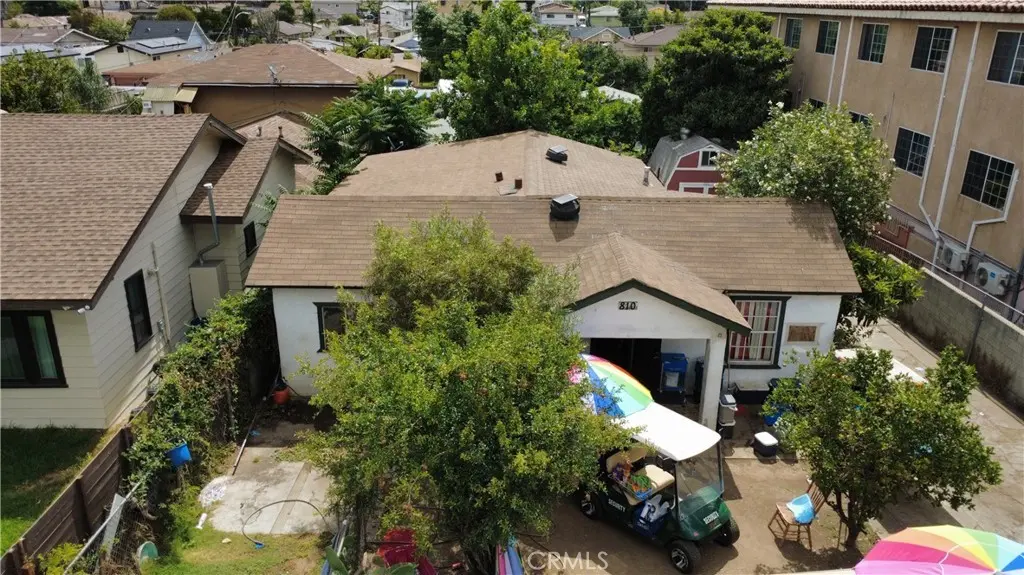
810 S Record · East Los Angeles, CA
Flood risk 1/10 · Minimal
- FEMA flood zone
- X (unshaded)
- Chance of flooding over 30 yrs
- 0.0%
- Est. flood insurance / yr
- $507 – $1,088
Fire risk 1/10 · Minimal
- Est. fire insurance / yr
- $659 – $1,223
Heat risk 6/10 · Moderate
- Hot days now (above 95°F)
- 7 days/yr
- Hot days in 30 yrs
- 21 days/yr
Wind risk 1/10 · Minimal
- Chance of severe wind over 30 yrs
- —
Air-quality risk 5/10 · Moderate
- Unhealthy air days now
- 9 days/yr
- Unhealthy air days in 30 yrs
- 9 days/yr
Risk factors via First Street. Map © Google.
Why this score? — see what drove the C+ grade
The composite is a weighted blend of 9 inputs, each scored 0–100. Each bar is that input's sub-score; the figure is the points it added to the 100-point composite (weight × sub-score).
- Cash flow +27.6/30.0
- DSCR +9.7/10.0
- ARV discount +7.5/15.0
- 1% rule +7.1/10.0
- Schools +3.6/10.0
- Livability +3.0/5.0
- Rent growth +2.6/5.0
- Condition / age +2.5/5.0
- Appreciation +0.0/10.0
$899,000
🖨 Deal sheet 📄 Offer letter ✓ Due diligence
Multi-family units
County records classify this as Multi-Family (2-4 Unit). Listing-text estimate: 4 units. confirmed
Listing remarks MLS
4 SEP HOUSES ON LARGE LOT, FRONT HOUSE IS 3BR, 2BA TOTALLY REMODELED W/ NEW ROOF, NEW CARPET, PAINT, ETC. GREAT FOR OWNER OCCUPIES. UN-INCORPORATED COUNTY , NO RENT CONTROL. SELLER IS A CA R. E LICENSEE.
Key facts
- 8,915 sq ft lot
- Built 1910
- Listed 20 days
Property features AI
Finance
- Other: Rent control applies; Property building area total: 1,855
- Financial info: Gross scheduled income and gross income: $4,600; Total actual rent: $4,600; Unit rents reported: $800, $900, $2,900 (other unit rents as listed); Net operating income: $4,600; Operating expenses reported as $1; individual expense entries minimal in feed; Trash, insurance, water/sewer listed with nominal amounts
Exterior
- Utilities: Public sewer; District/public water; Separate electric meters for each unit (4); Separate gas meters (4); One separate water meter
- Home design: Multi-unit property with 4 total units; Single-story building; No ADU
- Construction: Year built per assessor; No common walls between units; 4 buildings on the property
- Exterior features: No pool; Near public transit; Sidewalks
Interior
- Kitchen: Kitchens in each unit (details listed in remarks)
- Bedrooms: Multiple one-bedroom units (unfurnished)
- Bathrooms: Multiple full bathrooms (1–2 per unit depending on unit)
- Heating & cooling: Wall heaters; Wall/window air conditioning units
- Interior features: Ground-level entry; One-story; Carbon monoxide and smoke detectors
- Laundry & utility: On-site laundry available
Neighborhood map
What this means for you Summary
Snapshot
- This is a 1×6bd/5.0ba + 3×1bd/1.0ba units multifamily listed at $899k.
Deal economics
- At list price, monthly cash flow is $3k ($32k/yr) — positive. Per door: $674/mo.
- The deal already cash-flows at list — no discount required.
- Meets the 1% rule at list price ($11k rent vs $899k).
- Recommended offer: $886k (1.5% below list) — sets the bar for market timing.
- Cap rate 9.9% vs local median 3.7% in East Los Angeles — top-decile yield for the area; either an underpriced asset or a hidden risk that comps aren't pricing in. Stress-test before assuming the spread holds.
Location & tenants
- Location reads 60/100 on livability (#594 in CA) — a middle-class / working-renter tenant base. Strengths: commute A+, schools B+; Watch: employment C-, health & safety D, crime F.
- Los Angeles Unified (urban): math 29% / reading 54% proficiency, ranked #223 of 517 in CA (top 43%) — families likely to look elsewhere, expect single-tenant / working-renter base with shorter leases; 67% free/reduced lunch — lower-income household profile, screen leases tightly.
- Market conditions: Rents flat; 57 active listings in the ZIP; 18 comparable units currently listed for rent nearby; rentals at typical pace (median 25d on market — plan ~3-4 weeks tenant-placement turnaround); 19,697 units permitted in Los Angeles County in 2024 (9,426 in 5+ unit buildings).
- At $10,859/mo this rent would consume 221% of the median local household income ($59k/yr) (locally 2670% of renters already pay >50% of income on rent) — very limited rent-growth headroom before tenants either downsize or default.
Forward outlook
- Local home prices are declining (-3.0%/yr); year-one equity from $6k of loan paydown is wiped out by about $27k of value loss. Plan a longer hold.
- Los Angeles County population projected at +9% by 2050 — modest demand growth; plan on rents tracking national, not racing it.
Negotiation context
- It's been on market 21 days — a 2% lower offer ($886k) is reasonable based on typical stale-listing flexibility.
- 3 sale attempts since 23y ago with the ask held roughly flat each time — persistent listings suggest the price (not the market) is what's stuck; bring a comps-based counter.
- Current owner paid $420k; list at $899k implies a 114% gain — meaningful room to come down on a strong offer.
Risks & watch-outs
- Watch-outs: built in 1910 — expect roof / HVAC / electrical / plumbing capex.
- Climate carrying-cost: extreme-heat days projected 7→21/yr by 2055 (HVAC capex compounding) — expect insurance premiums to compound above CPI over the hold.
Questions for the listing agent
- Can we see the unit-by-unit rent roll, current vacancy, and any below-market leases? What's the average tenancy length?
- What capital expenditures (roof, boiler, parking lot, exteriors) have been made in the last 5 years, and what's planned in the next 2?
- Built in 1910 — when were the roof, HVAC, electrical panel, plumbing, and water heater last replaced?
- Is there a deadline driving the sale (1031 exchange, divorce, estate, relocation)? That informs how much negotiation room exists.
- Schools are B-rated — typically a magnet for longer-tenancy family renters. What's the average tenant stay here, and is there a school-zone premium baked into asking?
- Crime grade is F in this area — have there been break-ins, vandalism, or insurance claims at this property in the last 3 years? What carrier currently insures it and at what premium?
- What's the average days-on-market for RENTAL listings here right now (not sales)? A rising rental-DOM trend means longer vacancies and softer asking-rent achievability than the comps imply.
- What's the recent tenant-quality profile in this submarket — average credit score on applications, eviction rate, late-payment / NSF rate, and stable-employment percentage? A property-management company in the area should have these aggregated.
- How much new apartment / multifamily construction is in the pipeline within 1–3 miles? Heavy new supply (>2% of stock underway) typically softens rents 12–24 months out; light construction supports rent growth.
Investment metrics
- 1% rule
- 1.21% ✓
- Cap rate
- 9.89%
- Cash-on-cash
- 12.85%
- DSCR
- 1.57
- GRM
- 6.9
CMA / ARV
- ARV (on-the-fly)
- $543,660
- Comps found
- 1
Show comp detail 1 sale within ~0.75 mi
| Address | Dist | Beds/Ba | Sqft | Sold | Price | $/sf | Match |
|---|---|---|---|---|---|---|---|
| 1048 S Record Ave | 0.29mi | 2/2.0 (-1) | 1,008 (+14%) | 11mo | $620,000 | $615 | 49 |
Match score weights: distance 35% · size 25% · config 20% · recency 20%. Top-matched comps best support the ARV.
Projected returns pro-forma
-3.0% appreciation · 0.21% rent growth · sell at horizon
- IRR
- -0.4%
- Equity multiple
- 0.99×
- Total profit
- $-3,682
- Equity at exit
- $134,044
- IRR
- 6.2%
- Equity multiple
- 1.41×
- Total profit
- $102,626
- Equity at exit
- $77,729
Cash invested: $251,720 (down + closing). Projections, not guarantees.
Landlord ↔ Tenant lean methodology
- Overall (STATE)
- 18 Strongly Tenant-Friendly
- State California
- 18 Strongly Tenant-Friendly · D+13
- County
- — inherits STATE
- City
- — inherits STATE
ZIP-level market 90023
- Rents YoY
- 0.2%
- Active inventory
- 57
- Price-to-rent
- 17.0×
Monthly cashflow live
- Estimated rent
- $10,859 medium interval (Pro) →
- Mortgage (P&I)
- −$4,714
- Tax from tax record
- −$794 /mo · $9,526/yr
- Insurance
- −$375
- HOA
- −$0
- Vacancy / Maint / Mgmt
- −$2,280
- Net cashflow
- $2,696
Break-even live
4-unit breakdown (identical units grouped — click to expand)
| Units | Beds | Baths | Est. rent |
|---|---|---|---|
| 1× unit | 6 | 5 | $4,397 |
| 3× units | 1 | 1 | $6,462 |
| #2 | 1 | 1 | $2,154 |
| #3 | 1 | 1 | $2,154 |
| #4 | 1 | 1 | $2,154 |
| Total (4 units) | $10,859 | ||
UW: 25.0% down · 7.5% · 30yr · 1.5% tax · 5.0% vac · 8.0% maint · 8.0% mgmt
Financing live
Cash to close
- Down payment
- $224,750
- Closing costs
- $26,970
- Reserves months
- —
- Total cash needed
- —
Loan-product check · same deal, 3 products live
Conventional
25% down · 7.5% · 30yr
- Down + closing
- —
- Monthly P&I
- —
- Monthly cashflow
- —
- DSCR
- —
- Eligible?
- —
Personal DTI + credit; lowest rate.
DSCR
20% down · 8.5% · 30yr
- Down + closing
- —
- Monthly P&I
- —
- Monthly cashflow
- —
- DSCR
- —
- Eligible?
- —
No personal income docs; deal must DSCR.
Hard money
10% down · 12.0% · 12mo
- Down + closing
- —
- Monthly P&I
- —
- Monthly cashflow
- —
- DSCR
- —
- Eligible?
- —
Short-term bridge; refi at stabilization.
Rent comps 18 comps
| Address | Beds | Baths | Sqft | Rent | $/sqft | DOM | Units | Dist |
|---|---|---|---|---|---|---|---|---|
| 924 S Sunol Dr Unit 1/2 Los Angeles, CA | 3.0 | 2.0 | 1040 | $3,000 | $2.88 | 24d | 1 | 0.21mi |
| 1050 1/2 S Bonnie Beach Pl Los Angeles, CA | 2.0 | 1.5 | 985 | $2,562 | $2.60 | 24d | 1 | 0.29mi |
| 1140 S Record Ave Los Angeles, CA | 2.0 | 1.0 | 800 | $2,700 | $3.38 | 43d | 1 | 0.37mi |
| 3824 Princeton St Los Angeles, CA | 2.0 | 1.0 | 980 | $2,380 | $2.43 | 14d | 1 | 0.40mi |
| 1157 S Townsend Ave Los Angeles, CA | 3.0 | 1.0 | 700 | $2,775 | $3.96 | 24d | 1 | 0.55mi |
| 926 S Ford Blvd Los Angeles, CA | 3.0 | 2.0 | 1000 | $3,200 | $3.20 | 43d | 1 | 0.65mi |
| 1129 La Puerta St Los Angeles, CA | 3.0 | 1.0 | 844 | $3,600 | $4.27 | 43d | 1 | 0.78mi |
| 132 N Ditman Ave Los Angeles, CA | 3.0 | 2.0 | 1000 | $2,875 | $2.88 | 24d | 1 | 0.92mi |
| 364 S McBride Ave Los Angeles, CA | 2.0 | 1.0 | 750 | $3,250 | $4.33 | 43d | 1 | 0.93mi |
| 4091 San Carlos St Unit 4089 Los Angeles, CA | 2.0 | 1.0 | 1100 | $2,795 | $2.54 | 7d | 1 | 1.02mi |
| 4045 San Carlos St Los Angeles, CA | 2.0 | 1.0 | 700 | $2,550 | $3.64 | 7d | 1 | 1.04mi |
| 969 S Lorena St Unit 1/2 Commerce, CA | 2.0 | 2.5 | 1100 | $2,600 | $2.36 | 7d | 1 | 1.17mi |
| 969 S Lorena St Unit 1/2 Commerce, CA | 2.0 | 2.5 | 1100 | $2,600 | $2.36 | 5d | 1 | 1.17mi |
| 3466 E 8th St Los Angeles, CA | 3.0 | 1.0 | 1104 | $3,150 | $2.85 | 7d | 1 | 1.24mi |
| 1128 Clela Ave Los Angeles, CA | 2.0 | 1.0 | 620 | $2,350 | $3.79 | 24d | 1 | 1.28mi |
| 2312 Connor Ave Commerce, CA | 3.0 | 2.0 | 1125 | $3,200 | $2.84 | 1d | 1 | 1.37mi |
| 2312 Connor Ave Commerce, CA | 3.0 | 2.0 | 1125 | $3,200 | $2.84 | 17d | 1 | 1.37mi |
| 472 N Ezra St Los Angeles, CA | 4.0 | 2.0 | 1056 | $3,650 | $3.46 | 24d | 1 | 1.43mi |
Listing history 21 events
-
2026-06-18days on market $899,000 Active 21 DOM
-
2026-06-17days on market $899,000 Active 20 DOM
-
2026-06-16days on market $899,000 Active 19 DOM
-
2026-06-15days on market $899,000 Active 18 DOM
-
2026-06-13days on market $899,000 Active 16 DOM
-
2026-06-09days on market $899,000 Active 12 DOM
-
2026-06-08days on market $899,000 Active 11 DOM
-
2026-06-07days on market $899,000 Active 10 DOM
-
2026-06-04days on market $899,000 Active 7 DOM
-
2026-06-03days on market $899,000 Active 6 DOM
-
2026-06-02days on market $899,000 Active 5 DOM
-
2026-06-01days on market $899,000 Active 4 DOM
-
2026-05-31days on market $899,000 Active 3 DOM
-
2026-05-29$899,000 Active
-
2026-05-29historical $899,000
-
2004-05-04soldstatus $420,000 203-char remark
Show marketing remark (203 chars)
4 SEP HOUSES ON LARGE LOT, FRONT HOUSE IS 3BR, 2BA TOTALLY REMODELED W/ NEW ROOF, NEW CARPET, PAINT, ETC. GREAT FOR OWNER OCCUPIES. UN-INCORPORATED COUNTY , NO RENT CONTROL. SELLER IS A CA R. E LICENSEE.
-
2004-05-03soldstatus $420,000
-
2004-01-30$410,000 203-char remark
Show marketing remark (203 chars)
4 SEP HOUSES ON LARGE LOT, FRONT HOUSE IS 3BR, 2BA TOTALLY REMODELED W/ NEW ROOF, NEW CARPET, PAINT, ETC. GREAT FOR OWNER OCCUPIES. UN-INCORPORATED COUNTY , NO RENT CONTROL. SELLER IS A CA R. E LICENSEE.
-
2003-10-10historical
-
2003-07-10$389,999
-
2000-04-21soldstatus $140,000
ⓘ Source: listings_history table (triggers on properties + properties_extension) + one-shot
backfill from property_details.listing_events for pre-trigger history.
Tax reassessment forecast CA · Resets to sale price
- Current annual tax
- $9,526 · $794/mo
- Projected year-2 tax
- $9,526 · $794/mo
- Expected delta
- $0/yr ($0/mo · 0.0%)
ⓘ Screening estimate from a state-policy table — verify with the county assessor before closing.
Climate risk First Street
- Flood 1/10 Low FEMA zone X (unshaded) · 0% chance over 30 yrs
- Wildfire 1/10 Low
- Heat 6/10 Major 7 d/yr ≥95°F today · 21 d/yr by 30 yrs out
- Wind 1/10 Low
- Air quality 5/10 Major 9 unhealthy d/yr today · 9 by 30 yrs out
Nearby sold comps map
Loading sold comps map…
Walkable amenities ~0.75 mi
Loading nearby amenities…
Taxation est. · year 1
- Rental income
- $130,308
- − Mortgage interest
- −$50,358
- − Property taxes
- −$9,526
- − Insurance
- −$4,495
- − Repairs & maintenance
- −$10,425
- − Management
- −$10,425
- − Depreciation
- −$26,153
- Taxable income
- $18,927
- Est. tax owed @ 24.0%
- −$4,542
- After-tax cash flow
- $27,806/yr
For passive investors: Depreciation is non-cash, so a rental often shows a tax loss while cash-flowing — sheltering income. Rental losses are passive: they offset passive income freely, and up to $25,000/yr can offset ordinary (W-2) income if you actively participate and your MAGI is under $100k (phasing out to $0 by $150k); unused losses carry forward. On sale, claimed depreciation is recaptured at up to 25%, and gains may owe capital-gains tax (a 1031 exchange can defer both). Figures are a year-1 estimate at your 24.0% rate — not tax advice; consult a CPA.
Schools (NCES district)
- District
- Los Angeles Unified
- NCES district ID
- 0622710
- Math proficiency
- 29% ▼ -4.00%
- Reading proficiency
- 54% ▲ 10.00%
- Median HH income
- $50,403
- Composite
- 35.67/100
- National rank
- #4875
- State rank
- #223 of 517 in CA
Livability — East Los Angeles
- Score
- 60/100
- State rank
- #594
- US rank
- #19237
Category grades
Schools grade is shown separately in the Schools card above.
Census & demographics
- Census place
- East Los Angeles, CA
- County
- Los Angeles County · 9,444,647 people
- City population
- 108,740
- Metro
- Los Angeles-Long Beach-Anaheim, CA
- Population (ZIP)
- 43,857
- Household income
- $59,057
- Rent vs Own
- Severe rent burden
- 2670.0
Population outlook (Los Angeles County) Hauer SSP2
- Today (2025)
- 10,940,515 people
- By 2030
- 11,256,481 · +2.9%
- By 2040
- 11,729,929 · +7.2%
- By 2050
- 11,948,407 · +9.2%
- By 2075
- 11,818,114 · +8.0%
- By 2100
- 10,842,928 · -0.9%
Race, ethnicity, and origin ACS 2023
- Neighborhood character
- Predominantly Hispanic (96%)
- Race & ethnicity
- Hispanic / Latino 96% Two or more races 17% Native American 2% White 2%
- Hispanic origin (detail)
- Mexican 80%
- Common ancestry
- Italian 1%
- Foreign-born
- 41% · Canada, Jamaica
- Languages at home
- 16% English-only · Spanish 83%
Political lean MEDSL · Los Angeles
- 2024 margin
- Solid D (+32.9) · D 64.8% · R 31.9% · Other 3.3%
- 2008→2024 swing
- -7.4pp toward R · 2008: 40.4pp · 2024: 32.9pp
- All cycles
- 2024: D+32.9 2020: D+44.2 2016: D+48.0 2012: D+40.0 2008: D+40.4
Not yet ingested
- Civics
- —
Market trends
- HPI YoY
- ▼ -702.74%
- Current HPI
- 430.9762
- Rent YoY
- ▲ 0.21%
- Metro
- Los Angeles-Long Beach-Anaheim, CA
- State GDP YoY
- ▲ 3.21%
- F500 in state
- 116
Industry mix (Fortune 500 HQ in CA)
| Industry | F500 HQs | Revenue |
|---|---|---|
| Technology | 27 | $1,492B |
|
||
| Financial Services | 3 | $174B |
|
||
| Retail | 3 | $44B |
|
||
| Insurance | 3 | $26B |
|
||
| Media / Entertainment | 2 | $115B |
|
||
| Pharmaceuticals / Biotech | 2 | $62B |
|
||
Price history
+542.1% since first listed8 events — show timeline
- 2026-05-29 Listed $899,000 CRMLS
- 2026-05-29 Coming Soon $899,000 CRMLS
- 2004-05-04 Sold (MLS) $420,000 CRMLS
- 2004-05-03 Sold (Public Records) $420,000 Public Records
- 2004-01-30 Listed $410,000 CRMLS
- 2003-10-10 Listing Removed — CRMLS
- 2003-07-10 Listed $389,999 CRMLS
- 2000-04-21 Sold (Public Records) $140,000 Public Records
Property tax history
+2.1%/yrLatest (2025): $9,526 · +2.6% YoY. Source: county tax records.
Cash-flow waterfall
monthlySold comps — $/sqft
last 12 mo · ≤1 miLoading sold comps…