 Multi-family
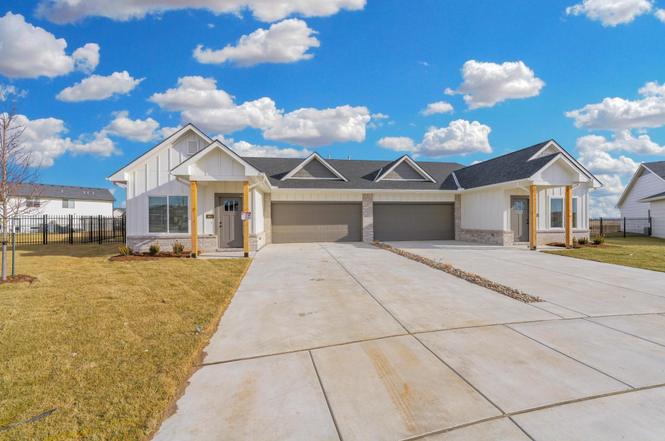
12219 W Northstar St · Maize, KS
Flood risk No data
- FEMA flood zone
- —
- Chance of flooding over 30 yrs
- —
- Est. flood insurance / yr
- —
Fire risk No data
- Est. fire insurance / yr
- —
Heat risk No data
- Hot days now (above threshold)
- —
- Hot days in 30 yrs
- —
Wind risk No data
- Chance of severe wind over 30 yrs
- —
Air-quality risk No data
- Unhealthy air days now
- —
- Unhealthy air days in 30 yrs
- —
Risk factors via First Street. Map © Google.
Why this score? — see what drove the D- grade
The composite is a weighted blend of 9 inputs, each scored 0–100. Each bar is that input's sub-score; the figure is the points it added to the 100-point composite (weight × sub-score).
- Appreciation +10.0/10.0
- ARV discount +7.5/15.0
- Cash flow +6.4/30.0
- Schools +3.8/10.0
- Livability +3.6/5.0
- Rent growth +2.5/5.0
- Condition / age +2.5/5.0
- 1% rule +2.0/10.0
- DSCR +0.7/10.0
$234,900
🖨 Deal sheet (PDF) 📄 Offer letter ✓ Due diligence
Multi-family units
County records classify this as Multi-Family (2-4 Unit). Listing-text estimate: 1 unit. estimate disagrees with records
Key facts
- Quartz countertops
- Custom beam
- Lvp flooring
Tags
Property features AI
Finance
- HOA & community: Has association; Association fee $1,080 (includes lawn service, trash, general upkeep of common areas); HOA initiation fee $200
Exterior
- Parking: 2-car garage
- Utilities: Public water; Sewer available; Natural gas available
- Home design: Duplex; One story
- Construction: Composition roof; No basement
- Exterior features: One-level home; Patio; Wrought iron fencing
Interior
- Kitchen: Dishwasher; Disposal; Microwave; Refrigerator; Range
- Bathrooms: 2 full bathrooms
- Heating & cooling: Central air conditioning (electric); Forced air heating (natural gas)
- Interior features: Storm windows; Patio; Wrought iron fencing
- Laundry & utility: Main floor laundry in a separate room with 220V equipment
Neighborhood map
What this means for you Summary
Snapshot
- This is a 3-bed/2.0-bath multifamily listed at $235k.
Deal economics
- At list price, monthly cash flow is $-410 ($-5k/yr) — negative.
- To cash-flow at today's rent, offer at most $176k (25.3% below list).
- To meet the 1% rule (rent ≥ 1% of price), the offer needs to be $165k (29.8% below list).
- Recommended offer: $165k (29.8% below list) — sets the bar for 1% rule.
Location & tenants
- Location reads 71/100 on livability (#139 in KS) — a middle-class / working-renter tenant base. Strengths: cost of living A+, housing A+, crime A; Watch: employment C-, amenities F, commute F.
- Maize (rural): math 36% / reading 45% proficiency, ranked #20 of 169 in KS (top 12%) — families likely to look elsewhere, expect single-tenant / working-renter base with shorter leases; only 14% free/reduced lunch — higher-income household profile.
- Zoned schools: Vermillion Elementary School (math 40% / reading 43%, grade F, #306 of 684 statewide, top 45%, 835 students, 25% FRL); Maize Middle School (math 25% / reading 37%, grade F, #62 of 219 statewide, top 28%, 734 students, 29% FRL); Maize Sr High (math 25% / reading 26%, grade F, #98 of 327 statewide, top 30%, 1,289 students, 26% FRL).
- Market conditions: 40 active listings in the ZIP; 7 comparable units currently listed for rent nearby; rentals at typical pace (median 16d on market — plan ~3-4 weeks tenant-placement turnaround); 2,613 units permitted in Sedgwick County in 2024 (258 in 5+ unit buildings).
Forward outlook
- In year one you build about $25k of equity ($2k loan paydown + $23k appreciation (10.0% local appreciation)).
- Sedgwick County population projected at +5% by 2050 — modest demand growth; plan on rents tracking national, not racing it.
- By year 2, paydown + projected appreciation supports a ~$40k cash-out refi (75% LTV) — recoverable capital for the next deal without selling this one.
Negotiation context
- It's been on market 139 days — a 12% lower offer ($207k) is reasonable based on typical stale-listing flexibility.
Questions for the listing agent
- What do current leases actually rent for vs. the listed asking? Can we see a recent rent roll and the last 12 months of T-12 income?
- It's been on market 139 days. Have you received any prior offers? Is the seller open to a 30% concession, seller financing, or rate buy-down credit?
- What does the HOA fee cover, when was the last increase, and are there any pending special assessments or reserve-fund shortfalls?
- Why hasn't it sold? Are there any deal-killer items the seller is aware of (foundation, flood, title, zoning, code violations)?
- Is there a deadline driving the sale (1031 exchange, divorce, estate, relocation)? That informs how much negotiation room exists.
- Schools are B-rated — typically a magnet for longer-tenancy family renters. What's the average tenant stay here, and is there a school-zone premium baked into asking?
- The area grade is low — what's the realistic commute time and amenity access for the typical tenant pool here? Any planned neighborhood developments (good or bad) we should know about?
- What's the average days-on-market for RENTAL listings here right now (not sales)? A rising rental-DOM trend means longer vacancies and softer asking-rent achievability than the comps imply.
- What's the recent tenant-quality profile in this submarket — average credit score on applications, eviction rate, late-payment / NSF rate, and stable-employment percentage? A property-management company in the area should have these aggregated.
- How much new apartment / multifamily construction is in the pipeline within 1–3 miles? Heavy new supply (>2% of stock underway) typically softens rents 12–24 months out; light construction supports rent growth.
Investment metrics
- 1% rule
- 0.70% ✗
- Cap rate
- 4.20%
- Cash-on-cash
- -7.49%
- DSCR
- 0.67
- GRM
- 11.9
CMA / ARV
No comps found within radius.
Projected returns pro-forma
10.0% appreciation · 3.0% rent growth · sell at horizon
- IRR
- 19.0%
- Equity multiple
- 2.55×
- Total profit
- $101,880
- Equity at exit
- $211,617
- IRR
- 17.6%
- Equity multiple
- 5.88×
- Total profit
- $320,731
- Equity at exit
- $456,359
Cash invested: $65,772 (down + closing). Projections, not guarantees.
Landlord ↔ Tenant lean methodology
- Overall (STATE)
- 83 Strongly Landlord-Friendly
- State Kansas
- 83 Strongly Landlord-Friendly · R+10
- County
- — inherits STATE
- City
- — inherits STATE
ZIP-level market 67223
- Home prices YoY
- 7.7%
- Active inventory
- 40
- Price-to-rent
- 11.9×
Monthly cashflow live
- Estimated rent
- $1,649 high interval (Pro) →
- Mortgage (P&I)
- −$1,232
- Tax est. 1.5%
- −$294 /mo · $3,524/yr
- Insurance
- −$98
- HOA
- −$90
- Vacancy / Maint / Mgmt
- −$346
- Net cashflow
- $-410
Break-even live
Sensitivity live
| Price | -10% $-248 | -5% $-329 | +0% $-410 | +5% $-491 | +10% $-573 |
|---|---|---|---|---|---|
| Rent | -10% $-541 | -5% $-475 | +0% $-410 | +5% $-345 | +10% $-280 |
| Rate | -1.0pp $-292 | -0.5pp $-351 | base $-410 | +0.5pp $-471 | +1.0pp $-533 |
UW: 25.0% down · 7.5% · 30yr · 1.5% tax · 5.0% vac · 8.0% maint · 8.0% mgmt
Financing live
Cash to close
- Down payment
- $58,725
- Closing costs
- $7,047
- Reserves months
- —
- Total cash needed
- —
Loan-product check · same deal, 3 products live
Conventional
25% down · 7.5% · 30yr
- Down + closing
- —
- Monthly P&I
- —
- Monthly cashflow
- —
- DSCR
- —
- Eligible?
- —
Personal DTI + credit; lowest rate.
DSCR
20% down · 8.5% · 30yr
- Down + closing
- —
- Monthly P&I
- —
- Monthly cashflow
- —
- DSCR
- —
- Eligible?
- —
No personal income docs; deal must DSCR.
Hard money
10% down · 12.0% · 12mo
- Down + closing
- —
- Monthly P&I
- —
- Monthly cashflow
- —
- DSCR
- —
- Eligible?
- —
Short-term bridge; refi at stabilization.
Rent comps 7 comps
| Address | Beds | Baths | Sqft | Rent | $/sqft | DOM | Units | Dist |
|---|---|---|---|---|---|---|---|---|
| 12198 Northstar St Wichita, KS | 3.0 | 2.0 | 1470 | $1,795 | $1.22 | 15d | 1 | 0.04mi |
| 12062 W Fennec St Wichita, KS | 3.0 | 2.0 | 1182 | $1,500 | $1.27 | 25d | 1 | 0.12mi |
| 3700 N 119th St W Wichita, KS | 3.0–5.0 | 2.0–3.0 | 1632 | $1,500 | $0.92 | 15d | 1 | 0.21mi |
| 12452 W Fennec St Wichita, KS | 4.0 | 2.0 | 1376 | $1,695 | $1.23 | 22d | 1 | 0.24mi |
| 12438 W Blanford St Wichita, KS | 4.0 | 2.0 | 1376 | $1,745 | $1.27 | 15d | 1 | 0.26mi |
| 12123 W Cora St Unit 12123 Cora Wichita, KS | 3.0 | 2.0 | 1255 | $1,495 | $1.19 | 25d | 1 | 0.45mi |
| 3540 N Maize Rd Wichita, KS | 1.0–3.0 | 1.0–2.0 | 1027 | $1,616 | $1.57 | 15d | 13 | 1.32mi |
HOA detail
- Monthly dues
- $90 · $1,080/yr
Listing history 18 events
-
2026-06-21days on market $234,900 Active 139 DOM
-
2026-06-18days on market $234,900 Active 136 DOM
-
2026-06-17days on market $234,900 Active 135 DOM
-
2026-06-16pricedays on market $234,900 Active 134 DOM
-
2026-06-15days on market $239,900 Active 133 DOM
-
2026-06-14days on market $239,900 Active 131 DOM
-
2026-06-13days on market $239,900 Active 130 DOM
-
2026-06-10days on market $239,900 Active 128 DOM
-
2026-06-09days on market $239,900 Active 127 DOM
-
2026-06-08days on market $239,900 Active 126 DOM
-
2026-06-07days on market $239,900 Active 125 DOM
-
2026-06-05days on market $239,900 Active 122 DOM
-
2026-06-03days on market $239,900 Active 121 DOM
-
2026-06-02days on market $239,900 Active 120 DOM
-
2026-06-01days on market $239,900 Active 119 DOM
-
2026-05-31days on market $239,900 Active 118 DOM
-
2026-05-30days on market $239,900 Active 117 DOM
-
2026-02-02$239,900 Active
ⓘ Source: listings_history table (triggers on properties + properties_extension) + one-shot
backfill from property_details.listing_events for pre-trigger history.
Nearby sold comps map
Loading sold comps map…
Walkable amenities ~0.75 mi
Loading nearby amenities…
Taxation est. · year 1
- Rental income
- $19,793
- − Mortgage interest
- −$13,158
- − Property taxes
- −$3,524
- − Insurance
- −$1,174
- − Repairs & maintenance
- −$1,583
- − Management
- −$1,583
- − HOA
- −$1,080
- − Depreciation
- −$6,833
- Taxable loss
- −$9,143
- Est. tax savings @ 24.0%
- +$2,194
- After-tax cash flow
- $-2,729/yr
For passive investors: Depreciation is non-cash, so a rental often shows a tax loss while cash-flowing — sheltering income. Rental losses are passive: they offset passive income freely, and up to $25,000/yr can offset ordinary (W-2) income if you actively participate and your MAGI is under $100k (phasing out to $0 by $150k); unused losses carry forward. On sale, claimed depreciation is recaptured at up to 25%, and gains may owe capital-gains tax (a 1031 exchange can defer both). Figures are a year-1 estimate at your 24.0% rate — not tax advice; consult a CPA.
Schools (NCES district)
- District
- Maize
- NCES district ID
- 2009140
- Math proficiency
- 36% ▼ -6.00%
- Reading proficiency
- 45% ▼ -4.00%
- Median HH income
- $87,686
- Composite
- 38.48/100
- National rank
- #4184
- State rank
- #20 of 169 in KS
Livability — Maize
- Score
- 71/100
- State rank
- #139
- US rank
- #6865
Category grades
Schools grade is shown separately in the Schools card above.
Census & demographics
- Census place
- Maize, KS
- City population
- 6,941
- Population (ZIP)
- 773
Population outlook (Sedgwick County) Hauer SSP2
- Today (2025)
- 537,014 people
- By 2030
- 546,984 · +1.9%
- By 2040
- 559,141 · +4.1%
- By 2050
- 562,027 · +4.7%
- By 2075
- 557,255 · +3.8%
- By 2100
- 513,383 · -4.4%
Race, ethnicity, and origin ACS 2023
- Neighborhood character
- Predominantly White (93%)
- Race & ethnicity
- White 93% Two or more races 6% Hispanic / Latino 5%
- Common ancestry
- Slovak 1% Serbian 1%
- Foreign-born
- 1% · Canada
- Languages at home
- 96% English-only · German/W. Germanic 2% Spanish 1%
Political lean MEDSL · Sedgwick
- 2024 margin
- R (+13.8) · D 42.3% · R 56.1% · Other 1.6%
- 2008→2024 swing
- -1.1pp toward R · 2008: -12.7pp · 2024: -13.8pp
- All cycles
- 2024: R+13.8 2020: R+12.6 2016: R+19.1 2012: R+19.7 2008: R+12.7
Not yet ingested
- Civics
- —
Market trends
- HPI YoY
- ▲ 11.53%
- Current HPI
- 160.75
- Rent YoY
- —
- Metro
- —
- State GDP YoY
- —
- F500 in state
- 0
Price history
1 event — show timeline
- 2026-02-02 Listed $239,900 SCKMLS as Distributed by MLS Grid
Cash-flow waterfall
monthlySold comps — $/sqft
last 12 mo · ≤1 miLoading sold comps…