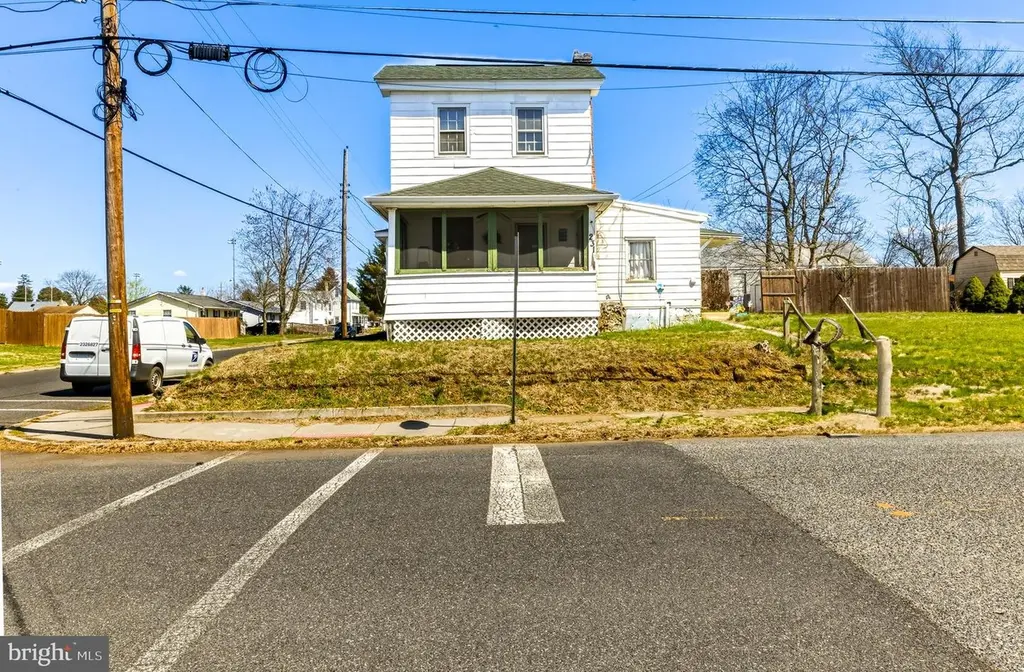
231 N Main St · Clayton, NJ
Flood risk 1/10 · Minimal
- FEMA flood zone
- X (unshaded)
- Chance of flooding over 30 yrs
- 0.0%
- Est. flood insurance / yr
- $507 – $1,088
Fire risk 4/10 · Minor
- Est. fire insurance / yr
- $526 – $976
Heat risk 7/10 · Major
- Hot days now (above 103°F)
- 7 days/yr
- Hot days in 30 yrs
- 15 days/yr
Wind risk 6/10 · Moderate
- Chance of severe wind over 30 yrs
- 62.0%
Air-quality risk 3/10 · Minor
- Unhealthy air days now
- 2 days/yr
- Unhealthy air days in 30 yrs
- 5 days/yr
Risk factors via First Street. Map © Google.
Why this score? — see what drove the B grade
The composite is a weighted blend of 9 inputs, each scored 0–100. Each bar is that input's sub-score; the figure is the points it added to the 100-point composite (weight × sub-score).
- Cash flow +26.9/30.0
- ARV discount +15.0/15.0
- DSCR +9.3/10.0
- 1% rule +8.8/10.0
- Livability +3.5/5.0
- Rent growth +2.5/5.0
- Condition / age +2.5/5.0
- Schools +2.4/10.0
- Appreciation +0.0/10.0
$165,000
🖨 Deal sheet 📄 Offer letter ✓ Due diligence
Listing remarks
Bring your vision to life! Situated on a generous corner lot in Clayton, this property is bursting with potential and waiting to be restored to its former beauty. A true fixer-upper requiring significant renovation, this is a prime opportunity for investors to create something special. With the right updates, this home could truly shine. Sold as-is.
Key facts
- Built 1900
- Listed 17 days
Property features AI
Finance
- Other: Fee simple ownership; Kick-out clause present (3 days)
Exterior
- Parking: Off-street parking; On-street parking
- Utilities: Public water; Public sewer; Electric available; Natural gas available; Sewer available; Water available
- Home design: Detached property; Year built per assessor
- Construction: Mixed construction materials; Stone foundation
- Exterior features: Lot dimensions approximately 72.60 x 0.00; Tidal water: none; Other structures above and below grade
Interior
- Bedrooms: One bedroom on the main level; Two bedrooms on the first upper level
- Bathrooms: One full bathroom (located on the first upper level)
- Heating & cooling: Wall unit heating; Natural gas heating and hot water
- Interior features: Unfinished basement; Living area per assessor
Neighborhood map
What this means for you Summary
Snapshot
- This is a 3-bed/1.0-bath single-family listed at $165k.
Deal economics
- At list price, monthly cash flow is $459 ($6k/yr) — positive.
- The deal already cash-flows at list — no discount required.
- Meets the 1% rule at list price ($2k rent vs $165k).
- Recommended offer: $163k (1.5% below list) — sets the bar for market timing.
- Cap rate 9.6% vs local median 2.9% in Clayton — top-decile yield for the area; either an underpriced asset or a hidden risk that comps aren't pricing in. Stress-test before assuming the spread holds.
Location & tenants
- Location reads 70/100 on livability (#266 in NJ) — a middle-class / working-renter tenant base. Strengths: crime A+, employment A+, housing A+; Watch: cost of living C-, schools F, amenities F.
- Clayton Public School District (suburban): math 11% / reading 40% proficiency, ranked #377 of 472 in NJ (top 80%) — low school quality limits family demand, transient renter base, plan for 1-2y turnover.
- Market conditions: 47 active listings in the ZIP; 2 comparable units currently listed for rent nearby; 1,047 units permitted in Gloucester County in 2024 (183 in 5+ unit buildings).
Forward outlook
- Local home prices are declining (-3.0%/yr); year-one equity from $1k of loan paydown is wiped out by about $5k of value loss. Plan a longer hold.
- Gloucester County population projected to shrink 5% by 2050 — rents likely to lag national; underwrite the cash flow, not the appreciation.
- At projected returns (-3.0% appreciation + 3.0% rent growth), your $46k cash investment doubles in ~10 years — after that, you're playing with house money.
Negotiation context
- It's been on market 17 days — a 2% lower offer ($163k) is reasonable based on typical stale-listing flexibility.
Risks & watch-outs
- Watch-outs: property tax is 2.9% of price; built in 1900 — expect roof / HVAC / electrical / plumbing capex.
- Climate carrying-cost: major wind risk, 62% chance of damaging wind over 30y; extreme-heat days projected 7→15/yr by 2055 (HVAC capex compounding) — expect insurance premiums to compound above CPI over the hold.
Questions for the listing agent
- Built in 1900 — when were the roof, HVAC, electrical panel, plumbing, and water heater last replaced?
- Property tax is high relative to price — has the assessment been appealed recently, and will the sale trigger a re-assessment?
- Is there a deadline driving the sale (1031 exchange, divorce, estate, relocation)? That informs how much negotiation room exists.
- Schools are F-rated, which usually means shorter tenancies and higher turnover. Who's the typical renter profile here, and what's been the actual vacancy rate?
- What's the average days-on-market for RENTAL listings here right now (not sales)? A rising rental-DOM trend means longer vacancies and softer asking-rent achievability than the comps imply.
- What's the recent tenant-quality profile in this submarket — average credit score on applications, eviction rate, late-payment / NSF rate, and stable-employment percentage? A property-management company in the area should have these aggregated.
- How much new for-sale + rental construction is in the pipeline within 1–3 miles? Heavy new supply typically softens prices + rents 12–24 months out; constrained supply supports both.
Investment metrics
- 1% rule
- 1.38% ✓
- Cap rate
- 9.63%
- Cash-on-cash
- 11.92%
- DSCR
- 1.53
- GRM
- 6.0
CMA / ARV
- ARV (on-the-fly)
- $300,348
- Comps found
- 12
Show comp detail 12 sales within ~0.75 mi
| Address | Dist | Beds/Ba | Sqft | Sold | Price | $/sf | Match |
|---|---|---|---|---|---|---|---|
| 231 N Main St | 0.00mi | 3/1.0 | 1,236 (0%) | 1mo | $165,000 | $133 | 99 |
| 18 N Vine St | 0.21mi | 3/2.0 | 1,204 (-3%) | 17mo | $192,000 | $159 | 68 |
| 208 N Vine St | 0.16mi | 3/1.0 | 1,128 (-9%) | 14mo | $275,000 | $244 | 66 |
| 58 E Academy St | 0.13mi | 3/1.5 | 1,092 (-12%) | 11mo | $325,000 | $298 | 64 |
| 101 Mathews Ln | 0.57mi | 3/1.0 | 1,304 (+6%) | 8mo | $295,000 | $226 | 57 |
| 556 S Delsea Dr | 0.69mi | 3/1.0 | 1,176 (-5%) | 9mo | $275,000 | $234 | 52 |
| 70 E Linden St | 0.28mi | 3/2.0 | 1,372 (+11%) | 15mo | $330,000 | $241 | 52 |
| 42 Walnut St | 0.60mi | 3/2.5 | 1,256 (+2%) | 15mo | $360,000 | $287 | 50 |
| 170 S Dennis Dr | 0.68mi | 3/1.0 | 1,116 (-10%) | 6mo | $315,000 | $282 | 47 |
| 21 Jerrys Ave | 0.72mi | 3/1.0 | 1,120 (-9%) | 10mo | $232,000 | $207 | 42 |
| 5 Roosevelt Blvd | 0.69mi | 3/1.0 | 1,092 (-12%) | 9mo | $265,000 | $243 | 41 |
| 340 W Clayton Ave | 0.63mi | 3/1.0 | 1,056 (-15%) | 18mo | $260,000 | $246 | 32 |
Match score weights: distance 35% · size 25% · config 20% · recency 20%. Top-matched comps best support the ARV.
Projected returns pro-forma
-3.0% appreciation · 3.0% rent growth · sell at horizon
- IRR
- 1.5%
- Equity multiple
- 1.06×
- Total profit
- $2,647
- Equity at exit
- $24,602
- IRR
- 11.2%
- Equity multiple
- 1.88×
- Total profit
- $40,572
- Equity at exit
- $14,266
Cash invested: $46,200 (down + closing). Projections, not guarantees.
Landlord ↔ Tenant lean methodology
- Overall (STATE)
- 21 Tenant-Leaning
- State New Jersey
- 21 Tenant-Leaning · D+6
- County
- — inherits STATE
- City
- — inherits STATE
ZIP-level market 08312
- Home prices YoY
- -5.3%
- Active inventory
- 47
- Price-to-rent
- 6.0×
Monthly cashflow live
- Estimated rent
- $2,274 medium interval (Pro) →
- Mortgage (P&I)
- −$865
- Tax from tax record
- −$403 /mo · $4,840/yr
- Insurance
- −$69
- HOA
- −$0
- Vacancy / Maint / Mgmt
- −$477
- Net cashflow
- $459
Break-even live
UW: 25.0% down · 7.5% · 30yr · 1.5% tax · 5.0% vac · 8.0% maint · 8.0% mgmt
Financing live
Cash to close
- Down payment
- $41,250
- Closing costs
- $4,950
- Reserves months
- —
- Total cash needed
- —
Loan-product check · same deal, 3 products live
Conventional
25% down · 7.5% · 30yr
- Down + closing
- —
- Monthly P&I
- —
- Monthly cashflow
- —
- DSCR
- —
- Eligible?
- —
Personal DTI + credit; lowest rate.
DSCR
20% down · 8.5% · 30yr
- Down + closing
- —
- Monthly P&I
- —
- Monthly cashflow
- —
- DSCR
- —
- Eligible?
- —
No personal income docs; deal must DSCR.
Hard money
10% down · 12.0% · 12mo
- Down + closing
- —
- Monthly P&I
- —
- Monthly cashflow
- —
- DSCR
- —
- Eligible?
- —
Short-term bridge; refi at stabilization.
Rent comps 2 comps
| Address | Beds | Baths | Sqft | Rent | $/sqft | DOM | Units | Dist |
|---|---|---|---|---|---|---|---|---|
| 811 N New St Clayton, NJ | 3.0 | 1.0 | 912 | $2,100 | $2.30 | 19d | 1 | 0.59mi |
| 103 Still Run Unit 3BR Clayton, NJ | 3.0 | 2.5 | 850 | $2,550 | $3.00 | 10d | 1 | 0.87mi |
Listing history 4 events
-
2026-05-12status Pending
-
2026-04-14historical Active Under Contract
-
2026-03-29$165,000 Active
-
2026-03-27historical $165,000
ⓘ Source: listings_history table (triggers on properties + properties_extension) + one-shot
backfill from property_details.listing_events for pre-trigger history.
Tax reassessment forecast NJ · Partial reset (capped growth)
- Current annual tax
- $4,840 · $403/mo
- Projected year-2 tax
- $4,840 · $403/mo
- Expected delta
- $0/yr ($0/mo · 0.0%)
ⓘ Screening estimate from a state-policy table — verify with the county assessor before closing.
Climate risk First Street
- Flood 1/10 Low FEMA zone X (unshaded) · 0% chance over 30 yrs
- Wildfire 4/10 Moderate
- Heat 7/10 Severe 7 d/yr ≥103°F today · 15 d/yr by 30 yrs out
- Wind 6/10 Major 62% chance of damaging wind over 30 yrs
- Air quality 3/10 Moderate 2 unhealthy d/yr today · 5 by 30 yrs out
Nearby sold comps map
Loading sold comps map…
Walkable amenities ~0.75 mi
Loading nearby amenities…
Taxation est. · year 1
- Rental income
- $27,285
- − Mortgage interest
- −$9,243
- − Property taxes
- −$4,840
- − Insurance
- −$825
- − Repairs & maintenance
- −$2,183
- − Management
- −$2,183
- − Depreciation
- −$4,800
- Taxable income
- $3,212
- Est. tax owed @ 24.0%
- −$771
- After-tax cash flow
- $4,736/yr
For passive investors: Depreciation is non-cash, so a rental often shows a tax loss while cash-flowing — sheltering income. Rental losses are passive: they offset passive income freely, and up to $25,000/yr can offset ordinary (W-2) income if you actively participate and your MAGI is under $100k (phasing out to $0 by $150k); unused losses carry forward. On sale, claimed depreciation is recaptured at up to 25%, and gains may owe capital-gains tax (a 1031 exchange can defer both). Figures are a year-1 estimate at your 24.0% rate — not tax advice; consult a CPA.
Schools (NCES district)
- District
- Clayton Public School District
- NCES district ID
- 3403180
- Math proficiency
- 11% ▼ -13.00%
- Reading proficiency
- 40% ▲ 1.00%
- Median HH income
- $64,513
- Composite
- 23.74/100
- National rank
- #7822
- State rank
- #377 of 472 in NJ
Livability — Clayton
- Score
- 70/100
- State rank
- #266
- US rank
- #7860
Category grades
Schools grade is shown separately in the Schools card above.
Census & demographics
- Census place
- Clayton, NJ
- City population
- 8,395
- Population (ZIP)
- 8,395
Population outlook (Gloucester County) Hauer SSP2
- Today (2025)
- 298,895 people
- By 2030
- 299,031 · +0.0%
- By 2040
- 294,020 · -1.6%
- By 2050
- 284,188 · -4.9%
- By 2075
- 260,720 · -12.8%
- By 2100
- 229,565 · -23.2%
Race, ethnicity, and origin ACS 2023
- Neighborhood character
- Predominantly White (65%)
- Race & ethnicity
- White 65% Black 21% Hispanic / Latino 9% Two or more races 5%
- Hispanic origin (detail)
- Mexican 3% Puerto Rican 6%
- Common ancestry
- Romanian 8% Lithuanian 3% Scandinavian 3%
- Foreign-born
- 4% · Canada
- Languages at home
- 88% English-only · Spanish 9% French/Haitian/Cajun 1% Other Indo-European 1%
Political lean MEDSL · Gloucester
- 2024 margin
- Toss-up / Even · D 47.8% · R 50.6% · Other 1.6%
- 2008→2024 swing
- -15.0pp toward R · 2008: 12.2pp · 2024: -2.8pp
- All cycles
- 2024: R+2.8 2020: D+1.9 2016: R+0.4 2012: D+10.5 2008: D+12.2
Not yet ingested
- Civics
- —
Market trends
- HPI YoY
- ▼ -16.24%
- Current HPI
- 289.6808
- Rent YoY
- —
- Metro
- —
- State GDP YoY
- ▲ 2.05%
- F500 in state
- 34
Industry mix (Fortune 500 HQ in NJ)
| Industry | F500 HQs | Revenue |
|---|---|---|
| Consumer Goods | 3 | $31B |
|
||
| Pharmaceuticals | 2 | $153B |
|
||
| Technology | 2 | $21B |
|
||
| Insurance | 2 | $20B |
|
||
| Healthcare | 2 | $19B |
|
||
| Financial Services | 1 | $70B |
|
||
Price history
+0.0% since first listed4 events — show timeline
- 2026-05-12 Pending — BRIGHT MLS
- 2026-04-14 Contingent — BRIGHT MLS
- 2026-03-29 Listed $165,000 BRIGHT MLS
- 2026-03-27 Coming Soon $165,000 BRIGHT MLS
Property tax history
+2.0%/yrLatest (2025): $4,840 · +3.8% YoY. Source: county tax records.
Cash-flow waterfall
monthlySold comps — $/sqft
last 12 mo · ≤1 miLoading sold comps…