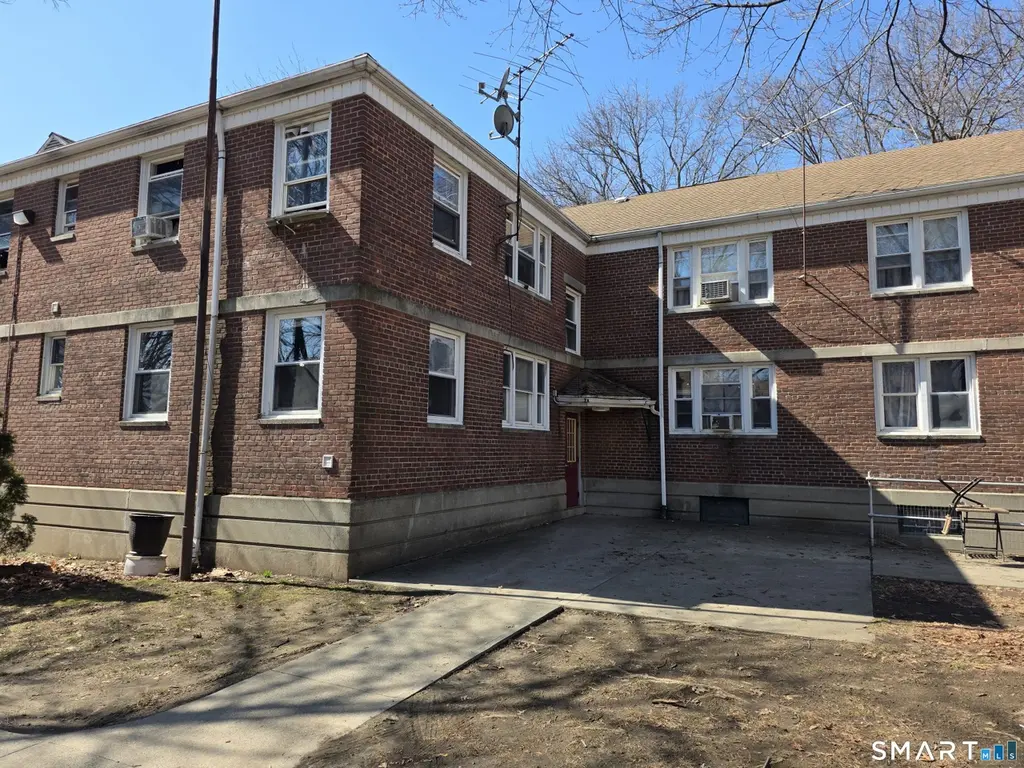
340 Success Ave Bldg 89 14 · Bridgeport, CT
Flood risk 1/10 · Minimal
- FEMA flood zone
- X (unshaded)
- Chance of flooding over 30 yrs
- 0.0%
- Est. flood insurance / yr
- $507 – $1,088
Fire risk 1/10 · Minimal
- Est. fire insurance / yr
- $829 – $1,539
Heat risk 6/10 · Moderate
- Hot days now (above 97°F)
- 7 days/yr
- Hot days in 30 yrs
- 15 days/yr
Wind risk 6/10 · Moderate
- Chance of severe wind over 30 yrs
- 51.0%
Air-quality risk 4/10 · Minor
- Unhealthy air days now
- 5 days/yr
- Unhealthy air days in 30 yrs
- 7 days/yr
Risk factors via First Street. Map © Google.
Why this score? — see what drove the B- grade
The composite is a weighted blend of 9 inputs, each scored 0–100. Each bar is that input's sub-score; the figure is the points it added to the 100-point composite (weight × sub-score).
- Cash flow +30.0/30.0
- 1% rule +10.0/10.0
- DSCR +10.0/10.0
- ARV discount +5.6/15.0
- Livability +4.0/5.0
- Rent growth +2.5/5.0
- Condition / age +2.2/5.0
- Schools +1.2/10.0
- Appreciation +0.0/10.0
$59,900
🖨 Deal sheet 📄 Offer letter ✓ Due diligence
Listing remarks MLS
Ideal opportunity, move in condition 2 bedroom coop! Heat, hot water, taxes are included in the common charges. Cash only, minimum approximate credit score 650, and $4,000.00 per month income.
Key facts
- $640 HOA
- Built 1940
- Listed 98 days
Neighborhood map
What this means for you Summary
Snapshot
- This is a 2-bed/1.0-bath condo listed at $60k. Condition is rated fair.
Deal economics
- At list price, monthly cash flow is $321 ($4k/yr) — positive.
- The deal already cash-flows at list — no discount required.
- Meets the 1% rule at list price ($2k rent vs $60k).
- Recommended offer: $55k (9.0% below list) — sets the bar for market timing.
- Cap rate 12.7% vs local median 5.0% in Bridgeport — top-decile yield for the area; either an underpriced asset or a hidden risk that comps aren't pricing in. Stress-test before assuming the spread holds.
Location & tenants
- Location reads 81/100 on livability (#15 in CT, #1,374 nationally) — a professional / high-income tenant draw. Strengths: amenities A+, commute A+, health & safety A+; Watch: crime C-, employment D+, schools D-.
- Bridgeport School District (urban): math 9% / reading 19% proficiency, ranked #151 of 153 in CT (top 99%) — low school quality limits family demand, transient renter base, plan for 1-2y turnover; 97% free/reduced lunch — lower-income household profile, screen leases tightly.
- Market conditions: 68 active listings in the ZIP; 23 comparable units currently listed for rent nearby; rentals at typical pace (median 19d on market — plan ~3-4 weeks tenant-placement turnaround); 852 units permitted in Greater Bridgeport Planning Region in 2024 (698 in 5+ unit buildings).
- This rent runs 40% of the median local income ($52k/yr) — at the standard rent-burdened threshold; future hikes will face affordability resistance.
Forward outlook
- Local home prices are declining (-3.0%/yr); year-one equity from $414 of loan paydown is wiped out by about $2k of value loss. Plan a longer hold.
- At projected returns (-3.0% appreciation + 3.0% rent growth), your $17k cash investment doubles in ~6 years — after that, you're playing with house money.
Negotiation context
- It's been on market 98 days — a 9% lower offer ($55k) is reasonable based on typical stale-listing flexibility.
- 4 sale attempts since 21y ago with the ask held roughly flat each time — persistent listings suggest the price (not the market) is what's stuck; bring a comps-based counter.
Risks & watch-outs
- Watch-outs: HOA is 37% of rent; built in 1940 — expect roof / HVAC / electrical / plumbing capex.
- Climate carrying-cost: major wind risk, 51% chance of damaging wind over 30y; extreme-heat days projected 7→15/yr by 2055 (HVAC capex compounding) — expect insurance premiums to compound above CPI over the hold.
Questions for the listing agent
- It's been on market 98 days. Have you received any prior offers? Is the seller open to a 9% concession, seller financing, or rate buy-down credit?
- Have any recent inspections been done? Can we get a copy of the seller's disclosures and any deferred-maintenance estimates?
- Built in 1940 — when were the roof, HVAC, electrical panel, plumbing, and water heater last replaced?
- What does the HOA fee cover, when was the last increase, and are there any pending special assessments or reserve-fund shortfalls?
- Any open or pending special assessments — roof, HVAC, plumbing, elevator, façade? What's the per-unit balance and payoff schedule, and is the seller paying it off at close or rolling it to the buyer?
- Why hasn't it sold? Are there any deal-killer items the seller is aware of (foundation, flood, title, zoning, code violations)?
- Is there a deadline driving the sale (1031 exchange, divorce, estate, relocation)? That informs how much negotiation room exists.
- Schools are D-rated, which usually means shorter tenancies and higher turnover. Who's the typical renter profile here, and what's been the actual vacancy rate?
- What's the average days-on-market for RENTAL listings here right now (not sales)? A rising rental-DOM trend means longer vacancies and softer asking-rent achievability than the comps imply.
- What's the recent tenant-quality profile in this submarket — average credit score on applications, eviction rate, late-payment / NSF rate, and stable-employment percentage? A property-management company in the area should have these aggregated.
- How much new apartment / multifamily construction is in the pipeline within 1–3 miles? Heavy new supply (>2% of stock underway) typically softens rents 12–24 months out; light construction supports rent growth.
Investment metrics
- 1% rule
- 2.91% ✓
- Cap rate
- 12.73%
- Cash-on-cash
- 22.97%
- DSCR
- 2.02
- GRM
- 2.9
CMA / ARV
- ARV (median comp)
- $57,466
- List price
- $59,900
- Delta
- 4.24%
- Verdict
- FAIR
- Comps
- 20 within 1.0 mi
Projected returns pro-forma
-3.0% appreciation · 3.0% rent growth · sell at horizon
- IRR
- 16.4%
- Equity multiple
- 1.67×
- Total profit
- $11,163
- Equity at exit
- $8,931
- IRR
- 25.3%
- Equity multiple
- 3.25×
- Total profit
- $37,757
- Equity at exit
- $5,179
Cash invested: $16,772 (down + closing). Projections, not guarantees.
Landlord ↔ Tenant lean methodology
- Overall (STATE)
- 27 Tenant-Leaning
- State Connecticut
- 27 Tenant-Leaning · D+7
- County
- — inherits STATE
- City
- — inherits STATE
ZIP-level market 06610
- Home prices YoY
- -7.5%
- Active inventory
- 68
- Price-to-rent
- 2.9×
Monthly cashflow live
- Estimated rent
- $1,741 high interval (Pro) →
- Mortgage (P&I)
- −$314
- Tax est. 1.5%
- −$75 /mo · $898/yr
- Insurance
- −$25
- HOA
- −$640
- Vacancy / Maint / Mgmt
- −$366
- Net cashflow
- $321
Break-even live
UW: 25.0% down · 7.5% · 30yr · 1.5% tax · 5.0% vac · 8.0% maint · 8.0% mgmt
Financing live
Cash to close
- Down payment
- $14,975
- Closing costs
- $1,797
- Reserves months
- —
- Total cash needed
- —
Loan-product check · same deal, 3 products live
Conventional
25% down · 7.5% · 30yr
- Down + closing
- —
- Monthly P&I
- —
- Monthly cashflow
- —
- DSCR
- —
- Eligible?
- —
Personal DTI + credit; lowest rate.
DSCR
20% down · 8.5% · 30yr
- Down + closing
- —
- Monthly P&I
- —
- Monthly cashflow
- —
- DSCR
- —
- Eligible?
- —
No personal income docs; deal must DSCR.
Hard money
10% down · 12.0% · 12mo
- Down + closing
- —
- Monthly P&I
- —
- Monthly cashflow
- —
- DSCR
- —
- Eligible?
- —
Short-term bridge; refi at stabilization.
Rent comps 23 comps
| Address | Beds | Baths | Sqft | Rent | $/sqft | DOM | Units | Dist |
|---|---|---|---|---|---|---|---|---|
| 250 N Bishop Ave #19 Bridgeport, CT | 1.0 | 1.0 | 638 | $1,650 | $2.59 | 43d | 1 | 0.14mi |
| 250 N Bishop Ave #1 Bridgeport, CT | 1.0 | 1.0 | 583 | $1,650 | $2.83 | 11d | 1 | 0.14mi |
| 250 N Bishop Ave Bridgeport, CT | 1.0 | 1.0 | 611 | $1,425 | $2.33 | 23d | 2 | 0.14mi |
| 235 Henry Ave Unit 12E Stratford, CT | 1.0 | 1.0 | 692 | $1,695 | $2.45 | 10d | 1 | 0.27mi |
| 86 Birdsey St Unit 3R Bridgeport, CT | 1.0 | 1.0 | 650 | $1,350 | $2.08 | 43d | 1 | 0.41mi |
| 192 Peace St Unit 1st floor Stratford, CT | 2.0 | 1.0 | 712 | $2,000 | $2.81 | 43d | 1 | 0.63mi |
| 600 Bond St Unit 112 Bridgeport, CT | 1.0 | 1.0 | 545 | $2,250 | $4.13 | 43d | 1 | 0.64mi |
| 1150 Ogden Street Ext Unit 102 Bridgeport, CT | 1.0 | 1.0 | 700 | $1,425 | $2.04 | 14d | 1 | 0.76mi |
| 556 Hollister St Stratford, CT | 1.0–2.0 | 1.0 | 725 | $2,295 | $3.17 | 11d | 4 | 0.79mi |
| 1525 Central Ave Bridgeport, CT | 1.0 | 1.0 | 625 | $1,550 | $2.48 | 43d | 3 | 0.90mi |
| 231 Goddard Ave Unit 3RD Bridgeport, CT | 2.0 | 1.0 | 618 | $1,700 | $2.75 | 3d | 1 | 1.04mi |
| 1254 Pembroke St Unit 1st Floor Bridgeport, CT | 2.0 | 1.0 | 738 | $1,850 | $2.51 | 14d | 1 | 1.15mi |
| 145 Cowles St Unit B7 Bridgeport, CT | 1.0 | 1.0 | 600 | $1,325 | $2.21 | 3d | 1 | 1.19mi |
| 186 Louisiana Ave Unit D Bridgeport, CT | 1.0 | 1.0 | 650 | $1,700 | $2.62 | 21d | 1 | 1.23mi |
| 647 Union Ave Unit 2 Bridgeport, CT | 2.0 | 1.0 | 750 | $1,675 | $2.23 | 3d | 1 | 1.26mi |
| 1333 E Main St Apt 1 Bridgeport, CT | 2.0 | 1.0 | 700 | $1,700 | $2.43 | 3d | 1 | 1.29mi |
| 1333 E Main St #5 Bridgeport, CT | 2.0 | 1.0 | 700 | $1,650 | $2.36 | 3d | 1 | 1.29mi |
| 154 Virginia Ave Unit B Bridgeport, CT | 1.0 | 1.0 | 650 | $1,800 | $2.77 | 43d | 1 | 1.30mi |
| 498 Sherwood Pl Stratford, CT | 3.0 | 1.0–2.0 | 984 | $2,622 | $2.66 | 21d | 5 | 1.46mi |
| 3699 Broadbridge Ave #101 Stratford, CT | 1.0 | 1.0 | 680 | $1,700 | $2.50 | 23d | 1 | 1.48mi |
| 3699 Broadbridge Ave #101 Stratford, CT | 1.0 | 1.0 | 680 | $1,700 | $2.50 | 43d | 1 | 1.48mi |
| 855 Main St Bridgeport, CT | 1.0 | 1.0 | 490 | $2,380 | $4.86 | 3d | 10 | 1.49mi |
| 855 Main St Bridgeport, CT | 1.0 | 1.0 | 490 | $2,380 | $4.86 | 19d | 10 | 1.49mi |
HOA detail condo
- Monthly dues
- $640 · $7,680/yr
- Likely covers
- water
- Assessments
- None detected in remarks — confirm with the listing agent.
Listing history 22 events
-
2026-06-18days on market $59,900 Active 98 DOM
-
2026-06-17days on market $59,900 Active 97 DOM
-
2026-06-16days on market $59,900 Active 96 DOM
-
2026-06-15days on market $59,900 Active 95 DOM
-
2026-06-13days on market $59,900 Active 93 DOM
-
2026-06-13days on market $59,900 Active 92 DOM
-
2026-06-10days on market $59,900 Active 90 DOM
-
2026-06-09days on market $59,900 Active 89 DOM
-
2026-06-08days on market $59,900 Active 88 DOM
-
2026-06-07days on market $59,900 Active 87 DOM
-
2026-06-05days on market $59,900 Active 84 DOM
-
2026-06-03days on market $59,900 Active 83 DOM
-
2026-06-03days on market $59,900 Active 82 DOM
-
2026-06-01days on market $59,900 Active 81 DOM
-
2026-05-31days on market $59,900 Active 80 DOM
-
2026-03-10$59,900 Active 192-char remark
Show marketing remark (192 chars)
Ideal opportunity, move in condition 2 bedroom coop! Heat, hot water, taxes are included in the common charges. Cash only, minimum approximate credit score 650, and $4,000.00 per month income.
-
2006-11-14soldstatus $69,000 213-char remark
Show marketing remark (213 chars)
Completely Remodeled First Floor Ranch Style, 2 Bdr,1 Bath New Kitchen W/New Appl. New Bath W/Marble Floor And New Til E, New Paint, New Pergo Floors. Heat, Hot Water & Taxes Incl In Comm.Charges
-
2006-10-02$74,900 213-char remark
Show marketing remark (213 chars)
Completely Remodeled First Floor Ranch Style, 2 Bdr,1 Bath New Kitchen W/New Appl. New Bath W/Marble Floor And New Til E, New Paint, New Pergo Floors. Heat, Hot Water & Taxes Incl In Comm.Charges
-
2006-09-28historical
-
2006-03-29$79,900
-
2005-12-23soldstatus $30,000
-
2005-05-24$52,000
ⓘ Source: listings_history table (triggers on properties + properties_extension) + one-shot
backfill from property_details.listing_events for pre-trigger history.
Climate risk First Street
- Flood 1/10 Low FEMA zone X (unshaded) · 0% chance over 30 yrs
- Wildfire 1/10 Low
- Heat 6/10 Major 7 d/yr ≥97°F today · 15 d/yr by 30 yrs out
- Wind 6/10 Major 51% chance of damaging wind over 30 yrs
- Air quality 4/10 Moderate 5 unhealthy d/yr today · 7 by 30 yrs out
Nearby sold comps map
Loading sold comps map…
Walkable amenities ~0.75 mi
Loading nearby amenities…
Taxation est. · year 1
- Rental income
- $20,887
- − Mortgage interest
- −$3,355
- − Property taxes
- −$898
- − Insurance
- −$300
- − Repairs & maintenance
- −$1,671
- − Management
- −$1,671
- − HOA
- −$7,680
- − Depreciation
- −$1,743
- Taxable income
- $3,569
- Est. tax owed @ 24.0%
- −$857
- After-tax cash flow
- $2,996/yr
For passive investors: Depreciation is non-cash, so a rental often shows a tax loss while cash-flowing — sheltering income. Rental losses are passive: they offset passive income freely, and up to $25,000/yr can offset ordinary (W-2) income if you actively participate and your MAGI is under $100k (phasing out to $0 by $150k); unused losses carry forward. On sale, claimed depreciation is recaptured at up to 25%, and gains may owe capital-gains tax (a 1031 exchange can defer both). Figures are a year-1 estimate at your 24.0% rate — not tax advice; consult a CPA.
Condition & rehab AI · 6 photos
This property requires moderate renovations to update the kitchen and bathroom, and a fresh coat of exterior paint to improve its curb appeal and overall condition.
Repairs flagged
- Major kitchen appliances — dated and worn
- Major bathroom fixtures — dated and worn
- Moderate exterior paint — some discoloration
Value-add opportunities
- Resale new kitchen appliances — modernizes the space and appeals to buyers
- Resale new bathroom fixtures — modernizes the space and appeals to buyers
- Resale exterior paint — enhances curb appeal and property value
Renovation cost estimate screening
| Repair item | Severity | Est. cost |
|---|---|---|
| kitchen appliances · dated and worn | Major | $15,000–50,000 |
| bathroom fixtures · dated and worn | Major | $15,000–50,000 |
| exterior paint · some discoloration | Moderate | $3,000–15,000 |
| Total estimated repair cost · 3 items | $33,000–115,000 |
Value-add ROI direction
- Resale new kitchen appliances — modernizes the space and appeals to buyers ↑
- Resale new bathroom fixtures — modernizes the space and appeals to buyers ↑
- Resale exterior paint — enhances curb appeal and property value ↑
ⓘ Cost ranges are severity-bucket heuristics (US national rule-of-thumb). Get contractor quotes + a written scope before underwriting a rehab budget.
Schools (NCES district)
- District
- Bridgeport School District
- NCES district ID
- 0900450
- Math proficiency
- 9% ▼ -7.00%
- Reading proficiency
- 19% ▼ -10.00%
- Median HH income
- $41,507
- Composite
- 12.09/100
- National rank
- #9656
- State rank
- #151 of 153 in CT
Livability — Bridgeport
- Score
- 81/100
- State rank
- #15
- US rank
- #1374
Category grades
Schools grade is shown separately in the Schools card above.
Census & demographics
- Census place
- Bridgeport, CT
- County
- Fairfield County · 765,532 people
- City population
- 149,153
- Metro
- Bridgeport-Stamford-Norwalk, CT
- Population (ZIP)
- 22,020
- Household income
- $51,634
- Rent vs Own
- Severe rent burden
- 1368.0
Population outlook (Greater Bridgeport County) Hauer SSP2
- By 2040
- 365,581
Race, ethnicity, and origin ACS 2023
- Neighborhood character
- Diverse neighborhood (Simpson 0.65)
- Race & ethnicity
- Hispanic / Latino 51% Black 23% White 20% Two or more races 14% Asian 3% Native American 1%
- Hispanic origin (detail)
- Mexican 3% Puerto Rican 30% Dominican 6%
- Common ancestry
- Romanian 4% Estonian 3% Hispanic 2%
- Foreign-born
- 31% · Canada, Jamaica, Vietnam
- Languages at home
- 47% English-only · Spanish 40% Other Indo-European 5% Russian/Polish/Slavic 3%
Political lean MEDSL · Greater Bridgeport
- 2024 margin
- Strong D (+23.3) · D 60.9% · R 37.6% · Other 1.5%
- All cycles
- 2024: D+23.3
Not yet ingested
- Civics
- —
Market trends
- HPI YoY
- ▼ -29.78%
- Current HPI
- 370.1432
- Rent YoY
- —
- Metro
- Bridgeport-Stamford-Norwalk, CT
- State GDP YoY
- ▲ 1.06%
- F500 in state
- 38
Industry mix (Fortune 500 HQ in CT)
| Industry | F500 HQs | Revenue |
|---|---|---|
| Industrial Machinery | 4 | $38B |
|
||
| Insurance | 3 | $71B |
|
||
| Financial Services | 2 | $25B |
|
||
| Transportation / Logistics | 2 | $18B |
|
||
| Healthcare | 1 | $247B |
|
||
| Telecommunications | 1 | $55B |
|
||
Price history
+15.2% since first listed7 events — show timeline
- 2026-03-10 Listed $59,900 Smart MLS
- 2006-11-14 Sold (MLS) $69,000 Smart MLS
- 2006-10-02 Listed $74,900 Smart MLS
- 2006-09-28 Listing Removed — Smart MLS
- 2006-03-29 Listed $79,900 Smart MLS
- 2005-12-23 Sold (MLS) $30,000 Smart MLS
- 2005-05-24 Listed $52,000 Smart MLS
Cash-flow waterfall
monthlySold comps — $/sqft
last 12 mo · ≤1 miLoading sold comps…