 Duplex
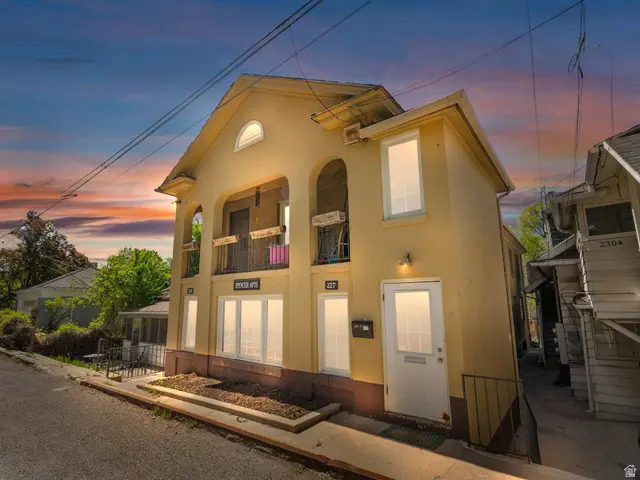
227 N Spencer Ct · Salt Lake City, UT
Flood risk 10/10 · Severe
- FEMA flood zone
- X (unshaded)
- Chance of flooding over 30 yrs
- 0.99%
- Est. flood insurance / yr
- $507 – $1,088
Fire risk 6/10 · Moderate
- Est. fire insurance / yr
- $453 – $841
Heat risk 4/10 · Minor
- Hot days now (above 94°F)
- 6 days/yr
- Hot days in 30 yrs
- 15 days/yr
Wind risk 1/10 · Minimal
- Chance of severe wind over 30 yrs
- —
Air-quality risk 4/10 · Minor
- Unhealthy air days now
- 5 days/yr
- Unhealthy air days in 30 yrs
- 7 days/yr
Risk factors via First Street. Map © Google.
Why this score? — see what drove the F grade
The composite is a weighted blend of 9 inputs, each scored 0–100. Each bar is that input's sub-score; the figure is the points it added to the 100-point composite (weight × sub-score).
- ARV discount +7.5/15.0
- Condition / age +4.0/5.0
- Livability +3.8/5.0
- Rent growth +2.9/5.0
- Schools +2.9/10.0
- Cash flow +0.0/30.0
- 1% rule +0.0/10.0
- DSCR +0.0/10.0
- Appreciation +0.0/10.0
$3,599,999
🖨 Deal sheet 📄 Offer letter ✓ Due diligence
Multi-family units
County records classify this as Multi-Family (5+ Unit). Listing-text estimate: 2 units. estimate disagrees with records
5+ unit building — per-unit beds/baths from public records are typically unavailable; the breakdown below (if shown) is an estimate from the listing text.
Listing remarks
Spencer Court Apartments is a unique 22-unit multifamily community comprised of six smaller multi-family buildings nestled in one of Salt Lake City's most sought-after neighborhoods. The property boasts a proven operational history with strong rental performance and healthy NOI, currently offered at an attractive 6.3% in-place cap rate with compelling price-per-unit metrics. There is significant opportunity to improve asset quality, push rents, and drive meaningful appreciation. Do not disturb tenants. Buyer to obtain independent measurements and verify all information independently.
Key facts
- 0.58 acre lot
- Parking
- Built 1916
Property features AI
Finance
- Financial info: 22 total units; Actual rent (building/unit data): $27,496
Exterior
- Parking: Open/uncovered parking; Carport (1 space); 1 covered parking/carport space, 1 total parking space
- Utilities: Natural gas connected; Electricity connected; Public sewer connected; Water connected (culinary)
- Home design: Multi-family property; Residential use
- Construction: Built in 2010; Brick and stucco construction; Asphalt and membrane roof; Property is built and standing
- Exterior features: Mountain view; Mature trees on the property
Interior
- Bedrooms: Total building bedrooms: 30 (multi-unit total)
- Flooring: Hardwood; Tile; Concrete
- Bathrooms: Total building bathrooms: 22 (multi-unit total)
- Interior features: Blinds; Hardwood, tile, and concrete floors
Neighborhood map
What this means for you Summary
Snapshot
- This is a 2 × 3-bed/1-bath units multifamily listed at $3.60M. Condition is rated good.
Deal economics
- At list price, monthly cash flow is $-21k ($-257k/yr) — negative. Per door: $-11k/mo.
- To cash-flow at today's rent, offer at most $498k (86.2% below list).
- To meet the 1% rule (rent ≥ 1% of price), the offer needs to be $444k (87.7% below list).
- Recommended offer: $444k (87.7% below list) — sets the bar for 1% rule.
Location & tenants
- Location reads 75/100 on livability (#64 in UT, #3,994 nationally) — a middle-class / working-renter tenant base. Strengths: amenities A+, commute A+, housing A; Watch: cost of living D+, crime F.
- Salt Lake District (urban): math 30% / reading 37% proficiency, ranked #65 of 80 in UT (top 81%) — families likely to look elsewhere, expect single-tenant / working-renter base with shorter leases.
- Zoned schools: Ensign School (math 67% / reading 67%, grade B+, #15 of 585 statewide, top 3%, 313 students, 13% FRL); Clayton Middle (math 47% / reading 50%, grade C-, #35 of 138 statewide, top 26%, 634 students, 24% FRL); West High (math 33% / reading 60%, grade D-, #38 of 171 statewide, top 24%, 2,600 students, 51% FRL) — zoned schools average 29% FRL vs 57% district-wide (28 pts lower); this property's tenant base skews higher-income than the district average.
- Zoned-school proficiency averages 54% at this address vs 34% district-wide (+20 pts) — the actual schools serving this property are materially stronger than the Salt Lake District average implies; a family-tenant draw the district grade alone would hide.
- Market conditions: Rents rising (+1.6%/yr); 205 active listings in the ZIP; solid renter incomes; 4,970 units permitted in Salt Lake County in 2024 (1,963 in 5+ unit buildings).
- At $4,440/mo this rent would consume 63% of the median local household income ($84k/yr) (locally 1273% of renters already pay >50% of income on rent) — very limited rent-growth headroom before tenants either downsize or default.
Forward outlook
- Local home prices are declining (-3.0%/yr); year-one equity from $25k of loan paydown is wiped out by about $108k of value loss. Plan a longer hold.
- Salt Lake County population projected at +37% by 2050 — long-run rental-demand tailwind backs the buy-and-hold thesis.
Negotiation context
- It's been on market 69 days — a 6% lower offer ($3.38M) is reasonable based on typical stale-listing flexibility.
Risks & watch-outs
- Watch-outs: flood insurance adds $66/mo; built in 1916 — expect roof / HVAC / electrical / plumbing capex.
- Climate carrying-cost: severe flood risk; major wildfire risk — expect insurance premiums to compound above CPI over the hold.
Questions for the listing agent
- What do current leases actually rent for vs. the listed asking? Can we see a recent rent roll and the last 12 months of T-12 income?
- It's been on market 69 days. Have you received any prior offers? Is the seller open to a 88% concession, seller financing, or rate buy-down credit?
- Can we see the unit-by-unit rent roll, current vacancy, and any below-market leases? What's the average tenancy length?
- What capital expenditures (roof, boiler, parking lot, exteriors) have been made in the last 5 years, and what's planned in the next 2?
- Built in 1916 — when were the roof, HVAC, electrical panel, plumbing, and water heater last replaced?
- What's the actual annual flood-insurance premium (NFIP or private), and is the property in a SFHA with mandatory coverage?
- Why hasn't it sold? Are there any deal-killer items the seller is aware of (foundation, flood, title, zoning, code violations)?
- Is there a deadline driving the sale (1031 exchange, divorce, estate, relocation)? That informs how much negotiation room exists.
- Crime grade is F in this area — have there been break-ins, vandalism, or insurance claims at this property in the last 3 years? What carrier currently insures it and at what premium?
- The area grade is low — what's the realistic commute time and amenity access for the typical tenant pool here? Any planned neighborhood developments (good or bad) we should know about?
- What's the average days-on-market for RENTAL listings here right now (not sales)? A rising rental-DOM trend means longer vacancies and softer asking-rent achievability than the comps imply.
- What's the recent tenant-quality profile in this submarket — average credit score on applications, eviction rate, late-payment / NSF rate, and stable-employment percentage? A property-management company in the area should have these aggregated.
- How much new apartment / multifamily construction is in the pipeline within 1–3 miles? Heavy new supply (>2% of stock underway) typically softens rents 12–24 months out; light construction supports rent growth.
Investment metrics
- 1% rule
- 0.12% ✗
- Cap rate
- -0.83%
- Cash-on-cash
- -25.44%
- DSCR
- -0.13
- GRM
- 67.6
CMA / ARV
No comps found within radius.
Projected returns pro-forma
-3.0% appreciation · 1.57% rent growth · sell at horizon
- IRR
- -74.6%
- Equity multiple
- -0.94×
- Total profit
- $-1,954,920
- Equity at exit
- $536,772
- IRR
- —
- Equity multiple
- -2.46×
- Total profit
- $-3,485,124
- Equity at exit
- $311,262
Cash invested: $1,008,000 (down + closing). Projections, not guarantees.
Landlord ↔ Tenant lean methodology
- Overall (STATE)
- 86 Strongly Landlord-Friendly
- State Utah
- 86 Strongly Landlord-Friendly · R+15
- County
- — inherits STATE
- City
- — inherits STATE
ZIP-level market 84103
- Rents YoY
- 1.6%
- Active inventory
- 205
- Price-to-rent
- 135.1×
Monthly cashflow live
- Estimated rent
- $4,440 medium interval (Pro) →
- Mortgage (P&I)
- −$18,879
- Tax est. 1.5%
- −$4,500 /mo · $54,000/yr
- Insurance
- −$1,500
- Flood insurance flood zone
- −$66 /mo · $798/yr
- HOA
- −$0
- Vacancy / Maint / Mgmt
- −$932
- Net cashflow
- $-21,438
Break-even live
2-unit breakdown (identical units grouped — click to expand)
| Units | Beds | Baths | Est. rent |
|---|---|---|---|
| 2× units | 3 | 1 | $4,440 |
| #1 | 3 | 1 | $2,220 |
| #2 | 3 | 1 | $2,220 |
| Total (2 units) | $4,440 | ||
UW: 25.0% down · 7.5% · 30yr · 1.5% tax · 5.0% vac · 8.0% maint · 8.0% mgmt
Financing live
Cash to close
- Down payment
- $900,000
- Closing costs
- $108,000
- Reserves months
- —
- Total cash needed
- —
Loan-product check · same deal, 3 products live
Conventional
25% down · 7.5% · 30yr
- Down + closing
- —
- Monthly P&I
- —
- Monthly cashflow
- —
- DSCR
- —
- Eligible?
- —
Personal DTI + credit; lowest rate.
DSCR
20% down · 8.5% · 30yr
- Down + closing
- —
- Monthly P&I
- —
- Monthly cashflow
- —
- DSCR
- —
- Eligible?
- —
No personal income docs; deal must DSCR.
Hard money
10% down · 12.0% · 12mo
- Down + closing
- —
- Monthly P&I
- —
- Monthly cashflow
- —
- DSCR
- —
- Eligible?
- —
Short-term bridge; refi at stabilization.
Listing history 15 events
-
2026-06-18days on market $3,599,999 Active 69 DOM
-
2026-06-17days on market $3,599,999 Active 68 DOM
-
2026-06-16days on market $3,599,999 Active 67 DOM
-
2026-06-15days on market $3,599,999 Active 66 DOM
-
2026-06-13days on market $3,599,999 Active 64 DOM
-
2026-06-13days on market $3,599,999 Active 63 DOM
-
2026-06-09days on market $3,599,999 Active 60 DOM
-
2026-06-08days on market $3,599,999 Active 59 DOM
-
2026-06-07days on market $3,599,999 Active 58 DOM
-
2026-06-05days on market $3,599,999 Active 55 DOM
-
2026-06-03days on market $3,599,999 Active 54 DOM
-
2026-06-02days on market $3,599,999 Active 53 DOM
-
2026-06-01days on market $3,599,999 Active 52 DOM
-
2026-05-31days on market $3,599,999 Active 51 DOM
-
2026-04-10$3,599,999 Active
ⓘ Source: listings_history table (triggers on properties + properties_extension) + one-shot
backfill from property_details.listing_events for pre-trigger history.
Climate risk First Street
- Flood 10/10 Extreme FEMA zone X (unshaded) · 99% chance over 30 yrs
- Wildfire 6/10 Major
- Heat 4/10 Moderate 6 d/yr ≥94°F today · 15 d/yr by 30 yrs out
- Wind 1/10 Low
- Air quality 4/10 Moderate 5 unhealthy d/yr today · 7 by 30 yrs out
Nearby sold comps map
Loading sold comps map…
Walkable amenities ~0.75 mi
Loading nearby amenities…
Taxation est. · year 1
- Rental income
- $53,280
- − Mortgage interest
- −$201,656
- − Property taxes
- −$54,000
- − Insurance
- −$18,797
- − Repairs & maintenance
- −$4,262
- − Management
- −$4,262
- − Depreciation
- −$104,727
- Taxable loss
- −$334,425
- Est. tax savings @ 24.0%
- +$80,262
- After-tax cash flow
- $-176,990/yr
For passive investors: Depreciation is non-cash, so a rental often shows a tax loss while cash-flowing — sheltering income. Rental losses are passive: they offset passive income freely, and up to $25,000/yr can offset ordinary (W-2) income if you actively participate and your MAGI is under $100k (phasing out to $0 by $150k); unused losses carry forward. On sale, claimed depreciation is recaptured at up to 25%, and gains may owe capital-gains tax (a 1031 exchange can defer both). Figures are a year-1 estimate at your 24.0% rate — not tax advice; consult a CPA.
Condition & rehab AI · 8 photos
Spencer Court Apartments is a well-maintained, 22-unit multifamily property in a sought-after neighborhood. It offers a good investment opportunity with potential for rental and resale value increases through minor cosmetic upgrades.
Value-add opportunities
- Both Painting and minor landscaping improvements — Enhances curb appeal and interior aesthetics
- Both New flooring in common areas — Improves aesthetics and functionality
- Both Upgrading HVAC systems — Enhances comfort and energy efficiency
Renovation cost estimate screening
Value-add ROI direction
- Both Painting and minor landscaping improvements — Enhances curb appeal and interior aesthetics ↑
- Both New flooring in common areas — Improves aesthetics and functionality ↑
- Both Upgrading HVAC systems — Enhances comfort and energy efficiency ↑
ⓘ Cost ranges are severity-bucket heuristics (US national rule-of-thumb). Get contractor quotes + a written scope before underwriting a rehab budget.
Schools (NCES district)
- District
- Salt Lake District
- NCES district ID
- 4900870
- Math proficiency
- 30% ▼ -13.00%
- Reading proficiency
- 37% ▼ -6.00%
- Median HH income
- $47,550
- Composite
- 28.85/100
- National rank
- #6645
- State rank
- #65 of 80 in UT
Livability — Salt Lake City
- Score
- 75/100
- State rank
- #64
- US rank
- #3994
Category grades
Schools grade is shown separately in the Schools card above.
Census & demographics
- Census place
- Salt Lake City, UT
- County
- Salt Lake County · 1,195,750 people
- City population
- 172,615
- Metro
- Salt Lake City, UT
- Population (ZIP)
- 23,749
- Household income
- $83,916
- Rent vs Own
- Severe rent burden
- 1273.0
Population outlook (Salt Lake County) Hauer SSP2
- Today (2025)
- 1,305,860 people
- By 2030
- 1,402,611 · +7.4%
- By 2040
- 1,594,533 · +22.1%
- By 2050
- 1,787,244 · +36.9%
- By 2075
- 2,224,138 · +70.3%
- By 2100
- 2,551,390 · +95.4%
Race, ethnicity, and origin ACS 2023
- Neighborhood character
- Predominantly White (79%)
- Race & ethnicity
- White 79% Hispanic / Latino 10% Two or more races 9% Asian 3% Black 2%
- Hispanic origin (detail)
- Mexican 5%
- Common ancestry
- Slovak 5% Italian 3% Portuguese 3%
- Foreign-born
- 11% · Canada, China, Jamaica
- Languages at home
- 88% English-only · Spanish 5% Other Indo-European 3% Other Asian/Pacific 1%
Political lean MEDSL · Salt Lake
- 2024 margin
- D (+10.2) · D 53.7% · R 43.5% · Other 2.8%
- 2008→2024 swing
- +10.1pp toward D · 2008: 0.1pp · 2024: 10.2pp
- All cycles
- 2024: D+10.2 2020: D+11.0 2016: D+10.2 2012: R+19.3 2008: D+0.1
Not yet ingested
- Civics
- —
Market trends
- HPI YoY
- ▼ -623.62%
- Current HPI
- 276.3149
- Rent YoY
- ▲ 1.57%
- Metro
- Salt Lake City, UT
- State GDP YoY
- ▲ 3.54%
- F500 in state
- 2
Industry mix (Fortune 500 HQ in UT)
| Industry | F500 HQs | Revenue |
|---|---|---|
| Financial Services | 1 | $3B |
|
||
Price history
1 event — show timeline
- 2026-04-10 Listed $3,599,999 WFRMLS
Cash-flow waterfall
monthlySold comps — $/sqft
last 12 mo · ≤1 miLoading sold comps…