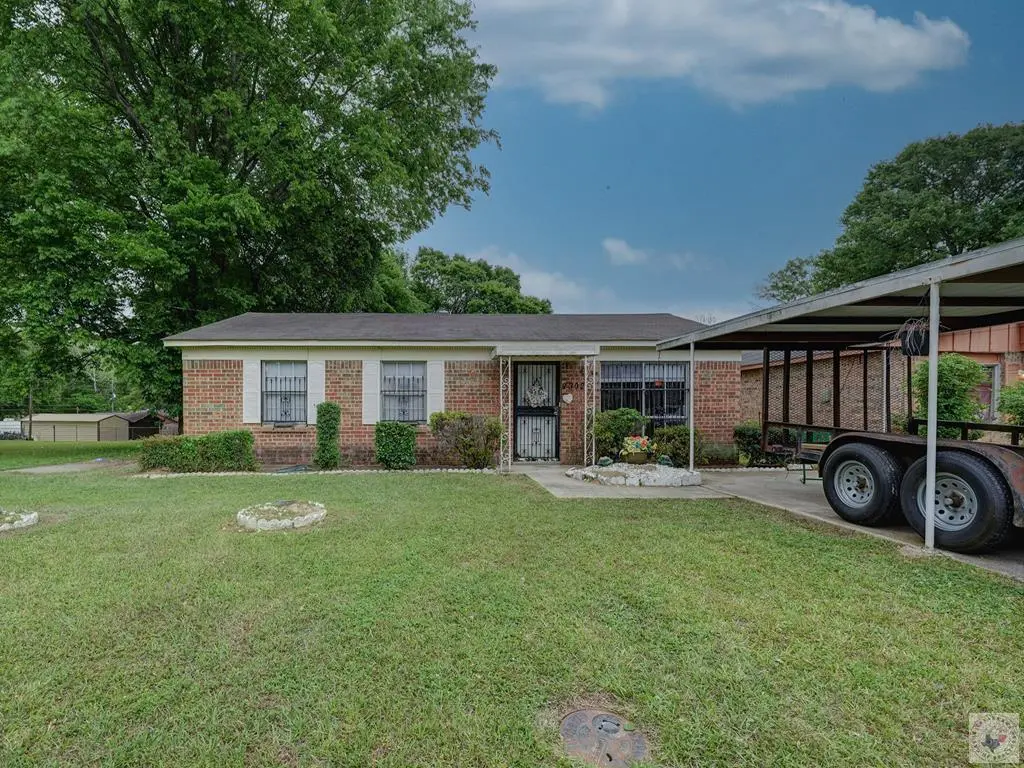
2302 Bell St · Texarkana, TX
Flood risk 1/10 · Minimal
- FEMA flood zone
- X (unshaded)
- Chance of flooding over 30 yrs
- 0.0%
- Est. flood insurance / yr
- $507 – $1,088
Fire risk 1/10 · Minimal
- Est. fire insurance / yr
- $1,222 – $2,270
Heat risk 7/10 · Major
- Hot days now (above 112°F)
- 7 days/yr
- Hot days in 30 yrs
- 22 days/yr
Wind risk 6/10 · Moderate
- Chance of severe wind over 30 yrs
- 27.0%
Air-quality risk 2/10 · Minimal
- Unhealthy air days now
- 0 days/yr
- Unhealthy air days in 30 yrs
- 1 days/yr
Risk factors via First Street. Map © Google.
Why this score? — see what drove the B- grade
The composite is a weighted blend of 9 inputs, each scored 0–100. Each bar is that input's sub-score; the figure is the points it added to the 100-point composite (weight × sub-score).
- Cash flow +30.0/30.0
- DSCR +10.0/10.0
- 1% rule +9.9/10.0
- ARV discount +7.5/15.0
- Livability +3.9/5.0
- Schools +3.2/10.0
- Rent growth +2.9/5.0
- Condition / age +2.5/5.0
- Appreciation +0.0/10.0
$74,900
🖨 Deal sheet (PDF) 📄 Offer letter ✓ Due diligence
Listing remarks
Move-in ready- with 3 bedroom, 1 bath, 1 car carport, covered patio, fenced backyard- call for your private showing today.
Key facts
- Covered patio
- Fenced backyard
- 4,791 sq ft lot
Tags
Property features AI
Exterior
- Parking: Detached carport (covered) with 1 covered parking space — total 1 parking space
- Utilities: Public water; Public sewer
- Home design: Single-family residence; One story; Brick and vinyl siding exterior; Slab foundation
- Construction: Shingle roof
- Exterior features: Covered patio/porch; Chain link fence; Concrete road frontage on a city street
Interior
- Flooring: Vinyl
- Bathrooms: 1 full bathroom
- Heating & cooling: Window unit cooling
- Interior features: Blinds on windows; Vinyl flooring
Neighborhood map
What this means for you Summary
Snapshot
- This is a 3-bed/1.0-bath single-family listed at $75k.
Deal economics
- At list price, monthly cash flow is $392 ($5k/yr) — positive.
- The deal already cash-flows at list — no discount required.
- Meets the 1% rule at list price ($1k rent vs $75k).
- Recommended offer: $73k (3.0% below list) — sets the bar for market timing.
- Cap rate 12.6% vs local median 4.3% in Texarkana — top-decile yield for the area; either an underpriced asset or a hidden risk that comps aren't pricing in. Stress-test before assuming the spread holds.
Location & tenants
- Location reads 77/100 on livability (#93 in TX, #3,241 nationally) — a middle-class / working-renter tenant base. Strengths: cost of living A+, housing A+, health & safety A+; Watch: amenities D+, crime D, employment D.
- Texarkana ISD (urban): math 36% / reading 41% proficiency, ranked #472 of 826 in TX (top 57%) — families likely to look elsewhere, expect single-tenant / working-renter base with shorter leases; 64% free/reduced lunch — lower-income household profile, screen leases tightly.
- Zoned schools: Theron Jones Early Literacy Center (386 students, 98% FRL); Texas Middle (math 35% / reading 41%, grade F, #717 of 1,662 statewide, top 44%, 1,413 students, 75% FRL); Texas H S (math 39% / reading 52%, grade D-, #634 of 1,632 statewide, top 39%, 1,719 students, 62% FRL).
- Market conditions: Rents rising (+1.6%/yr); 326 active listings in the ZIP; 1 comparable units currently listed for rent nearby; 137 units permitted in Bowie County in 2024 (5 in 5+ unit buildings).
Forward outlook
- Local home prices are declining (-3.0%/yr); year-one equity from $518 of loan paydown is wiped out by about $2k of value loss. Plan a longer hold.
- At projected returns (-3.0% appreciation + 1.6% rent growth), your $21k cash investment doubles in ~6 years — after that, you're playing with house money.
Negotiation context
- It's been on market 43 days — a 3% lower offer ($73k) is reasonable based on typical stale-listing flexibility.
Risks & watch-outs
- Climate carrying-cost: major wind risk, 27% chance of damaging wind over 30y; extreme-heat days projected 7→22/yr by 2055 (HVAC capex compounding) — expect insurance premiums to compound above CPI over the hold.
Questions for the listing agent
- It's been on market 43 days. Have you received any prior offers? Is the seller open to a 3% concession, seller financing, or rate buy-down credit?
- Built in 1970 — when were the roof, HVAC, electrical panel, plumbing, and water heater last replaced?
- Is there a deadline driving the sale (1031 exchange, divorce, estate, relocation)? That informs how much negotiation room exists.
- Schools are D-rated, which usually means shorter tenancies and higher turnover. Who's the typical renter profile here, and what's been the actual vacancy rate?
- Crime grade is D in this area — have there been break-ins, vandalism, or insurance claims at this property in the last 3 years? What carrier currently insures it and at what premium?
- What's the average days-on-market for RENTAL listings here right now (not sales)? A rising rental-DOM trend means longer vacancies and softer asking-rent achievability than the comps imply.
- What's the recent tenant-quality profile in this submarket — average credit score on applications, eviction rate, late-payment / NSF rate, and stable-employment percentage? A property-management company in the area should have these aggregated.
- How much new for-sale + rental construction is in the pipeline within 1–3 miles? Heavy new supply typically softens prices + rents 12–24 months out; constrained supply supports both.
Investment metrics
- 1% rule
- 1.49% ✓
- Cap rate
- 12.57%
- Cash-on-cash
- 22.41%
- DSCR
- 2.00
- GRM
- 5.6
CMA / ARV
- ARV (median comp)
- $34,029
- List price
- $74,900
- Delta
- 120.10%
- Verdict
- OVERPRICED
- Comps
- 7 within 1.0 mi
Show comp detail 2 sales within ~0.75 mi
| Address | Dist | Beds/Ba | Sqft | Sold | Price | $/sf | Match |
|---|---|---|---|---|---|---|---|
| 1625 W 18th St | 0.42mi | 2/1.0 (-1) | 912 (-8%) | 4mo | $29,988 | $33 | 60 |
| 514 Connella St | 0.61mi | 2/1.0 (-1) | 864 (-13%) | 8mo | $46,439 | $54 | 39 |
Match score weights: distance 35% · size 25% · config 20% · recency 20%. Top-matched comps best support the ARV.
Projected returns pro-forma
-3.0% appreciation · 1.63% rent growth · sell at horizon
- IRR
- 13.7%
- Equity multiple
- 1.54×
- Total profit
- $11,286
- Equity at exit
- $11,168
- IRR
- 21.5%
- Equity multiple
- 2.71×
- Total profit
- $35,885
- Equity at exit
- $6,476
Cash invested: $20,972 (down + closing). Projections, not guarantees.
Landlord ↔ Tenant lean methodology
- Overall (STATE)
- 87 Strongly Landlord-Friendly
- State Texas
- 87 Strongly Landlord-Friendly · R+5
- County
- — inherits STATE
- City
- — inherits STATE
ZIP-level market 75501
- Home prices YoY
- -34.9%
- Rents YoY
- 1.6%
- Active inventory
- 326
- Price-to-rent
- 5.6×
Monthly cashflow live
- Estimated rent
- $1,116 medium interval (Pro) →
- Mortgage (P&I)
- −$393
- Tax from tax record
- −$66 /mo · $792/yr
- Insurance
- −$31
- HOA
- −$0
- Lot rent
- −$0
- Vacancy / Maint / Mgmt
- −$234
- Net cashflow
- $392
Break-even live
Sensitivity live
| Price | -10% $434 | -5% $413 | +0% $392 | +5% $370 | +10% $349 |
|---|---|---|---|---|---|
| Rent | -10% $303 | -5% $348 | +0% $392 | +5% $436 | +10% $480 |
| Rate | -1.0pp $429 | -0.5pp $411 | base $392 | +0.5pp $372 | +1.0pp $352 |
UW: 25.0% down · 7.5% · 30yr · 1.5% tax · 5.0% vac · 8.0% maint · 8.0% mgmt
Financing live
Cash to close
- Down payment
- $18,725
- Closing costs
- $2,247
- Reserves months
- —
- Total cash needed
- —
Loan-product check · same deal, 3 products live
Conventional
25% down · 7.5% · 30yr
- Down + closing
- —
- Monthly P&I
- —
- Monthly cashflow
- —
- DSCR
- —
- Eligible?
- —
Personal DTI + credit; lowest rate.
DSCR
20% down · 8.5% · 30yr
- Down + closing
- —
- Monthly P&I
- —
- Monthly cashflow
- —
- DSCR
- —
- Eligible?
- —
No personal income docs; deal must DSCR.
Hard money
10% down · 12.0% · 12mo
- Down + closing
- —
- Monthly P&I
- —
- Monthly cashflow
- —
- DSCR
- —
- Eligible?
- —
Short-term bridge; refi at stabilization.
Rent comps 1 comps
| Address | Beds | Baths | Sqft | Rent | $/sqft | DOM | Units | Dist |
|---|---|---|---|---|---|---|---|---|
| 519 Oak St Texarkana, TX | 1.0–2.0 | 1.0 | 612 | $895 | $1.46 | 46d | 4 | 1.26mi |
Listing history 8 events
-
2026-06-05statusdays on market $74,900 Pending 43 DOM
-
2026-06-02days on market $74,900 Active 41 DOM
-
2026-06-01days on market $74,900 Active 40 DOM
-
2026-05-31days on market $74,900 Active 39 DOM
-
2026-05-30days on market $74,900 Active 38 DOM
-
2026-04-22$74,900 Active 122-char remark
-
2022-03-10soldstatus
-
1969-10-07soldstatus
ⓘ Source: listings_history table (triggers on properties + properties_extension) + one-shot
backfill from property_details.listing_events for pre-trigger history.
Tax reassessment forecast TX · Resets to sale price
- Current annual tax
- $792 · $66/mo
- Projected year-2 tax
- $1,371 · $114/mo
- Expected delta
- +$579/yr (+$48/mo · 73.1%)
ⓘ Screening estimate from a state-policy table — verify with the county assessor before closing.
Climate risk First Street
- Flood 1/10 Low FEMA zone X (unshaded) · 0% chance over 30 yrs
- Wildfire 1/10 Low
- Heat 7/10 Severe 7 d/yr ≥112°F today · 22 d/yr by 30 yrs out
- Wind 6/10 Major 27% chance of damaging wind over 30 yrs
- Air quality 2/10 Low 0 unhealthy d/yr today · 1 by 30 yrs out
Nearby sold comps map
Loading sold comps map…
Walkable amenities ~0.75 mi
Loading nearby amenities…
Taxation est. · year 1
- Rental income
- $13,391
- − Mortgage interest
- −$4,196
- − Property taxes
- −$792
- − Insurance
- −$374
- − Repairs & maintenance
- −$1,071
- − Management
- −$1,071
- − Depreciation
- −$2,179
- Taxable income
- $3,708
- Est. tax owed @ 24.0%
- −$890
- After-tax cash flow
- $3,809/yr
For passive investors: Depreciation is non-cash, so a rental often shows a tax loss while cash-flowing — sheltering income. Rental losses are passive: they offset passive income freely, and up to $25,000/yr can offset ordinary (W-2) income if you actively participate and your MAGI is under $100k (phasing out to $0 by $150k); unused losses carry forward. On sale, claimed depreciation is recaptured at up to 25%, and gains may owe capital-gains tax (a 1031 exchange can defer both). Figures are a year-1 estimate at your 24.0% rate — not tax advice; consult a CPA.
Schools (NCES district)
- District
- Texarkana ISD
- NCES district ID
- 4842480
- Math proficiency
- 36% ▼ -7.00%
- Reading proficiency
- 41% ▼ -1.00%
- Median HH income
- $35,692
- Composite
- 31.87/100
- National rank
- #5867
- State rank
- #472 of 826 in TX
Livability — Texarkana
- Score
- 77/100
- State rank
- #93
- US rank
- #3241
Category grades
Schools grade is shown separately in the Schools card above.
Census & demographics
- Census place
- Texarkana, TX
- County
- Bowie County · 61,238 people
- City population
- 61,238
- Metro
- Texarkana, TX-AR
- Population (ZIP)
- 34,866
- Household income
- $45,995
- Rent vs Own
- Severe rent burden
- 1289.0
Population outlook (Bowie County) Hauer SSP2
- Today (2025)
- 94,699 people
- By 2030
- 94,824 · +0.1%
- By 2040
- 94,870 · +0.2%
- By 2050
- 93,686 · -1.1%
- By 2075
- 90,082 · -4.9%
- By 2100
- 76,579 · -19.1%
Race, ethnicity, and origin ACS 2023
- Neighborhood character
- Diverse neighborhood (Simpson 0.59)
- Race & ethnicity
- White 54% Black 33% Hispanic / Latino 9% Two or more races 5%
- Hispanic origin (detail)
- Mexican 7%
- Common ancestry
- Italian 1% Lithuanian 1% Portuguese 1%
- Foreign-born
- 5% · Canada
- Languages at home
- 92% English-only · Spanish 6% Other Indo-European 1%
Political lean MEDSL · Bowie
- 2024 margin
- Solid R (+48.7) · D 25.3% · R 74.0%
- 2008→2024 swing
- -10.8pp toward R · 2008: -37.9pp · 2024: -48.7pp
- All cycles
- 2024: R+48.7 2020: R+42.8 2016: R+46.6 2012: R+41.5 2008: R+37.9
Not yet ingested
- Civics
- —
Market trends
- HPI YoY
- ▼ -79.14%
- Current HPI
- 147.9402
- Rent YoY
- ▲ 1.63%
- Metro
- Texarkana, TX-AR
- State GDP YoY
- ▲ 3.95%
- F500 in state
- 110
Industry mix (Fortune 500 HQ in TX)
| Industry | F500 HQs | Revenue |
|---|---|---|
| Energy | 16 | $1,198B |
|
||
| Technology | 5 | $198B |
|
||
| Engineering / Construction | 4 | $72B |
|
||
| Energy Services | 3 | $60B |
|
||
| Utilities | 3 | $41B |
|
||
| Healthcare | 2 | $330B |
|
||
Price history
4 events — show timeline
- 2026-06-04 Pending — TBOR
- 2026-04-22 Listed $74,900 TBOR
- 2022-03-10 Sold (Public Records) — Public Records
- 1969-10-07 Sold (Public Records) — Public Records
Property tax history
+4.1%/yrLatest (2025): $792 · +4.9% YoY. Source: county tax records.
Cash-flow waterfall
monthlySold comps — $/sqft
last 12 mo · ≤1 miLoading sold comps…