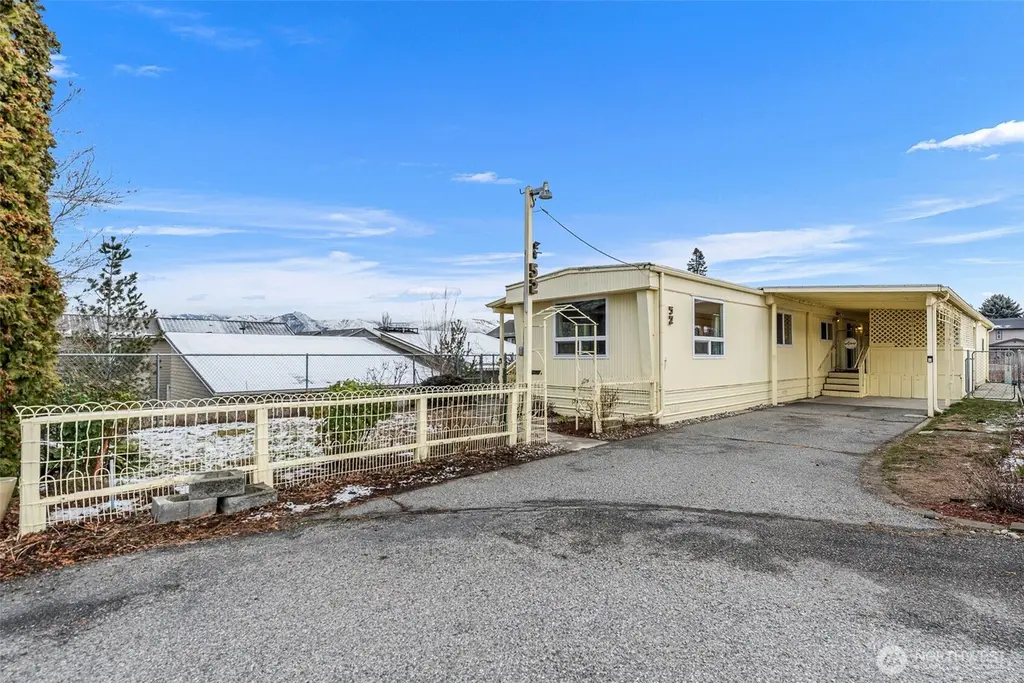
455 9th St NE #52 · East Wenatchee, WA
Flood risk 1/10 · Minimal
- FEMA flood zone
- X (shaded)
- Chance of flooding over 30 yrs
- 0.0%
- Est. flood insurance / yr
- $473 – $860
Fire risk 5/10 · Moderate
- Est. fire insurance / yr
- $604 – $1,122
Heat risk 4/10 · Minor
- Hot days now (above 96°F)
- 7 days/yr
- Hot days in 30 yrs
- 13 days/yr
Wind risk 1/10 · Minimal
- Chance of severe wind over 30 yrs
- —
Air-quality risk 10/10 · Severe
- Unhealthy air days now
- 25 days/yr
- Unhealthy air days in 30 yrs
- 25 days/yr
Risk factors via First Street. Map © Google.
Why this score? — see what drove the B- grade
The composite is a weighted blend of 9 inputs, each scored 0–100. Each bar is that input's sub-score; the figure is the points it added to the 100-point composite (weight × sub-score).
- Cash flow +30.0/30.0
- 1% rule +10.0/10.0
- DSCR +10.0/10.0
- Schools +4.7/10.0
- ARV discount +4.3/15.0
- Livability +4.2/5.0
- Rent growth +2.9/5.0
- Condition / age +2.5/5.0
- Appreciation +0.0/10.0
$75,000
🖨 Deal sheet (PDF) 📄 Offer letter ✓ Due diligence
Listing remarks
Welcome to Highland Terrace, a 55+ community centrally located with easy access to town. This well maintained 1978 single wide offers 2 bedrooms, 1 bath, and 924 sqft of comfortable living space on a desirable corner lot for added privacy. The soft sunny exterior paired with well maintained landscaping creates inviting curb appeal. Inside, updated flooring and double pane energy efficient windows enhance comfort throughout. Enjoy beautiful Cascade Mountain views, a covered patio for relaxing, and a spacious bonus room ideal for hobbies or additional storage. The property also features a raised garden area, storage shed, one covered parking space, and one additional uncovered space. Comforta
Key facts
- Bonus room
- Double pane windows
- Covered patio
Tags
Neighborhood map
What this means for you Summary
Snapshot
- This is a 2-bed/1.0-bath manufactured listed at $75k.
Deal economics
- At list price, monthly cash flow is $985 ($12k/yr) — positive.
- The deal already cash-flows at list — no discount required.
- Meets the 1% rule at list price ($2k rent vs $75k).
- Recommended offer: $70k (6.0% below list) — sets the bar for market timing.
- Cap rate 22.0% vs local median 2.9% in East Wenatchee — top-decile yield for the area; either an underpriced asset or a hidden risk that comps aren't pricing in. Stress-test before assuming the spread holds.
Location & tenants
- Location reads 83/100 on livability (#54 in WA, #972 nationally) — a professional / high-income tenant draw. Strengths: commute A+, housing A+, health & safety A+.
- Eastmont School District (suburban): math 45% / reading 60% proficiency, ranked #118 of 291 in WA (top 40%) — acceptable for families but not a draw, mixed tenant base, ~2y average lease.
- Zoned schools: Lee Elementary (541 students, 72% FRL); Eastmont Senior High (1,454 students, 62% FRL) — zoned schools average 67% FRL vs 48% district-wide (19 pts higher); higher-poverty schools than district average — tighter screening recommended.
- Market conditions: Rents rising (+1.5%/yr); 326 active listings in the ZIP; 16 comparable units currently listed for rent nearby; rentals lingering (median 45d on market — plan ~5-8 weeks vacancy on turnover, expect pricing pressure); 100% of comp listings sitting > 30 days — soft ceiling on asking rent; solid renter incomes; 263 units permitted in Douglas County in 2024 (0 in 5+ unit buildings).
Forward outlook
- Local home prices are declining (-3.0%/yr); year-one equity from $519 of loan paydown is wiped out by about $2k of value loss. Plan a longer hold.
- Douglas County population projected at +22% by 2050 — long-run rental-demand tailwind backs the buy-and-hold thesis.
- At projected returns (-3.0% appreciation + 1.5% rent growth), your $21k cash investment doubles in ~3 years — after that, you're playing with house money.
Negotiation context
- It's been on market 84 days — a 6% lower offer ($70k) is reasonable based on typical stale-listing flexibility.
- 3 sale attempts since 2y ago; this cycle's ask has dropped $11k (13%) from the opening price — seller is motivated, your offer sets the floor, not the list.
Risks & watch-outs
- Climate carrying-cost: moderate wildfire risk — expect insurance premiums to compound above CPI over the hold.
Questions for the listing agent
- It's been on market 84 days. Have you received any prior offers? Is the seller open to a 6% concession, seller financing, or rate buy-down credit?
- Built in 1978 — when were the roof, HVAC, electrical panel, plumbing, and water heater last replaced?
- Why hasn't it sold? Are there any deal-killer items the seller is aware of (foundation, flood, title, zoning, code violations)?
- Is there a deadline driving the sale (1031 exchange, divorce, estate, relocation)? That informs how much negotiation room exists.
- What's the average days-on-market for RENTAL listings here right now (not sales)? A rising rental-DOM trend means longer vacancies and softer asking-rent achievability than the comps imply.
- What's the recent tenant-quality profile in this submarket — average credit score on applications, eviction rate, late-payment / NSF rate, and stable-employment percentage? A property-management company in the area should have these aggregated.
- How much new for-sale + rental construction is in the pipeline within 1–3 miles? Heavy new supply typically softens prices + rents 12–24 months out; constrained supply supports both.
Investment metrics
- 1% rule
- 2.42% ✓
- Cap rate
- 22.05%
- Cash-on-cash
- 56.26%
- DSCR
- 3.50
- GRM
- 3.4
CMA / ARV
- ARV (median comp)
- $69,982
- List price
- $75,000
- Delta
- 7.17%
- Verdict
- FAIR
- Comps
- 3 within 1.0 mi
Show comp detail 5 sales within ~0.75 mi
| Address | Dist | Beds/Ba | Sqft | Sold | Price | $/sf | Match |
|---|---|---|---|---|---|---|---|
| 455 9th St NE #34 | 0.04mi | 2/1.0 | 938 (+2%) | 11mo | $70,000 | $75 | 87 |
| 455 NE 9th St #43 | 0.04mi | 3/1.0 (+1) | 924 (0%) | 10mo | $55,000 | $60 | 85 |
| 455 9th St NE #20 | 0.04mi | 2/2.0 | 924 (0%) | 16mo | $84,000 | $91 | 80 |
| 341 N Georgia Ave | 0.62mi | 2/2.0 | 900 (-3%) | 13mo | $85,000 | $94 | 52 |
| 323 N Georgia Ave | 0.67mi | 2/1.0 | 910 (-2%) | 23mo | $49,000 | $54 | 47 |
Match score weights: distance 35% · size 25% · config 20% · recency 20%. Top-matched comps best support the ARV.
Projected returns pro-forma
-3.0% appreciation · 1.47% rent growth · sell at horizon
- IRR
- 53.0%
- Equity multiple
- 3.28×
- Total profit
- $47,786
- Equity at exit
- $11,183
- IRR
- 57.6%
- Equity multiple
- 6.30×
- Total profit
- $111,338
- Equity at exit
- $6,485
Cash invested: $21,000 (down + closing). Projections, not guarantees.
Landlord ↔ Tenant lean methodology
- Overall (STATE)
- 28 Tenant-Leaning
- State Washington
- 28 Tenant-Leaning · D+8
- County
- — inherits STATE
- City
- — inherits STATE
ZIP-level market 98802
- Rents YoY
- 1.5%
- Active inventory
- 326
- Price-to-rent
- 3.4×
Monthly cashflow live
- Estimated rent
- $1,817 high interval (Pro) →
- Mortgage (P&I)
- −$393
- Tax from tax record
- −$26 /mo · $316/yr
- Insurance
- −$31
- HOA
- −$0
- Vacancy / Maint / Mgmt
- −$382
- Net cashflow
- $985
Break-even live
Sensitivity live
| Price | -10% $1,027 | -5% $1,006 | +0% $985 | +5% $963 | +10% $942 |
|---|---|---|---|---|---|
| Rent | -10% $841 | -5% $913 | +0% $985 | +5% $1,056 | +10% $1,128 |
| Rate | -1.0pp $1,022 | -0.5pp $1,004 | base $985 | +0.5pp $965 | +1.0pp $945 |
UW: 25.0% down · 7.5% · 30yr · 1.5% tax · 5.0% vac · 8.0% maint · 8.0% mgmt
Financing live
Cash to close
- Down payment
- $18,750
- Closing costs
- $2,250
- Reserves months
- —
- Total cash needed
- —
Loan-product check · same deal, 3 products live
Conventional
25% down · 7.5% · 30yr
- Down + closing
- —
- Monthly P&I
- —
- Monthly cashflow
- —
- DSCR
- —
- Eligible?
- —
Personal DTI + credit; lowest rate.
DSCR
20% down · 8.5% · 30yr
- Down + closing
- —
- Monthly P&I
- —
- Monthly cashflow
- —
- DSCR
- —
- Eligible?
- —
No personal income docs; deal must DSCR.
Hard money
10% down · 12.0% · 12mo
- Down + closing
- —
- Monthly P&I
- —
- Monthly cashflow
- —
- DSCR
- —
- Eligible?
- —
Short-term bridge; refi at stabilization.
Rent comps 16 comps
| Address | Beds | Baths | Sqft | Rent | $/sqft | DOM | Units | Dist |
|---|---|---|---|---|---|---|---|---|
| 933 N Baker Ave Apt 10 East Wenatchee, WA | 1.0 | 1.0 | 800 | $1,595 | $1.99 | 45d | 1 | 0.26mi |
| 623 N Baker Ave Apt D East Wenatchee, WA | 3.0 | 1.0 | 1006 | $1,695 | $1.68 | 45d | 1 | 0.29mi |
| 224 6th St NE East Wenatchee, WA | 3.0 | 1.0 | 966 | $1,895 | $1.96 | 45d | 1 | 0.40mi |
| 1345 N Devon Ave Unit 6 East Wenatchee, WA | 2.0 | 1.5 | 985 | $1,750 | $1.78 | 45d | 1 | 0.51mi |
| 667 4th St NE Apt I201 East Wenatchee, WA | 2.0 | 1.0 | 884 | $1,650 | $1.87 | 45d | 1 | 0.53mi |
| 460 N James Ave Unit 456 James East Wenatchee, WA | 2.0 | 2.0 | 850 | $2,495 | $2.94 | 45d | 1 | 0.84mi |
| 711 Methow St Wenatchee, WA | 1.0 | 1.0 | 600 | $1,295 | $2.16 | 45d | 1 | 1.10mi |
| 1121 Monitor Ave Unit A Upstairs Wenatchee, WA | 3.0 | 1.0 | 800 | $1,695 | $2.12 | 45d | 1 | 1.15mi |
| 1121 Monitor Ave Unit 1/2 Downstairs Wenatchee, WA | 2.0 | 1.0 | 700 | $1,495 | $2.14 | 45d | 1 | 1.15mi |
| 419 S Pace Dr Unit 419 East Wenatchee, WA | 1.0 | 1.0 | 714 | $1,595 | $2.23 | 45d | 1 | 1.22mi |
| 207 Yakima St Unit 310 Wenatchee, WA | 1.0 | 1.0 | 586 | $1,250 | $2.13 | 45d | 1 | 1.24mi |
| 410 Kittitas St Unit B Wenatchee, WA | 2.0 | 1.0 | 900 | $1,695 | $1.88 | 45d | 1 | 1.30mi |
| 819 Malaga Ave Wenatchee, WA | 2.0 | 1.0 | 850 | $1,495 | $1.76 | 45d | 1 | 1.33mi |
| 511 Yakima St #10 Wenatchee, WA | 2.0 | 1.0 | 684 | $1,495 | $2.19 | 45d | 1 | 1.41mi |
| 214 Antles Ave Unit 309 Wenatchee, WA | 2.0 | 1.5 | 900 | $1,695 | $1.88 | 45d | 1 | 1.44mi |
| 212 Antles St Wenatchee, WA | 2.0 | 1.0 | 900 | $1,695 | $1.88 | 45d | 1 | 1.44mi |
Listing history 8 events
-
2026-05-19status Pending
-
2026-04-14price $75,000
-
2026-04-07status Active
-
2026-04-02status Pending
-
2026-02-19$86,000 Active
-
2024-06-26soldstatus $81,500 Closed
-
2024-06-09status Pending
-
2024-05-29$83,500 Active
ⓘ Source: listings_history table (triggers on properties + properties_extension) + one-shot
backfill from property_details.listing_events for pre-trigger history.
Tax reassessment forecast WA · Resets to sale price
- Current annual tax
- $316 · $26/mo
- Projected year-2 tax
- $735 · $61/mo
- Expected delta
- +$419/yr (+$35/mo · 132.7%)
ⓘ Screening estimate from a state-policy table — verify with the county assessor before closing.
Climate risk First Street
- Flood 1/10 Low FEMA zone X (shaded) · 0% chance over 30 yrs
- Wildfire 5/10 Major
- Heat 4/10 Moderate 7 d/yr ≥96°F today · 13 d/yr by 30 yrs out
- Wind 1/10 Low
- Air quality 10/10 Extreme 25 unhealthy d/yr today · 25 by 30 yrs out
Nearby sold comps map
Loading sold comps map…
Walkable amenities ~0.75 mi
Loading nearby amenities…
Taxation est. · year 1
- Rental income
- $21,804
- − Mortgage interest
- −$4,201
- − Property taxes
- −$316
- − Insurance
- −$375
- − Repairs & maintenance
- −$1,744
- − Management
- −$1,744
- − Depreciation
- −$2,182
- Taxable income
- $11,242
- Est. tax owed @ 24.0%
- −$2,698
- After-tax cash flow
- $9,117/yr
For passive investors: Depreciation is non-cash, so a rental often shows a tax loss while cash-flowing — sheltering income. Rental losses are passive: they offset passive income freely, and up to $25,000/yr can offset ordinary (W-2) income if you actively participate and your MAGI is under $100k (phasing out to $0 by $150k); unused losses carry forward. On sale, claimed depreciation is recaptured at up to 25%, and gains may owe capital-gains tax (a 1031 exchange can defer both). Figures are a year-1 estimate at your 24.0% rate — not tax advice; consult a CPA.
Schools (NCES district)
- District
- Eastmont School District
- NCES district ID
- 5302310
- Math proficiency
- 45% ▬ 0.00%
- Reading proficiency
- 60% ▲ 1.00%
- Median HH income
- $56,015
- Composite
- 47.31/100
- National rank
- #5047
- State rank
- #118 of 291 in WA
Livability — East Wenatchee
- Score
- 83/100
- State rank
- #54
- US rank
- #972
Category grades
Schools grade is shown separately in the Schools card above.
Census & demographics
- Census place
- East Wenatchee, WA
- County
- Douglas County · 33,539 people
- City population
- 33,539
- Metro
- Wenatchee, WA
- Population (ZIP)
- 33,539
- Household income
- $87,744
- Rent vs Own
- Severe rent burden
- 741.0
Population outlook (Douglas County) Hauer SSP2
- Today (2025)
- 45,264 people
- By 2030
- 47,398 · +4.7%
- By 2040
- 51,407 · +13.6%
- By 2050
- 55,020 · +21.6%
- By 2075
- 63,862 · +41.1%
- By 2100
- 69,870 · +54.4%
Race, ethnicity, and origin ACS 2023
- Neighborhood character
- Majority White (63%)
- Race & ethnicity
- White 63% Hispanic / Latino 30% Two or more races 10% Asian 1%
- Hispanic origin (detail)
- Mexican 29%
- Common ancestry
- Lithuanian 3% Portuguese 3% Slovak 2%
- Foreign-born
- 14% · Canada
- Languages at home
- 76% English-only · Spanish 23% Other Indo-European 1%
Political lean MEDSL · Douglas
- 2024 margin
- Strong R (+27.0) · D 35.2% · R 62.1% · Other 2.7%
- 2008→2024 swing
- -5.6pp toward R · 2008: -21.4pp · 2024: -27.0pp
- All cycles
- 2024: R+27.0 2020: R+24.1 2016: R+31.5 2012: R+28.9 2008: R+21.4
Not yet ingested
- Civics
- —
Market trends
- HPI YoY
- ▼ -570.14%
- Current HPI
- 305.0094
- Rent YoY
- ▲ 1.47%
- Metro
- Wenatchee, WA
- State GDP YoY
- ▲ 4.65%
- F500 in state
- 22
Industry mix (Fortune 500 HQ in WA)
| Industry | F500 HQs | Revenue |
|---|---|---|
| Retail | 2 | $269B |
|
||
| Technology / Retail | 1 | $638B |
|
||
| Technology | 1 | $245B |
|
||
| Telecommunications | 1 | $38B |
|
||
| Food / Beverage | 1 | $36B |
|
||
| Automotive / Trucks | 1 | $34B |
|
||
Price history
-10.2% since first listed8 events — show timeline
- 2026-05-19 Pending — NWMLS as Distributed by MLS Grid
- 2026-04-14 Price Changed $75,000 NWMLS as Distributed by MLS Grid
- 2026-04-07 Relisted — NWMLS as Distributed by MLS Grid
- 2026-04-02 Pending — NWMLS as Distributed by MLS Grid
- 2026-02-19 Listed $86,000 NWMLS as Distributed by MLS Grid
- 2024-06-26 Sold (MLS) $81,500 NWMLS as Distributed by MLS Grid
- 2024-06-09 Pending — NWMLS as Distributed by MLS Grid
- 2024-05-29 Listed $83,500 NWMLS as Distributed by MLS Grid
Property tax history
+10.3%/yrLatest (2026): $316 · +8.5% YoY. Source: county tax records.
Cash-flow waterfall
monthlySold comps — $/sqft
last 12 mo · ≤1 miLoading sold comps…