 Duplex
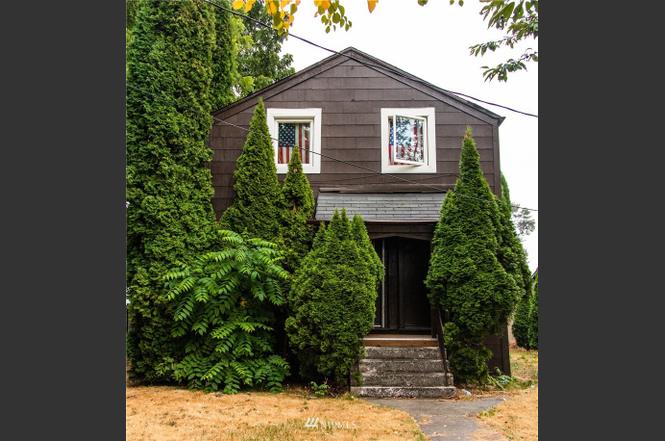
328 330 S Division St · Auburn, WA
Flood risk 1/10 · Minimal
- FEMA flood zone
- X (unshaded)
- Chance of flooding over 30 yrs
- 0.0%
- Est. flood insurance / yr
- $473 – $860
Fire risk 1/10 · Minimal
- Est. fire insurance / yr
- $604 – $1,122
Heat risk 3/10 · Minor
- Hot days now (above 88°F)
- 7 days/yr
- Hot days in 30 yrs
- 15 days/yr
Wind risk 1/10 · Minimal
- Chance of severe wind over 30 yrs
- —
Air-quality risk 7/10 · Major
- Unhealthy air days now
- 10 days/yr
- Unhealthy air days in 30 yrs
- 11 days/yr
Risk factors via First Street. Map © Google.
Why this score? — see what drove the B- grade
The composite is a weighted blend of 9 inputs, each scored 0–100. Each bar is that input's sub-score; the figure is the points it added to the 100-point composite (weight × sub-score).
- Cash flow +25.4/30.0
- ARV discount +15.0/15.0
- DSCR +8.4/10.0
- 1% rule +6.4/10.0
- Schools +4.7/10.0
- Livability +4.0/5.0
- Rent growth +3.4/5.0
- Condition / age +2.5/5.0
- Appreciation +0.0/10.0
$399,999
🖨 Deal sheet (PDF) 📄 Offer letter ✓ Due diligence
Multi-family units
County records classify this as Multi-Family (2-4 Unit). Listing-text estimate: 2 units. confirmed
Listing remarks
Excellent investment opportunity with long-term, dependable tenants in place, currently on month-to-month leases. Tenants pay their own electricity, offering steady cash flow with flexibility for future plans. The property carries Land Use 3 – Duplex and is zoned Commercial DUC (Downtown Urban Center), allowing redevelopment potential of up to six stories (buyer to verify), making this an ideal buy-and-hold or future development asset. This fully remodeled two-story duplex with a full basement features a new roof, updated kitchens and bathrooms, new flooring, and fresh interior paint. The main unit offers 2 bedrooms (with one bedroom in the basement), while the upper unit features 1 b
Key facts
- Zoned commercial duc
- New flooring
- Updated bathrooms
Tags
Property features AI
Finance
- Other: Building area total: 1,870 square feet; Units in building: 2; Unit 238 actual rent: $1,300; Unit 330 actual rent: $1,100; Gross adjusted income: $0 (as reported); Gross rent multiplier: 0 (as reported)
- Financial info: Listing terms: Cash or Conventional; Gross scheduled income: $30,000/year; Total monthly income: $2,500; Total expenses: $8,555; Insurance expense: $800
Exterior
- Parking: Uncovered parking for 6 vehicles; RV parking available
- Security: Fully fenced
- Utilities: Public water (Auburn); Sewer connected (Auburn); Power from PSE; Energy sources: Electric and Natural Gas
- Home design: Duplex (residential income / multi-family); 2 stories; Possible commercial use
- Construction: Composition roof; Construction materials: see remarks; Poured concrete foundation; Effective year built 1912
- Exterior features: Deck; Fully fenced yard; Cable TV available; RV parking; See remarks for additional exterior details
Interior
- Kitchen: Unit 238: Refrigerator included; Unit 330: Refrigerator included; No dishwashers listed
- Bedrooms: Unit 238: 2 bedrooms; Unit 330: 1 bedroom
- Flooring: Laminate
- Bathrooms: Unit 238: 1 bathroom; Unit 330: 1 bathroom
- Heating & cooling: Baseboard heating; Forced air heating; Forced air cooling
- Interior features: Laminate flooring; Basement; Thermal windows
- Laundry & utility: Both units include washer/dryer hookups or units
Neighborhood map
What this means for you Summary
Snapshot
- This is a 2 × 3-bed/2.0-bath units multifamily listed at $400k.
Deal economics
- At list price, monthly cash flow is $919 ($11k/yr) — positive. Per door: $459/mo.
- The deal already cash-flows at list — no discount required.
- Meets the 1% rule at list price ($5k rent vs $400k).
- Recommended offer: $364k (9.0% below list) — sets the bar for market timing.
- Cap rate 9.0% vs local median 2.7% in Auburn — top-decile yield for the area; either an underpriced asset or a hidden risk that comps aren't pricing in. Stress-test before assuming the spread holds.
Location & tenants
- Location reads 81/100 on livability (#75 in WA, #1,371 nationally) — a professional / high-income tenant draw. Strengths: amenities A+, commute A+, employment A+; Watch: crime F, cost of living F.
- Auburn School District (urban): math 47% / reading 56% proficiency, ranked #125 of 291 in WA (top 43%) — acceptable for families but not a draw, mixed tenant base, ~2y average lease.
- Zoned schools: Washington Elementary School (491 students, 74% FRL); Cascade Middle School (899 students, 70% FRL); Auburn Senior High School (1,844 students, 67% FRL) — zoned schools average 70% FRL vs 44% district-wide (26 pts higher); higher-poverty schools than district average — tighter screening recommended.
- Market conditions: Rents rising (+3.5%/yr); 184 active listings in the ZIP; 6 comparable units currently listed for rent nearby; rentals leasing fast (median 12d on market — plan ~1-2 weeks tenant-placement turnaround); solid renter incomes; 10,555 units permitted in King County in 2024 (7,119 in 5+ unit buildings).
- At $4,552/mo this rent would consume 51% of the median local household income ($107k/yr) (locally 573% of renters already pay >50% of income on rent) — very limited rent-growth headroom before tenants either downsize or default.
Forward outlook
- Local home prices are declining (-3.0%/yr); year-one equity from $3k of loan paydown is wiped out by about $12k of value loss. Plan a longer hold.
- King County population projected at +44% by 2050 — long-run rental-demand tailwind backs the buy-and-hold thesis.
Negotiation context
- It's been on market 113 days — a 9% lower offer ($364k) is reasonable based on typical stale-listing flexibility.
- 4 sale attempts since 25y ago; this cycle's ask has dropped $90k (18%) from the opening price — seller is motivated, your offer sets the floor, not the list.
Risks & watch-outs
- Watch-outs: built in 1912 — expect roof / HVAC / electrical / plumbing capex.
Questions for the listing agent
- It's been on market 113 days. Have you received any prior offers? Is the seller open to a 9% concession, seller financing, or rate buy-down credit?
- Can we see the unit-by-unit rent roll, current vacancy, and any below-market leases? What's the average tenancy length?
- What capital expenditures (roof, boiler, parking lot, exteriors) have been made in the last 5 years, and what's planned in the next 2?
- Built in 1912 — when were the roof, HVAC, electrical panel, plumbing, and water heater last replaced?
- Why hasn't it sold? Are there any deal-killer items the seller is aware of (foundation, flood, title, zoning, code violations)?
- Is there a deadline driving the sale (1031 exchange, divorce, estate, relocation)? That informs how much negotiation room exists.
- Crime grade is F in this area — have there been break-ins, vandalism, or insurance claims at this property in the last 3 years? What carrier currently insures it and at what premium?
- What's the average days-on-market for RENTAL listings here right now (not sales)? A rising rental-DOM trend means longer vacancies and softer asking-rent achievability than the comps imply.
- What's the recent tenant-quality profile in this submarket — average credit score on applications, eviction rate, late-payment / NSF rate, and stable-employment percentage? A property-management company in the area should have these aggregated.
- How much new apartment / multifamily construction is in the pipeline within 1–3 miles? Heavy new supply (>2% of stock underway) typically softens rents 12–24 months out; light construction supports rent growth.
Investment metrics
- 1% rule
- 1.14% ✓
- Cap rate
- 9.05%
- Cash-on-cash
- 9.84%
- DSCR
- 1.44
- GRM
- 7.3
CMA / ARV
- ARV (on-the-fly)
- $489,090
- Comps found
- 2
Show comp detail 2 sales within ~0.75 mi
| Address | Dist | Beds/Ba | Sqft | Sold | Price | $/sf | Match |
|---|---|---|---|---|---|---|---|
| 618 5th St SE | 0.42mi | 4/2.0 | 1,390 (+2%) | 5mo | $442,500 | $318 | 74 |
| 1015 6th St SE | 0.67mi | 4/2.0 | 1,540 (+12%) | 12mo | $550,000 | $357 | 38 |
Match score weights: distance 35% · size 25% · config 20% · recency 20%. Top-matched comps best support the ARV.
Projected returns pro-forma
-3.0% appreciation · 3.53% rent growth · sell at horizon
- IRR
- -0.9%
- Equity multiple
- 0.97×
- Total profit
- $-3,844
- Equity at exit
- $59,641
- IRR
- 9.3%
- Equity multiple
- 1.73×
- Total profit
- $82,188
- Equity at exit
- $34,585
Cash invested: $112,000 (down + closing). Projections, not guarantees.
Landlord ↔ Tenant lean methodology
- Overall (STATE)
- 28 Tenant-Leaning
- State Washington
- 28 Tenant-Leaning · D+8
- County
- — inherits STATE
- City
- — inherits STATE
ZIP-level market 98001
- Rents YoY
- 3.5%
- Active inventory
- 184
- Price-to-rent
- 14.6×
Monthly cashflow live
- Estimated rent
- $4,552 high interval (Pro) →
- Mortgage (P&I)
- −$2,098
- Tax from tax record
- −$413 /mo · $4,956/yr
- Insurance
- −$167
- HOA
- −$0
- Vacancy / Maint / Mgmt
- −$956
- Net cashflow
- $919
Break-even live
Sensitivity live
| Price | -10% $1,145 | -5% $1,032 | +0% $919 | +5% $806 | +10% $692 |
|---|---|---|---|---|---|
| Rent | -10% $559 | -5% $739 | +0% $919 | +5% $1,099 | +10% $1,278 |
| Rate | -1.0pp $1,120 | -0.5pp $1,021 | base $919 | +0.5pp $815 | +1.0pp $710 |
2-unit breakdown (identical units grouped — click to expand)
| Units | Beds | Baths | Est. rent |
|---|---|---|---|
| 2× units | 3 | 2 | $4,552 |
| #1 | 3 | 2 | $2,276 |
| #2 | 3 | 2 | $2,276 |
| Total (2 units) | $4,552 | ||
UW: 25.0% down · 7.5% · 30yr · 1.5% tax · 5.0% vac · 8.0% maint · 8.0% mgmt
Financing live
Cash to close
- Down payment
- $100,000
- Closing costs
- $12,000
- Reserves months
- —
- Total cash needed
- —
Loan-product check · same deal, 3 products live
Conventional
25% down · 7.5% · 30yr
- Down + closing
- —
- Monthly P&I
- —
- Monthly cashflow
- —
- DSCR
- —
- Eligible?
- —
Personal DTI + credit; lowest rate.
DSCR
20% down · 8.5% · 30yr
- Down + closing
- —
- Monthly P&I
- —
- Monthly cashflow
- —
- DSCR
- —
- Eligible?
- —
No personal income docs; deal must DSCR.
Hard money
10% down · 12.0% · 12mo
- Down + closing
- —
- Monthly P&I
- —
- Monthly cashflow
- —
- DSCR
- —
- Eligible?
- —
Short-term bridge; refi at stabilization.
Rent comps 6 comps
| Address | Beds | Baths | Sqft | Rent | $/sqft | DOM | Units | Dist |
|---|---|---|---|---|---|---|---|---|
| 44 5th St NE Apt 4 Auburn, WA | 3.0 | 1.0 | 1000 | $1,999 | $2.00 | 25d | 1 | 0.53mi |
| 1314 6th Pl NE Auburn, WA | 3.0 | 1.5 | 1180 | $3,200 | $2.71 | 25d | 1 | 1.12mi |
| 1433 8th St NE Auburn, WA | 1.0–3.0 | 1.0–1.5 | 1025 | $2,799 | $2.73 | 0d | 13 | 1.19mi |
| 2455 F St SE Auburn, WA | 1.0–3.0 | 1.0–2.0 | 757 | $1,955 | $2.58 | 4d | 6 | 1.23mi |
| 1910 N Ct SE Auburn, WA | 3.0 | 2.0 | 1570 | $2,900 | $1.85 | 12d | 1 | 1.24mi |
| 1413 12th St NE Unit ADU Auburn, WA | 3.0 | 1.0 | 1000 | $2,400 | $2.40 | 6d | 1 | 1.32mi |
Listing history 34 events
-
2026-06-18days on market $399,999 Active 113 DOM
-
2026-06-17days on market $399,999 Active 112 DOM
-
2026-06-16days on market $399,999 Active 111 DOM
-
2026-06-15days on market $399,999 Active 110 DOM
-
2026-06-13days on market $399,999 Active 108 DOM
-
2026-06-13days on market $399,999 Active 107 DOM
-
2026-06-09days on market $399,999 Active 104 DOM
-
2026-06-08days on market $399,999 Active 103 DOM
-
2026-06-07days on market $399,999 Active 102 DOM
-
2026-06-04days on market $399,999 Active 99 DOM
-
2026-06-03days on market $399,999 Active 98 DOM
-
2026-06-02days on market $399,999 Active 97 DOM
-
2026-06-01days on market $399,999 Active 96 DOM
-
2026-05-31days on market $399,999 Active 95 DOM
-
2026-04-09price $399,999
-
2026-03-16price $469,900
-
2026-02-25$489,900 Active
-
2022-01-20soldstatus $364,000 Closed
-
2022-01-20soldstatus $364,000
-
2021-12-09status Pending
-
2021-10-29price $399,950
-
2021-10-06price $415,000
-
2021-09-18price $425,000
-
2021-07-08$459,000 Active
-
2005-04-01soldstatus $140,000
-
2005-03-31soldstatus $137,000
-
2005-01-20$137,000
-
2001-07-10soldstatus $93,000
-
2001-05-31soldstatus $93,000
-
2001-04-11$95,000
-
1993-08-17soldstatus $92,000
-
1985-06-14soldstatus $46,500
-
1983-04-29soldstatus $43,950
-
1978-07-14soldstatus $20,000
ⓘ Source: listings_history table (triggers on properties + properties_extension) + one-shot
backfill from property_details.listing_events for pre-trigger history.
Tax reassessment forecast WA · Resets to sale price
- Current annual tax
- $4,956 · $413/mo
- Projected year-2 tax
- $4,956 · $413/mo
- Expected delta
- $0/yr ($0/mo · 0.0%)
ⓘ Screening estimate from a state-policy table — verify with the county assessor before closing.
Climate risk First Street
- Flood 1/10 Low FEMA zone X (unshaded) · 0% chance over 30 yrs
- Wildfire 1/10 Low
- Heat 3/10 Moderate 7 d/yr ≥88°F today · 15 d/yr by 30 yrs out
- Wind 1/10 Low
- Air quality 7/10 Severe 10 unhealthy d/yr today · 11 by 30 yrs out
Nearby sold comps map
Loading sold comps map…
Walkable amenities ~0.75 mi
Loading nearby amenities…
Taxation est. · year 1
- Rental income
- $54,624
- − Mortgage interest
- −$22,406
- − Property taxes
- −$4,956
- − Insurance
- −$2,000
- − Repairs & maintenance
- −$4,370
- − Management
- −$4,370
- − Depreciation
- −$11,636
- Taxable income
- $4,886
- Est. tax owed @ 24.0%
- −$1,173
- After-tax cash flow
- $9,853/yr
For passive investors: Depreciation is non-cash, so a rental often shows a tax loss while cash-flowing — sheltering income. Rental losses are passive: they offset passive income freely, and up to $25,000/yr can offset ordinary (W-2) income if you actively participate and your MAGI is under $100k (phasing out to $0 by $150k); unused losses carry forward. On sale, claimed depreciation is recaptured at up to 25%, and gains may owe capital-gains tax (a 1031 exchange can defer both). Figures are a year-1 estimate at your 24.0% rate — not tax advice; consult a CPA.
Schools (NCES district)
- District
- Auburn School District
- NCES district ID
- 5300300
- Math proficiency
- 47% ▼ -3.00%
- Reading proficiency
- 56% ▼ -1.00%
- Median HH income
- $58,048
- Composite
- 46.73/100
- National rank
- #5240
- State rank
- #125 of 291 in WA
Livability — Auburn
- Score
- 81/100
- State rank
- #75
- US rank
- #1371
Category grades
Schools grade is shown separately in the Schools card above.
Census & demographics
- Census place
- Auburn, WA
- County
- King County · 2,251,916 people
- City population
- 74,969
- Metro
- Seattle-Tacoma-Bellevue, WA
- Population (ZIP)
- 37,460
- Household income
- $106,791
- Rent vs Own
- Severe rent burden
- 573.0
Population outlook (King County) Hauer SSP2
- Today (2025)
- 2,576,485 people
- By 2030
- 2,803,316 · +8.8%
- By 2040
- 3,255,921 · +26.4%
- By 2050
- 3,706,444 · +43.9%
- By 2075
- 4,746,063 · +84.2%
- By 2100
- 5,407,730 · +109.9%
Race, ethnicity, and origin ACS 2023
- Neighborhood character
- Highly diverse neighborhood (Simpson 0.71)
- Race & ethnicity
- White 47% Asian 17% Hispanic / Latino 17% Two or more races 12% Black 8% Pacific Islander 2%
- Hispanic origin (detail)
- Mexican 13%
- Common ancestry
- Subsaharan African 5% Portuguese 3% Italian 3%
- Foreign-born
- 28% · Canada, South Korea, Vietnam
- Languages at home
- 65% English-only · Spanish 12% Russian/Polish/Slavic 5% Korean 4%
Political lean MEDSL · King
- 2024 margin
- Solid D (+51.7) · D 74.2% · R 22.5% · Other 3.4%
- 2008→2024 swing
- +9.6pp toward D · 2008: 42.1pp · 2024: 51.7pp
- All cycles
- 2024: D+51.7 2020: D+52.7 2016: D+50.4 2012: D+39.9 2008: D+42.1
Not yet ingested
- Civics
- —
Market trends
- HPI YoY
- ▼ -616.80%
- Current HPI
- 303.2883
- Rent YoY
- ▲ 3.53%
- Metro
- Seattle-Tacoma-Bellevue, WA
- State GDP YoY
- ▲ 4.65%
- F500 in state
- 22
Industry mix (Fortune 500 HQ in WA)
| Industry | F500 HQs | Revenue |
|---|---|---|
| Retail | 2 | $269B |
|
||
| Technology / Retail | 1 | $638B |
|
||
| Technology | 1 | $245B |
|
||
| Telecommunications | 1 | $38B |
|
||
| Food / Beverage | 1 | $36B |
|
||
| Automotive / Trucks | 1 | $34B |
|
||
Price history
+1900.0% since first listed20 events — show timeline
- 2026-04-09 Price Changed $399,999 NWMLS as Distributed by MLS Grid
- 2026-03-16 Price Changed $469,900 NWMLS as Distributed by MLS Grid
- 2026-02-25 Listed $489,900 NWMLS as Distributed by MLS Grid
- 2022-01-20 Sold (Public Records) $364,000 Public Records
- 2022-01-20 Sold (MLS) $364,000 NWMLS as Distributed by MLS Grid
- 2021-12-09 Pending — NWMLS as Distributed by MLS Grid
- 2021-10-29 Price Changed $399,950 NWMLS as Distributed by MLS Grid
- 2021-10-06 Price Changed $415,000 NWMLS as Distributed by MLS Grid
- 2021-09-18 Price Changed $425,000 NWMLS as Distributed by MLS Grid
- 2021-07-08 Listed $459,000 NWMLS as Distributed by MLS Grid
- 2005-04-01 Sold (MLS) $140,000 NWMLS as Distributed by MLS Grid
- 2005-03-31 Sold (Public Records) $137,000 Public Records
- 2005-01-20 Listed $137,000 NWMLS as Distributed by MLS Grid
- 2001-07-10 Sold (Public Records) $93,000 Public Records
- 2001-05-31 Sold (MLS) $93,000 NWMLS as Distributed by MLS Grid
- 2001-04-11 Listed $95,000 NWMLS as Distributed by MLS Grid
- 1993-08-17 Sold (Public Records) $92,000 Public Records
- 1985-06-14 Sold (Public Records) $46,500 Public Records
- 1983-04-29 Sold (Public Records) $43,950 Public Records
- 1978-07-14 Sold (Public Records) $20,000 Public Records
Property tax history
+4.8%/yrLatest (2025): $4,956 · +9.2% YoY. Source: county tax records.
Cash-flow waterfall
monthlySold comps — $/sqft
last 12 mo · ≤1 miLoading sold comps…