166 Hooker Hill Rd · St. Johnsbury, VT
Flood risk 1/10 · Minimal
- FEMA flood zone
- AE
- Chance of flooding over 30 yrs
- 0.0%
- Est. flood insurance / yr
- $2,026 – $9,024
Fire risk 1/10 · Minimal
- Est. fire insurance / yr
- $480 – $892
Heat risk 2/10 · Minimal
- Hot days now (above 90°F)
- 7 days/yr
- Hot days in 30 yrs
- 17 days/yr
Wind risk 2/10 · Minimal
- Chance of severe wind over 30 yrs
- 4.0%
Air-quality risk 2/10 · Minimal
- Unhealthy air days now
- 1 days/yr
- Unhealthy air days in 30 yrs
- 1 days/yr
Risk factors via First Street. Map © Google.
Why this score? — see what drove the B grade
The composite is a weighted blend of 9 inputs, each scored 0–100. Each bar is that input's sub-score; the figure is the points it added to the 100-point composite (weight × sub-score).
- Cash flow +30.0/30.0
- 1% rule +10.0/10.0
- DSCR +10.0/10.0
- ARV discount +7.5/15.0
- Schools +5.0/10.0
- Appreciation +3.8/10.0
- Rent growth +2.5/5.0
- Livability +2.5/5.0
- Condition / age +2.5/5.0
$74,000
🖨 Deal sheet (PDF) 📄 Offer letter ✓ Due diligence
Listing remarks
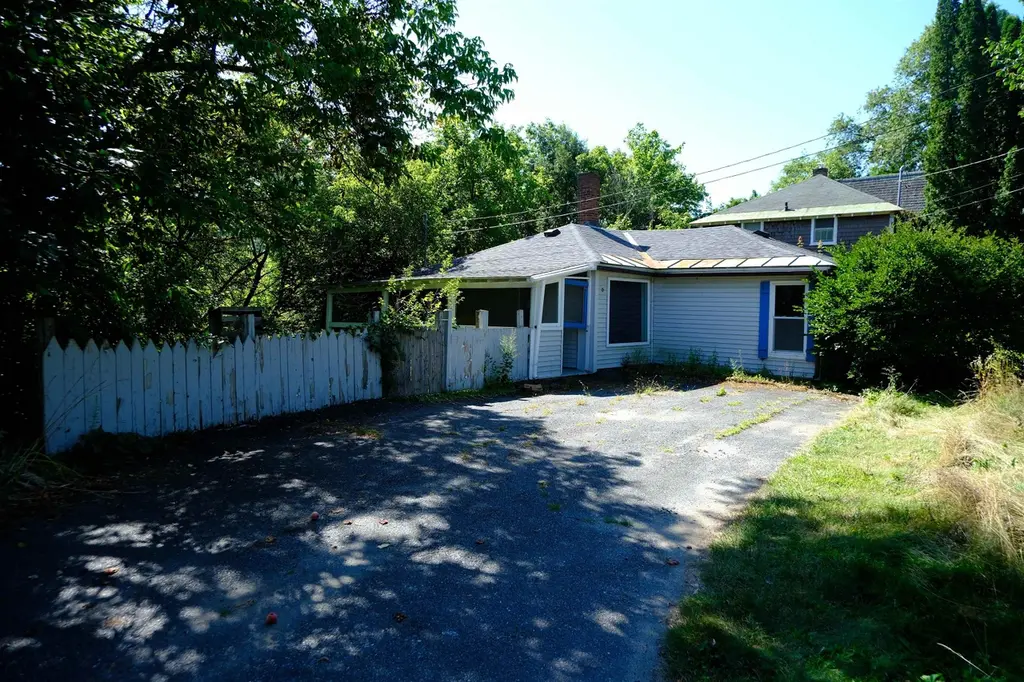
This 2-bedroom bungalow has funky cottage vibes with a great view overlooking the Passumpsic River from high above, but get ready to roll up your sleeves before moving in. The house has been gutted and is ready for remodeling work to begin. There are new windows, structural work, and a new oil tank. The roof has been recently replaced. Don’t worry though, there are still plenty of opportunities for the next owner to exercise their craftsmanship throughout every corner of the house. The location is perfect, situated in a quiet corner of town, walking distance to Railroad Street.
Key facts
- Structural work
- New oil tank
- Great view
Tags
Property features AI
Finance
- Other: Survey status unknown
Exterior
- Parking: Paved driveway
- Utilities: Public water; Public sewer; 100 Amp electric service; Cable internet available (Charter Spectrum); Phone service (Consolidated)
- Home design: Bungalow style; Existing structure; Shingle (architectural) roof
- Construction: Wood frame construction; Built in 1900
- Exterior features: Paved driveway; Property in town/neighborhood setting; Water view
Interior
- Kitchen: Kitchen on main level
- Bedrooms: Main level bedrooms; Basement bedroom
- Flooring: Wood flooring
- Bathrooms: One full bathroom
- Heating & cooling: Oil heat with forced air
- Interior features: Eight total rooms; Basement with daylight exposure, concrete floor, exterior access, and interior stairs
- Laundry & utility: Main level laundry room; Electric water heater
Neighborhood map
What this means for you Summary
Snapshot
- This is a 2-bed/1.0-bath single-family listed at $74k.
Deal economics
- At list price, monthly cash flow is $74 ($889/yr) — positive.
- The deal already cash-flows at list — no discount required.
- Meets the 1% rule at list price ($1k rent vs $74k).
- Recommended offer: $70k (6.0% below list) — sets the bar for market timing.
- Cap rate 15.0% vs local median 3.4% in St. Johnsbury — top-decile yield for the area; either an underpriced asset or a hidden risk that comps aren't pricing in. Stress-test before assuming the spread holds.
Location & tenants
- Location reads: area grade B — affects rentability + tenant quality, not the cash-flow math above.
- Zoned schools: St. Johnsbury School (math 19% / reading 37%, grade F, #149 of 192 statewide, top 78%, 702 students, 52% FRL).
- Market conditions: 66 active listings in the ZIP; 112 units permitted in Caledonia County in 2024 (15 in 5+ unit buildings).
Forward outlook
- Local home prices are declining (-2.4%/yr); year-one equity from $512 of loan paydown is wiped out by about $2k of value loss. Plan a longer hold.
- Caledonia County population projected at -20% by 2050 — secular population decline; favor cash flow + early exit over multi-decade hold.
Negotiation context
- It's been on market 85 days — a 6% lower offer ($70k) is reasonable based on typical stale-listing flexibility.
Risks & watch-outs
- Watch-outs: flood insurance adds $460/mo; built in 1900 — expect roof / HVAC / electrical / plumbing capex.
- Climate carrying-cost: in FEMA flood zone AE (mandatory federal flood insurance) — expect insurance premiums to compound above CPI over the hold.
Questions for the listing agent
- It's been on market 85 days. Have you received any prior offers? Is the seller open to a 6% concession, seller financing, or rate buy-down credit?
- Built in 1900 — when were the roof, HVAC, electrical panel, plumbing, and water heater last replaced?
- What's the actual annual flood-insurance premium (NFIP or private), and is the property in a SFHA with mandatory coverage?
- Why hasn't it sold? Are there any deal-killer items the seller is aware of (foundation, flood, title, zoning, code violations)?
- Is there a deadline driving the sale (1031 exchange, divorce, estate, relocation)? That informs how much negotiation room exists.
- What's the average days-on-market for RENTAL listings here right now (not sales)? A rising rental-DOM trend means longer vacancies and softer asking-rent achievability than the comps imply.
- What's the recent tenant-quality profile in this submarket — average credit score on applications, eviction rate, late-payment / NSF rate, and stable-employment percentage? A property-management company in the area should have these aggregated.
- How much new for-sale + rental construction is in the pipeline within 1–3 miles? Heavy new supply typically softens prices + rents 12–24 months out; constrained supply supports both.
Investment metrics
- 1% rule
- 1.84% ✓
- Cap rate
- 14.96%
- Cash-on-cash
- 30.95%
- DSCR
- 2.38
- GRM
- 4.5
CMA / ARV
- ARV (on-the-fly)
- $206,770
- Comps found
- 2
Show comp detail 2 sales within ~0.75 mi
| Address | Dist | Beds/Ba | Sqft | Sold | Price | $/sf | Match |
|---|---|---|---|---|---|---|---|
| 158 Costa Ave | 0.53mi | 2/1.0 | 794 (-12%) | 11mo | $182,500 | $230 | 47 |
| 327 River Rd | 0.50mi | 2/1.0 | 814 (-10%) | 24mo | $140,000 | $172 | 41 |
Match score weights: distance 35% · size 25% · config 20% · recency 20%. Top-matched comps best support the ARV.
Projected returns pro-forma
-2.41% appreciation · 3.0% rent growth · sell at horizon
- IRR
- -6.3%
- Equity multiple
- 0.75×
- Total profit
- $-5,115
- Equity at exit
- $12,989
- IRR
- 2.8%
- Equity multiple
- 1.22×
- Total profit
- $4,531
- Equity at exit
- $9,808
Cash invested: $20,720 (down + closing). Projections, not guarantees.
Landlord ↔ Tenant lean methodology
- Overall (STATE)
- 41 Moderately Tenant-Leaning
- State Vermont
- 41 Moderately Tenant-Leaning · D+15
- County
- — inherits STATE
- City
- — inherits STATE
ZIP-level market 05819
- Home prices YoY
- -0.8%
- Active inventory
- 66
- Price-to-rent
- 4.5×
Monthly cashflow live
- Estimated rent
- $1,361 medium interval (Pro) →
- Mortgage (P&I)
- −$388
- Tax from tax record
- −$122 /mo · $1,462/yr
- Insurance
- −$31
- Flood insurance flood zone
- −$460 /mo · $5,525/yr
- HOA
- −$0
- Vacancy / Maint / Mgmt
- −$286
- Net cashflow
- $74
Break-even live
Sensitivity live
| Price | -10% $116 | -5% $95 | +0% $74 | +5% $53 | +10% $32 |
|---|---|---|---|---|---|
| Rent | -10% $-33 | -5% $20 | +0% $74 | +5% $128 | +10% $182 |
| Rate | -1.0pp $111 | -0.5pp $93 | base $74 | +0.5pp $55 | +1.0pp $35 |
UW: 25.0% down · 7.5% · 30yr · 1.5% tax · 5.0% vac · 8.0% maint · 8.0% mgmt
Financing live
Cash to close
- Down payment
- $18,500
- Closing costs
- $2,220
- Reserves months
- —
- Total cash needed
- —
Loan-product check · same deal, 3 products live
Conventional
25% down · 7.5% · 30yr
- Down + closing
- —
- Monthly P&I
- —
- Monthly cashflow
- —
- DSCR
- —
- Eligible?
- —
Personal DTI + credit; lowest rate.
DSCR
20% down · 8.5% · 30yr
- Down + closing
- —
- Monthly P&I
- —
- Monthly cashflow
- —
- DSCR
- —
- Eligible?
- —
No personal income docs; deal must DSCR.
Hard money
10% down · 12.0% · 12mo
- Down + closing
- —
- Monthly P&I
- —
- Monthly cashflow
- —
- DSCR
- —
- Eligible?
- —
Short-term bridge; refi at stabilization.
Listing history 21 events
-
2026-06-21days on market $74,000 Active 85 DOM
-
2026-06-21days on market $74,000 Active 84 DOM
-
2026-06-18days on market $74,000 Active 82 DOM
-
2026-06-17days on market $74,000 Active 81 DOM
-
2026-06-16days on market $74,000 Active 80 DOM
-
2026-06-15days on market $74,000 Active 79 DOM
-
2026-06-15days on market $74,000 Active 78 DOM
-
2026-06-13days on market $74,000 Active 77 DOM
-
2026-06-12days on market $74,000 Active 76 DOM
-
2026-06-09days on market $74,000 Active 73 DOM
-
2026-06-08days on market $74,000 Active 72 DOM
-
2026-06-08days on market $74,000 Active 71 DOM
-
2026-06-07days on market $74,000 Active 70 DOM
-
2026-06-03days on market $74,000 Active 67 DOM
-
2026-06-02pricedays on market $74,000 Active 66 DOM
-
2026-06-01days on market $79,000 Active 65 DOM
-
2026-05-31days on market $79,000 Active 64 DOM
-
2026-05-19price $79,000
-
2026-05-06price $84,000
-
2026-03-28$89,000 Active
-
2021-02-09price $75,000
ⓘ Source: listings_history table (triggers on properties + properties_extension) + one-shot
backfill from property_details.listing_events for pre-trigger history.
Tax reassessment forecast VT · Partial reset (capped growth)
- Current annual tax
- $1,462 · $122/mo
- Projected year-2 tax
- $1,462 · $122/mo
- Expected delta
- $0/yr ($0/mo · 0.0%)
ⓘ Screening estimate from a state-policy table — verify with the county assessor before closing.
Climate risk First Street
- Flood 1/10 Low FEMA zone AE · 0% chance over 30 yrs
- Wildfire 1/10 Low
- Heat 2/10 Low 7 d/yr ≥90°F today · 17 d/yr by 30 yrs out
- Wind 2/10 Low 4% chance of damaging wind over 30 yrs
- Air quality 2/10 Low 1 unhealthy d/yr today · 1 by 30 yrs out
Nearby sold comps map
Loading sold comps map…
Walkable amenities ~0.75 mi
Loading nearby amenities…
Taxation est. · year 1
- Rental income
- $16,332
- − Mortgage interest
- −$4,145
- − Property taxes
- −$1,462
- − Insurance
- −$5,895
- − Repairs & maintenance
- −$1,307
- − Management
- −$1,307
- − Depreciation
- −$2,153
- Taxable income
- $64
- Est. tax owed @ 24.0%
- −$15
- After-tax cash flow
- $873/yr
For passive investors: Depreciation is non-cash, so a rental often shows a tax loss while cash-flowing — sheltering income. Rental losses are passive: they offset passive income freely, and up to $25,000/yr can offset ordinary (W-2) income if you actively participate and your MAGI is under $100k (phasing out to $0 by $150k); unused losses carry forward. On sale, claimed depreciation is recaptured at up to 25%, and gains may owe capital-gains tax (a 1031 exchange can defer both). Figures are a year-1 estimate at your 24.0% rate — not tax advice; consult a CPA.
Schools (NCES district)
No district data.
Livability — St. Johnsbury
No livability data for this city. (Only ~50 U.S. cities are tracked.)
Census & demographics
- Census place
- St. Johnsbury, VT
- Population (ZIP)
- 9,323
Population outlook (Caledonia County) Hauer SSP2
- Today (2025)
- 29,828 people
- By 2030
- 28,820 · -3.4%
- By 2040
- 26,262 · -12.0%
- By 2050
- 23,780 · -20.3%
- By 2075
- 18,516 · -37.9%
- By 2100
- 13,647 · -54.2%
Race, ethnicity, and origin ACS 2023
- Neighborhood character
- Predominantly White (92%)
- Race & ethnicity
- White 92% Two or more races 5% Hispanic / Latino 2%
- Common ancestry
- Lithuanian 11% Slovak 6% Serbian 3%
- Foreign-born
- 2% · Canada
- Languages at home
- 93% English-only · French/Haitian/Cajun 3% Other Asian/Pacific 2% Spanish 1%
Political lean MEDSL · Caledonia
- 2024 margin
- D (+12.4) · D 54.5% · R 42.0% · Other 3.5%
- 2008→2024 swing
- -10.8pp toward R · 2008: 23.3pp · 2024: 12.4pp
- All cycles
- 2024: D+12.4 2020: D+15.2 2016: D+7.0 2012: D+22.9 2008: D+23.3
Not yet ingested
- Civics
- —
Market trends
- HPI YoY
- ▼ -2.41%
- Current HPI
- 291.8894
- Rent YoY
- —
- Metro
- —
- State GDP YoY
- —
- F500 in state
- 0
Price history
+5.3% since first listed4 events — show timeline
- 2026-05-19 Price Changed $79,000 PrimeMLS
- 2026-05-06 Price Changed $84,000 PrimeMLS
- 2026-03-28 Listed $89,000 PrimeMLS
- 2021-02-09 Price Changed $75,000 PrimeMLS
Property tax history
+2.1%/yrLatest (2024): $1,462 · +18.7% YoY. Source: county tax records.
Cash-flow waterfall
monthlySold comps — $/sqft
last 12 mo · ≤1 miLoading sold comps…