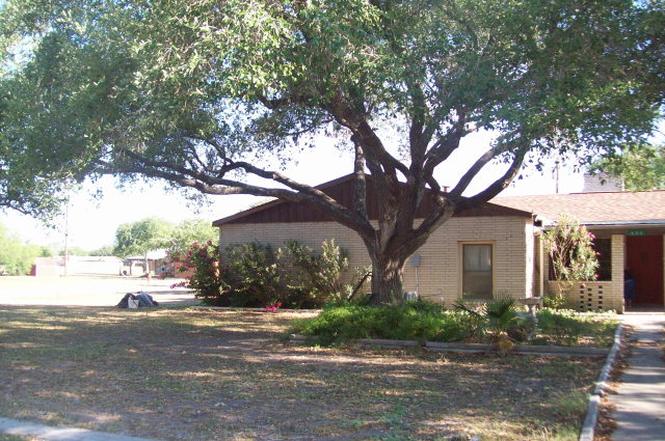
602 E Stinson · Freer, TX
Flood risk 7/10 · Major
- FEMA flood zone
- X (unshaded)
- Chance of flooding over 30 yrs
- 0.99%
- Est. flood insurance / yr
- $507 – $1,088
Fire risk 5/10 · Moderate
- Est. fire insurance / yr
- $1,222 – $2,270
Heat risk 9/10 · Severe
- Hot days now (above 111°F)
- 7 days/yr
- Hot days in 30 yrs
- 23 days/yr
Wind risk 8/10 · Major
- Chance of severe wind over 30 yrs
- 94.0%
Air-quality risk 1/10 · Minimal
- Unhealthy air days now
- 0 days/yr
- Unhealthy air days in 30 yrs
- 0 days/yr
Risk factors via First Street. Map © Google.
Why this score? — see what drove the C+ grade
The composite is a weighted blend of 9 inputs, each scored 0–100. Each bar is that input's sub-score; the figure is the points it added to the 100-point composite (weight × sub-score).
- Cash flow +20.5/30.0
- ARV discount +15.0/15.0
- DSCR +6.5/10.0
- 1% rule +5.4/10.0
- Appreciation +5.0/10.0
- Livability +3.3/5.0
- Schools +2.8/10.0
- Rent growth +2.5/5.0
- Condition / age +2.5/5.0
$135,000
🖨 Deal sheet (PDF) 📄 Offer letter ✓ Due diligence
Listing remarks
One side of home 3/2 with living room, kitchen, one car garage, built in gun cabinet, large bedrooms with walk in closets, one full bath and master is shower Second living is 2/1 with kitchen and built in shelving, carport and utility Both share large living room, terrazo tile, fireplace (needs inspection) each home has central air and heat
Key facts
- 0.77 acre lot
- Built 1965
Neighborhood map
What this means for you Summary
Snapshot
- This is a 5-bed/3.0-bath single-family listed at $135k.
Deal economics
- At list price, monthly cash flow is $112 ($1k/yr) — positive.
- The deal already cash-flows at list — no discount required.
- Meets the 1% rule at list price ($1k rent vs $135k).
Location & tenants
- Location reads 66/100 on livability (#643 in TX) — a middle-class / working-renter tenant base. Strengths: cost of living A+, housing A+, crime B+; Watch: employment C-, health & safety C-, amenities F.
- Freer ISD (rural): math 34% / reading 31% proficiency, ranked #575 of 826 in TX (top 70%) — families likely to look elsewhere, expect single-tenant / working-renter base with shorter leases; 65% free/reduced lunch — lower-income household profile, screen leases tightly.
- Zoned schools: Norman M Thomas El (math 42% / reading 27%, grade F, #1,995 of 4,322 statewide, top 50%, 374 students, 80% FRL); Lucy Aragon J H (math 27% / reading 32%, grade F, #1,077 of 1,662 statewide, top 66%, 190 students, 83% FRL); Freer H S (math 24% / reading 34%, grade F, #1,112 of 1,632 statewide, top 70%, 170 students, 81% FRL) — zoned schools average 81% FRL vs 65% district-wide (17 pts higher); higher-poverty schools than district average — tighter screening recommended.
- Market conditions: 21 active listings in the ZIP.
Forward outlook
- In year one you build about $924 of equity ($933 loan paydown + $-9 appreciation (-0.0% local appreciation)).
- Duval County population projected at -12% by 2050 — secular population decline; favor cash flow + early exit over multi-decade hold.
- At projected returns (-0.0% appreciation + 3.0% rent growth), your $38k cash investment doubles in ~10 years — after that, you're playing with house money.
Negotiation context
- Only 0 days on market — expect competitive offers; lowballing is unlikely to land.
Risks & watch-outs
- Watch-outs: flood insurance adds $66/mo.
- Climate carrying-cost: major flood risk; severe wind risk, 94% chance of damaging wind over 30y; moderate wildfire risk; extreme-heat days projected 7→23/yr by 2055 (HVAC capex compounding) — expect insurance premiums to compound above CPI over the hold.
Questions for the listing agent
- Built in 1965 — when were the roof, HVAC, electrical panel, plumbing, and water heater last replaced?
- What's the actual annual flood-insurance premium (NFIP or private), and is the property in a SFHA with mandatory coverage?
- Is there a deadline driving the sale (1031 exchange, divorce, estate, relocation)? That informs how much negotiation room exists.
- Schools are F-rated, which usually means shorter tenancies and higher turnover. Who's the typical renter profile here, and what's been the actual vacancy rate?
- What's the average days-on-market for RENTAL listings here right now (not sales)? A rising rental-DOM trend means longer vacancies and softer asking-rent achievability than the comps imply.
- What's the recent tenant-quality profile in this submarket — average credit score on applications, eviction rate, late-payment / NSF rate, and stable-employment percentage? A property-management company in the area should have these aggregated.
- How much new for-sale + rental construction is in the pipeline within 1–3 miles? Heavy new supply typically softens prices + rents 12–24 months out; constrained supply supports both.
Investment metrics
- 1% rule
- 1.04% ✓
- Cap rate
- 7.88%
- Cash-on-cash
- 5.67%
- DSCR
- 1.25
- GRM
- 8.0
CMA / ARV
- ARV (on-the-fly)
- $253,920
- Comps found
- 1
Show comp detail 1 sale within ~0.75 mi
| Address | Dist | Beds/Ba | Sqft | Sold | Price | $/sf | Match |
|---|---|---|---|---|---|---|---|
| 404 Carle | 0.25mi | 4/3.0 (-1) | 3,466 (+9%) | 2mo | $279,000 | $80 | 66 |
Match score weights: distance 35% · size 25% · config 20% · recency 20%. Top-matched comps best support the ARV.
Projected returns pro-forma
-0.01% appreciation · 3.0% rent growth · sell at horizon
- IRR
- 1.8%
- Equity multiple
- 1.09×
- Total profit
- $3,219
- Equity at exit
- $39,155
- IRR
- 7.3%
- Equity multiple
- 1.79×
- Total profit
- $29,924
- Equity at exit
- $47,031
Cash invested: $37,800 (down + closing). Projections, not guarantees.
Landlord ↔ Tenant lean methodology
- Overall (STATE)
- 87 Strongly Landlord-Friendly
- State Texas
- 87 Strongly Landlord-Friendly · R+5
- County
- — inherits STATE
- City
- — inherits STATE
ZIP-level market 78357
- Home prices YoY
- -0.0%
- Active inventory
- 21
- Price-to-rent
- 8.0×
Monthly cashflow live
- Estimated rent
- $1,407 medium interval (Pro) →
- Mortgage (P&I)
- −$708
- Tax est. 1.5%
- −$169 /mo · $2,025/yr
- Insurance
- −$56
- Flood insurance flood zone
- −$66 /mo · $798/yr
- HOA
- −$0
- Vacancy / Maint / Mgmt
- −$296
- Net cashflow
- $112
Break-even live
Sensitivity live
| Price | -10% $206 | -5% $159 | +0% $112 | +5% $66 | +10% $19 |
|---|---|---|---|---|---|
| Rent | -10% $1 | -5% $57 | +0% $112 | +5% $168 | +10% $223 |
| Rate | -1.0pp $180 | -0.5pp $147 | base $112 | +0.5pp $77 | +1.0pp $42 |
UW: 25.0% down · 7.5% · 30yr · 1.5% tax · 5.0% vac · 8.0% maint · 8.0% mgmt
Financing live
Cash to close
- Down payment
- $33,750
- Closing costs
- $4,050
- Reserves months
- —
- Total cash needed
- —
Loan-product check · same deal, 3 products live
Conventional
25% down · 7.5% · 30yr
- Down + closing
- —
- Monthly P&I
- —
- Monthly cashflow
- —
- DSCR
- —
- Eligible?
- —
Personal DTI + credit; lowest rate.
DSCR
20% down · 8.5% · 30yr
- Down + closing
- —
- Monthly P&I
- —
- Monthly cashflow
- —
- DSCR
- —
- Eligible?
- —
No personal income docs; deal must DSCR.
Hard money
10% down · 12.0% · 12mo
- Down + closing
- —
- Monthly P&I
- —
- Monthly cashflow
- —
- DSCR
- —
- Eligible?
- —
Short-term bridge; refi at stabilization.
Climate risk First Street
- Flood 7/10 Severe FEMA zone X (unshaded) · 99% chance over 30 yrs
- Wildfire 5/10 Major
- Heat 9/10 Extreme 7 d/yr ≥111°F today · 23 d/yr by 30 yrs out
- Wind 8/10 Severe 94% chance of damaging wind over 30 yrs
- Air quality 1/10 Low 0 unhealthy d/yr today · 0 by 30 yrs out
Nearby sold comps map
Loading sold comps map…
Walkable amenities ~0.75 mi
Loading nearby amenities…
Taxation est. · year 1
- Rental income
- $16,886
- − Mortgage interest
- −$7,562
- − Property taxes
- −$2,025
- − Insurance
- −$1,472
- − Repairs & maintenance
- −$1,351
- − Management
- −$1,351
- − Depreciation
- −$3,927
- Taxable loss
- −$803
- Est. tax savings @ 24.0%
- +$193
- After-tax cash flow
- $1,539/yr
For passive investors: Depreciation is non-cash, so a rental often shows a tax loss while cash-flowing — sheltering income. Rental losses are passive: they offset passive income freely, and up to $25,000/yr can offset ordinary (W-2) income if you actively participate and your MAGI is under $100k (phasing out to $0 by $150k); unused losses carry forward. On sale, claimed depreciation is recaptured at up to 25%, and gains may owe capital-gains tax (a 1031 exchange can defer both). Figures are a year-1 estimate at your 24.0% rate — not tax advice; consult a CPA.
Schools (NCES district)
- District
- Freer ISD
- NCES district ID
- 4819820
- Math proficiency
- 34% ▼ -2.00%
- Reading proficiency
- 31% ▼ -4.00%
- Median HH income
- $43,849
- Composite
- 27.71/100
- National rank
- #6910
- State rank
- #575 of 826 in TX
Livability — Freer
- Score
- 66/100
- State rank
- #643
- US rank
- #12210
Category grades
Schools grade is shown separately in the Schools card above.
Census & demographics
- Census place
- Freer, TX
- Population (ZIP)
- 2,726
Population outlook (Duval County) Hauer SSP2
- Today (2025)
- 10,826 people
- By 2030
- 10,531 · -2.7%
- By 2040
- 10,015 · -7.5%
- By 2050
- 9,560 · -11.7%
- By 2075
- 8,442 · -22.0%
- By 2100
- 6,686 · -38.2%
Race, ethnicity, and origin ACS 2023
- Neighborhood character
- Predominantly Hispanic (77%)
- Race & ethnicity
- Hispanic / Latino 77% Two or more races 39% White 23%
- Hispanic origin (detail)
- Mexican 73%
- Common ancestry
- Lithuanian 1%
- Foreign-born
- 1% · Canada
- Languages at home
- 54% English-only · Spanish 41% German/W. Germanic 6%
Political lean MEDSL · Duval
- 2024 margin
- Lean R (+9.8) · D 44.9% · R 54.7%
- 2008→2024 swing
- -60.2pp toward R · 2008: 50.4pp · 2024: -9.8pp
- All cycles
- 2024: R+9.8 2020: D+2.6 2016: D+35.3 2012: D+54.2 2008: D+50.4
Not yet ingested
- Civics
- —
Market trends
- HPI YoY
- ▬ -0.01%
- Current HPI
- 98.4455
- Rent YoY
- —
- Metro
- —
- State GDP YoY
- ▲ 3.95%
- F500 in state
- 110
Industry mix (Fortune 500 HQ in TX)
| Industry | F500 HQs | Revenue |
|---|---|---|
| Energy | 16 | $1,198B |
|
||
| Technology | 5 | $198B |
|
||
| Engineering / Construction | 4 | $72B |
|
||
| Energy Services | 3 | $60B |
|
||
| Utilities | 3 | $41B |
|
||
| Healthcare | 2 | $330B |
|
||
Cash-flow waterfall
monthlySold comps — $/sqft
last 12 mo · ≤1 miLoading sold comps…