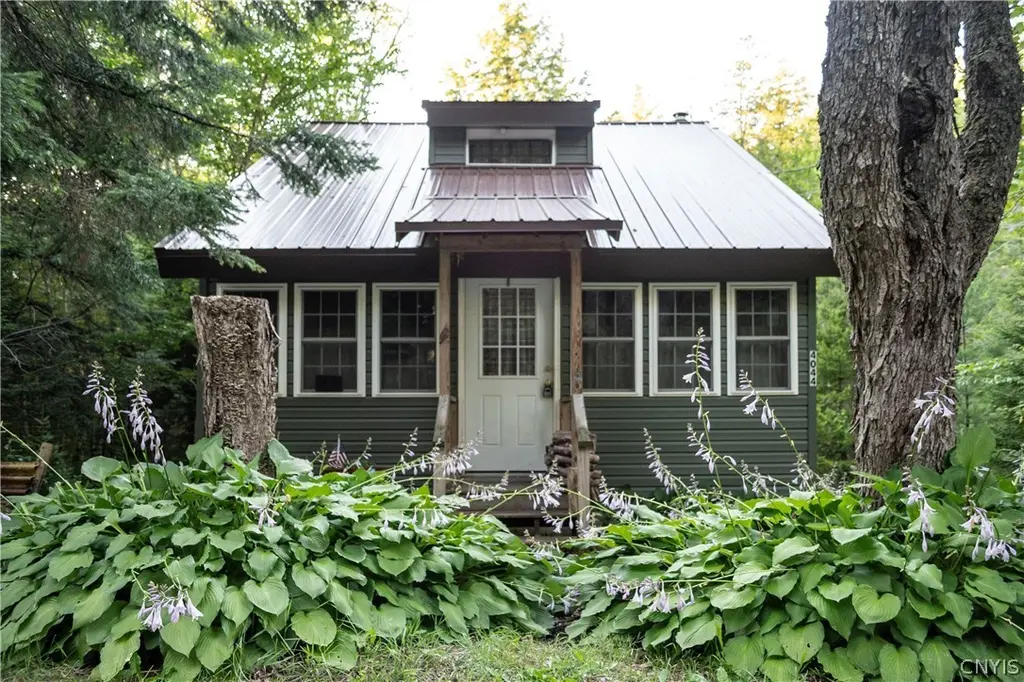
4044 Norton Rd · Otter Lake, NY
Flood risk 1/10 · Minimal
- FEMA flood zone
- X (unshaded)
- Chance of flooding over 30 yrs
- 0.0%
- Est. flood insurance / yr
- $473 – $860
Fire risk 1/10 · Minimal
- Est. fire insurance / yr
- $691 – $1,283
Heat risk 1/10 · Minimal
- Hot days now (above 87°F)
- 7 days/yr
- Hot days in 30 yrs
- 16 days/yr
Wind risk 1/10 · Minimal
- Chance of severe wind over 30 yrs
- —
Air-quality risk 1/10 · Minimal
- Unhealthy air days now
- 0 days/yr
- Unhealthy air days in 30 yrs
- 0 days/yr
Risk factors via First Street. Map © Google.
Why this score? — see what drove the D grade
The composite is a weighted blend of 9 inputs, each scored 0–100. Each bar is that input's sub-score; the figure is the points it added to the 100-point composite (weight × sub-score).
- Appreciation +8.9/10.0
- Cash flow +8.7/30.0
- ARV discount +7.5/15.0
- Schools +4.7/10.0
- Rent growth +2.5/5.0
- Livability +2.5/5.0
- Condition / age +2.5/5.0
- DSCR +2.4/10.0
- 1% rule +1.4/10.0
$294,700
🖨 Deal sheet (PDF) 📄 Offer letter ✓ Due diligence
Listing remarks
Escape to your ADK Retreat! This charming Adirondack cottage blends rustic character with thoughtful updates. This inviting 4 bedroom, 1 bath cottage features an updated primary bedroom complete with a dedicated laundry room for your convenience. Inside, you'll find a warm and cozy atmosphere, highlighted by a wood burning stove- ideal for relaxing after a day of outdoor adventure. The 3 season front porch offers a peaceful spot to unwind, sip your morning coffee and take in the natural surroundings. For lake lovers, the option to join the Otter Lake Association provides easy access to the water. The full basement offers excellent storage or workshop potential. Perfectly situated near sno
Key facts
- Large adjacent lot
- 3 season front porch
- Full basement
Tags
Property features AI
Exterior
- Parking: No garage
- Utilities: Private well water; Septic tank
- Home design: Two-story property; Existing/previously built structure
- Construction: Vinyl siding; Metal roof; Block foundation; Built previously (existing)
- Exterior features: Enclosed porch; Covered porch; Porch; Dirt driveway; Propane tank (leased); Rectangular, partly wooded lot; Beach access to Otter Lake; Lake frontage / lake access
Interior
- Kitchen: Free‑standing range; Oven; Refrigerator
- Bedrooms: 2 bedrooms on the main level
- Flooring: Hardwood and varied flooring
- Bathrooms: 1 full bathroom on the main level
- Heating & cooling: Electric and propane heating; Heating stove noted
- Interior features: Kitchen and family room combined; Main level primary bedroom; Bedroom on main level; Full basement; Wood-burning stove or stove listed as a heat source; One fireplace
- Laundry & utility: Washer and dryer located on the main level; Electric water heater
Neighborhood map
What this means for you Summary
Snapshot
- This is a 3-bed/1.0-bath single-family listed at $295k.
Deal economics
- At list price, monthly cash flow is $-248 ($-3k/yr) — negative.
- To cash-flow at today's rent, offer at most $251k (14.9% below list).
- To meet the 1% rule (rent ≥ 1% of price), the offer needs to be $188k (36.1% below list).
- Recommended offer: $188k (36.1% below list) — sets the bar for 1% rule.
Location & tenants
- Location reads: area grade D — affects rentability + tenant quality, not the cash-flow math above.
- Town Of Webb Union Free School District (rural): math 50% / reading 55% proficiency, ranked #404 of 755 in NY (top 54%) — acceptable for families but not a draw, mixed tenant base, ~2y average lease.
- Market conditions: 40 active listings in the ZIP; 204 units permitted in Oneida County in 2024 (68 in 5+ unit buildings).
Forward outlook
- In year one you build about $25k of equity ($2k loan paydown + $23k appreciation (7.9% local appreciation)).
- Oneida County population projected at -12% by 2050 — secular population decline; favor cash flow + early exit over multi-decade hold.
- By year 2, paydown + projected appreciation supports a ~$40k cash-out refi (75% LTV) — recoverable capital for the next deal without selling this one.
Negotiation context
- It's been on market 31 days — a 3% lower offer ($286k) is reasonable based on typical stale-listing flexibility.
- 2 sale attempts with the ask held roughly flat each time — persistent listings suggest the price (not the market) is what's stuck; bring a comps-based counter.
- Current owner paid $25k; list at $295k implies a 1079% gain — meaningful room to come down on a strong offer.
Risks & watch-outs
- Watch-outs: built in 1920 — expect roof / HVAC / electrical / plumbing capex.
Questions for the listing agent
- What do current leases actually rent for vs. the listed asking? Can we see a recent rent roll and the last 12 months of T-12 income?
- It's been on market 31 days. Have you received any prior offers? Is the seller open to a 36% concession, seller financing, or rate buy-down credit?
- Built in 1920 — when were the roof, HVAC, electrical panel, plumbing, and water heater last replaced?
- Is there a deadline driving the sale (1031 exchange, divorce, estate, relocation)? That informs how much negotiation room exists.
- The area grade is low — what's the realistic commute time and amenity access for the typical tenant pool here? Any planned neighborhood developments (good or bad) we should know about?
- What's the average days-on-market for RENTAL listings here right now (not sales)? A rising rental-DOM trend means longer vacancies and softer asking-rent achievability than the comps imply.
- What's the recent tenant-quality profile in this submarket — average credit score on applications, eviction rate, late-payment / NSF rate, and stable-employment percentage? A property-management company in the area should have these aggregated.
- How much new for-sale + rental construction is in the pipeline within 1–3 miles? Heavy new supply typically softens prices + rents 12–24 months out; constrained supply supports both.
Investment metrics
- 1% rule
- 0.64% ✗
- Cap rate
- 5.28%
- Cash-on-cash
- -3.60%
- DSCR
- 0.84
- GRM
- 13.0
CMA / ARV
- ARV (on-the-fly)
- $163,684
- Comps found
- 1
Show comp detail 1 sale within ~0.75 mi
| Address | Dist | Beds/Ba | Sqft | Sold | Price | $/sf | Match |
|---|---|---|---|---|---|---|---|
| 14082 State Rt 28 | 0.20mi | 3/2.0 | 960 (-11%) | 21mo | $145,000 | $151 | 50 |
Match score weights: distance 35% · size 25% · config 20% · recency 20%. Top-matched comps best support the ARV.
Projected returns pro-forma
7.87% appreciation · 3.0% rent growth · sell at horizon
- IRR
- 16.9%
- Equity multiple
- 2.25×
- Total profit
- $103,046
- Equity at exit
- $221,321
- IRR
- 16.2%
- Equity multiple
- 4.76×
- Total profit
- $310,309
- Equity at exit
- $436,890
Cash invested: $82,516 (down + closing). Projections, not guarantees.
Landlord ↔ Tenant lean methodology
- Overall (STATE)
- 15 Strongly Tenant-Friendly
- State New York
- 15 Strongly Tenant-Friendly · D+10
- County
- — inherits STATE
- City
- — inherits STATE
ZIP-level market 13338
- Home prices YoY
- 1.7%
- Active inventory
- 40
- Price-to-rent
- 13.0×
Monthly cashflow live
- Estimated rent
- $1,884 medium interval (Pro) →
- Mortgage (P&I)
- −$1,545
- Tax from tax record
- −$68 /mo · $815/yr
- Insurance
- −$123
- HOA
- −$0
- Vacancy / Maint / Mgmt
- −$396
- Net cashflow
- $-248
Break-even live
Sensitivity live
| Price | -10% $-81 | -5% $-164 | +0% $-248 | +5% $-331 | +10% $-415 |
|---|---|---|---|---|---|
| Rent | -10% $-397 | -5% $-322 | +0% $-248 | +5% $-173 | +10% $-99 |
| Rate | -1.0pp $-99 | -0.5pp $-173 | base $-248 | +0.5pp $-324 | +1.0pp $-402 |
UW: 25.0% down · 7.5% · 30yr · 1.5% tax · 5.0% vac · 8.0% maint · 8.0% mgmt
Financing live
Cash to close
- Down payment
- $73,675
- Closing costs
- $8,841
- Reserves months
- —
- Total cash needed
- —
Loan-product check · same deal, 3 products live
Conventional
25% down · 7.5% · 30yr
- Down + closing
- —
- Monthly P&I
- —
- Monthly cashflow
- —
- DSCR
- —
- Eligible?
- —
Personal DTI + credit; lowest rate.
DSCR
20% down · 8.5% · 30yr
- Down + closing
- —
- Monthly P&I
- —
- Monthly cashflow
- —
- DSCR
- —
- Eligible?
- —
No personal income docs; deal must DSCR.
Hard money
10% down · 12.0% · 12mo
- Down + closing
- —
- Monthly P&I
- —
- Monthly cashflow
- —
- DSCR
- —
- Eligible?
- —
Short-term bridge; refi at stabilization.
Listing history 20 events
-
2026-06-21days on market $294,700 Active 31 DOM
-
2026-06-21days on market $294,700 Active 30 DOM
-
2026-06-18days on market $294,700 Active 28 DOM
-
2026-06-17days on market $294,700 Active 27 DOM
-
2026-06-16days on market $294,700 Active 26 DOM
-
2026-06-15days on market $294,700 Active 25 DOM
-
2026-06-13days on market $294,700 Active 23 DOM
-
2026-06-12days on market $294,700 Active 22 DOM
-
2026-06-09days on market $294,700 Active 19 DOM
-
2026-06-08days on market $294,700 Active 18 DOM
-
2026-06-07days on market $294,700 Active 17 DOM
-
2026-06-07days on market $294,700 Active 16 DOM
-
2026-06-04days on market $294,700 Active 13 DOM
-
2026-06-02days on market $294,700 Active 12 DOM
-
2026-06-01days on market $294,700 Active 11 DOM
-
2026-05-31days on market $294,700 Active 10 DOM
-
2026-05-21$294,700 Active
-
2025-12-31historical
-
2025-07-24$294,700 Active
-
1994-01-21soldstatus $25,000
ⓘ Source: listings_history table (triggers on properties + properties_extension) + one-shot
backfill from property_details.listing_events for pre-trigger history.
Tax reassessment forecast NY · Partial reset (capped growth)
- Current annual tax
- $815 · $68/mo
- Projected year-2 tax
- $2,898 · $241/mo
- Expected delta
- +$2,083/yr (+$174/mo · 255.4%)
ⓘ Screening estimate from a state-policy table — verify with the county assessor before closing.
Climate risk First Street
- Flood 1/10 Low FEMA zone X (unshaded) · 0% chance over 30 yrs
- Wildfire 1/10 Low
- Heat 1/10 Low 7 d/yr ≥87°F today · 16 d/yr by 30 yrs out
- Wind 1/10 Low
- Air quality 1/10 Low 0 unhealthy d/yr today · 0 by 30 yrs out
Nearby sold comps map
Loading sold comps map…
Walkable amenities ~0.75 mi
Loading nearby amenities…
Taxation est. · year 1
- Rental income
- $22,608
- − Mortgage interest
- −$16,508
- − Property taxes
- −$815
- − Insurance
- −$1,474
- − Repairs & maintenance
- −$1,809
- − Management
- −$1,809
- − Depreciation
- −$8,573
- Taxable loss
- −$8,379
- Est. tax savings @ 24.0%
- +$2,011
- After-tax cash flow
- $-963/yr
For passive investors: Depreciation is non-cash, so a rental often shows a tax loss while cash-flowing — sheltering income. Rental losses are passive: they offset passive income freely, and up to $25,000/yr can offset ordinary (W-2) income if you actively participate and your MAGI is under $100k (phasing out to $0 by $150k); unused losses carry forward. On sale, claimed depreciation is recaptured at up to 25%, and gains may owe capital-gains tax (a 1031 exchange can defer both). Figures are a year-1 estimate at your 24.0% rate — not tax advice; consult a CPA.
Schools (NCES district)
- District
- Town Of Webb Union Free School District
- NCES district ID
- 3628800
- Math proficiency
- 50% ▬ 0.00%
- Reading proficiency
- 55% ▬ 0.00%
- Median HH income
- $52,522
- Composite
- 47.01/100
- National rank
- #5138
- State rank
- #404 of 755 in NY
Livability — Otter Lake
No livability data for this city. (Only ~50 U.S. cities are tracked.)
Census & demographics
- Census place
- Otter Lake, NY
- Population (ZIP)
- 1,293
Population outlook (Oneida County) Hauer SSP2
- Today (2025)
- 225,223 people
- By 2030
- 220,384 · -2.1%
- By 2040
- 209,071 · -7.2%
- By 2050
- 197,920 · -12.1%
- By 2075
- 175,541 · -22.1%
- By 2100
- 148,491 · -34.1%
Race, ethnicity, and origin ACS 2023
- Neighborhood character
- Predominantly White (98%)
- Race & ethnicity
- White 98%
- Common ancestry
- Romanian 9% Lithuanian 6% Subsaharan African 5%
- Foreign-born
- 4% · China
- Languages at home
- 93% English-only · Russian/Polish/Slavic 5% Chinese 1% Other Asian/Pacific 1%
Political lean MEDSL · Oneida
- 2024 margin
- Strong R (+21.3) · D 39.4% · R 60.6%
- 2008→2024 swing
- -15.2pp toward R · 2008: -6.1pp · 2024: -21.3pp
- All cycles
- 2024: R+21.3 2020: R+15.5 2016: R+21.1 2012: R+5.3 2008: R+6.1
Not yet ingested
- Civics
- —
Market trends
- HPI YoY
- ▲ 7.87%
- Current HPI
- 470.5822
- Rent YoY
- —
- Metro
- —
- State GDP YoY
- ▲ 2.60%
- F500 in state
- 92
Industry mix (Fortune 500 HQ in NY)
| Industry | F500 HQs | Revenue |
|---|---|---|
| Financial Services | 10 | $950B |
|
||
| Consumer Goods | 9 | $162B |
|
||
| Insurance | 4 | $225B |
|
||
| Telecommunications | 2 | $144B |
|
||
| Pharmaceuticals | 2 | $112B |
|
||
| Media / Entertainment | 2 | $69B |
|
||
Price history
+1078.8% since first listed4 events — show timeline
- 2026-05-21 Listed $294,700 CNYIS
- 2025-12-31 Listing Removed — CNYIS
- 2025-07-24 Listed $294,700 CNYIS
- 1994-01-21 Sold (Public Records) $25,000 Public Records
Property tax history
+1.5%/yrLatest (2025): $815 · +14.2% YoY. Source: county tax records.
Cash-flow waterfall
monthlySold comps — $/sqft
last 12 mo · ≤1 miLoading sold comps…