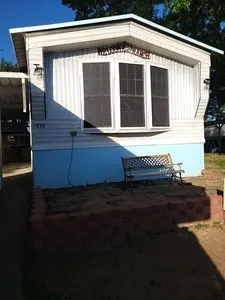
1532 Stagecoach Rd · Van Buren, AR
Flood risk No data
- FEMA flood zone
- —
- Chance of flooding over 30 yrs
- —
- Est. flood insurance / yr
- —
Fire risk No data
- Est. fire insurance / yr
- —
Heat risk No data
- Hot days now (above threshold)
- —
- Hot days in 30 yrs
- —
Wind risk No data
- Chance of severe wind over 30 yrs
- —
Air-quality risk No data
- Unhealthy air days now
- —
- Unhealthy air days in 30 yrs
- —
Risk factors via First Street. Map © Google.
Why this score? — see what drove the B+ grade
The composite is a weighted blend of 9 inputs, each scored 0–100. Each bar is that input's sub-score; the figure is the points it added to the 100-point composite (weight × sub-score).
- Cash flow +30.0/30.0
- ARV discount +15.0/15.0
- 1% rule +10.0/10.0
- DSCR +10.0/10.0
- Rent growth +3.7/5.0
- Livability +3.5/5.0
- Schools +3.4/10.0
- Condition / age +2.5/5.0
- Appreciation +0.0/10.0
$25,000
🖨 Deal sheet 📄 Offer letter ✓ Due diligence
Listing remarks
Super Nice Updated Home. Ready to slow down, look no father than this 1995 2 bedroom and 2 bath home located in the retirement Flat Rock Village. Updates and improvements include metal roof and vinyl windows installed in 2019, commodes, kitchen faucet, disposal and hot water tank all in 2024. Not only electrical and plumbing improvements but hurricane anchors, leveling and tie down reinforcement completed in 2024. Hot summers, don't worry a new heat and air system installed this year 2026. Don't forget all those extras like the heavy aluminum carport and covered porch to keep dry and out of the sun. Storage this home has that too. The back shed is a 10X10 but the Big storage/shop is a 12X1
Key facts
- Covered porch
- Vinyl windows
- Metal roof
Tags
Neighborhood map
What this means for you Summary
Snapshot
- This is a 2-bed/1.0-bath manufactured listed at $25k.
Deal economics
- At list price, monthly cash flow is $564 ($7k/yr) — positive.
- The deal already cash-flows at list — no discount required.
- Meets the 1% rule at list price ($903 rent vs $25k).
- Cap rate 33.4% vs local median 3.9% in Van Buren — top-decile yield for the area; either an underpriced asset or a hidden risk that comps aren't pricing in. Stress-test before assuming the spread holds.
Location & tenants
- Location reads 69/100 on livability (#75 in AR) — a middle-class / working-renter tenant base. Strengths: cost of living A+, housing A+, health & safety A; Watch: employment D, crime D-, amenities F.
- Van Buren School District (suburban): math 41% / reading 41% proficiency, ranked #62 of 238 in AR (top 26%) — families likely to look elsewhere, expect single-tenant / working-renter base with shorter leases.
- Market conditions: Rents rising fast (+4.8%/yr); 247 active listings in the ZIP; 5 comparable units currently listed for rent nearby; rentals leasing fast (median 14d on market — plan ~1-2 weeks tenant-placement turnaround); 47 units permitted in Crawford County in 2024 (0 in 5+ unit buildings).
- This rent is only 17% of the median local income ($63k/yr) — well below the 30% rent-burden line; pricing power to push rent on renewal without tenant pushback.
Forward outlook
- Local home prices are declining (-3.0%/yr); year-one equity from $173 of loan paydown is wiped out by about $750 of value loss. Plan a longer hold.
- Crawford County population projected to shrink 7% by 2050 — rents likely to lag national; underwrite the cash flow, not the appreciation.
- At projected returns (-3.0% appreciation + 4.8% rent growth), your $7k cash investment doubles in ~2 years — after that, you're playing with house money.
Negotiation context
- Only 7 days on market — expect competitive offers; lowballing is unlikely to land.
Questions for the listing agent
- Is there a deadline driving the sale (1031 exchange, divorce, estate, relocation)? That informs how much negotiation room exists.
- Crime grade is D in this area — have there been break-ins, vandalism, or insurance claims at this property in the last 3 years? What carrier currently insures it and at what premium?
- What's the average days-on-market for RENTAL listings here right now (not sales)? A rising rental-DOM trend means longer vacancies and softer asking-rent achievability than the comps imply.
- What's the recent tenant-quality profile in this submarket — average credit score on applications, eviction rate, late-payment / NSF rate, and stable-employment percentage? A property-management company in the area should have these aggregated.
- How much new for-sale + rental construction is in the pipeline within 1–3 miles? Heavy new supply typically softens prices + rents 12–24 months out; constrained supply supports both.
Investment metrics
- 1% rule
- 3.61% ✓
- Cap rate
- 33.39%
- Cash-on-cash
- 96.77%
- DSCR
- 5.31
- GRM
- 2.3
CMA / ARV
- ARV (on-the-fly)
- $44,992
- Comps found
- 5
Show comp detail 5 sales within ~0.75 mi
| Address | Dist | Beds/Ba | Sqft | Sold | Price | $/sf | Match |
|---|---|---|---|---|---|---|---|
| 1518 Cherokee Trl | 0.11mi | 2/2.0 | 1,216 (0%) | 10mo | $45,000 | $37 | 83 |
| 1526 Lincoln Trl | 0.03mi | 3/2.0 (+1) | 1,216 (0%) | 10mo | $44,900 | $37 | 82 |
| 1537 Cherokee Trl | 0.02mi | 3/2.0 (+1) | 1,216 (0%) | 22mo | $44,000 | $36 | 72 |
| 1506 Cherokee Trl | 0.14mi | 3/2.0 (+1) | 1,216 (0%) | 16mo | $18,000 | $15 | 72 |
| 1608 Cherokee Trl | 0.06mi | 2/2.0 | 1,056 (-13%) | 15mo | $56,000 | $53 | 58 |
Match score weights: distance 35% · size 25% · config 20% · recency 20%. Top-matched comps best support the ARV.
Projected returns pro-forma
-3.0% appreciation · 4.76% rent growth · sell at horizon
- IRR
- 99.6%
- Equity multiple
- 5.79×
- Total profit
- $33,526
- Equity at exit
- $3,728
- IRR
- —
- Equity multiple
- 12.77×
- Total profit
- $82,402
- Equity at exit
- $2,162
Cash invested: $7,000 (down + closing). Projections, not guarantees.
Landlord ↔ Tenant lean methodology
- Overall (STATE)
- 92 Strongly Landlord-Friendly
- State Arkansas
- 92 Strongly Landlord-Friendly · R+14
- County
- — inherits STATE
- City
- — inherits STATE
ZIP-level market 72956
- Rents YoY
- 4.8%
- Active inventory
- 247
- Price-to-rent
- 2.3×
Monthly cashflow live
- Estimated rent
- $903 high interval (Pro) →
- Mortgage (P&I)
- −$131
- Tax from tax record
- −$7 /mo · $87/yr
- Insurance
- −$10
- HOA
- −$0
- Vacancy / Maint / Mgmt
- −$190
- Net cashflow
- $564
Break-even live
UW: 25.0% down · 7.5% · 30yr · 1.5% tax · 5.0% vac · 8.0% maint · 8.0% mgmt
Financing live
Cash to close
- Down payment
- $6,250
- Closing costs
- $750
- Reserves months
- —
- Total cash needed
- —
Loan-product check · same deal, 3 products live
Conventional
25% down · 7.5% · 30yr
- Down + closing
- —
- Monthly P&I
- —
- Monthly cashflow
- —
- DSCR
- —
- Eligible?
- —
Personal DTI + credit; lowest rate.
DSCR
20% down · 8.5% · 30yr
- Down + closing
- —
- Monthly P&I
- —
- Monthly cashflow
- —
- DSCR
- —
- Eligible?
- —
No personal income docs; deal must DSCR.
Hard money
10% down · 12.0% · 12mo
- Down + closing
- —
- Monthly P&I
- —
- Monthly cashflow
- —
- DSCR
- —
- Eligible?
- —
Short-term bridge; refi at stabilization.
Rent comps 5 comps
| Address | Beds | Baths | Sqft | Rent | $/sqft | DOM | Units | Dist |
|---|---|---|---|---|---|---|---|---|
| 2005 N 30th St Van Buren, AR | 3.0 | 1.5 | 1276 | $1,100 | $0.86 | 13d | 1 | 0.50mi |
| 1363 Shadowalk Dr Unit 1363 Van Buren, AR | 2.0 | 2.5 | 1300 | $625 | $0.48 | 21d | 1 | 0.58mi |
| 2700 Rudy Road Cir Unit 2702 Van Buren, AR | 2.0 | 1.0 | 900 | $750 | $0.83 | 13d | 1 | 0.60mi |
| 4510 Alma Hwy Van Buren, AR | 3.0 | 2.0 | 1104 | $890 | $0.81 | 13d | 1 | 1.20mi |
| 818 N 25th St Van Buren, AR | 2.0 | 1.0 | 812 | $895 | $1.10 | 21d | 1 | 1.23mi |
Listing history 18 events
-
2026-06-19days on market $25,000 Active 7 DOM
-
2026-06-18days on market $25,000 Active 6 DOM
-
2026-06-17days on market $25,000 Active 5 DOM
-
2026-06-16days on market $25,000 Active 4 DOM
-
2026-06-15days on market $25,000 Active 3 DOM
-
2026-06-13remarks 699-char remark
-
2026-06-13pricedays on market $25,000 Active 1 DOM
-
2026-06-10days on market $30,000 Active 25 DOM
-
2026-06-09days on market $30,000 Active 24 DOM
-
2026-06-08days on market $30,000 Active 23 DOM
-
2026-06-07days on market $30,000 Active 22 DOM
-
2026-06-05days on market $30,000 Active 19 DOM
-
2026-06-03days on market $30,000 Active 18 DOM
-
2026-06-02days on market $30,000 Active 17 DOM
-
2026-06-01days on market $30,000 Active 16 DOM
-
2026-05-31days on market $30,000 Active 15 DOM
-
2026-05-30days on market $30,000 Active 14 DOM
-
2026-05-17$30,000 Active
ⓘ Source: listings_history table (triggers on properties + properties_extension) + one-shot
backfill from property_details.listing_events for pre-trigger history.
Tax reassessment forecast AR · Resets to sale price
- Current annual tax
- $87 · $7/mo
- Projected year-2 tax
- $160 · $13/mo
- Expected delta
- +$73/yr (+$6/mo · 83.2%)
ⓘ Screening estimate from a state-policy table — verify with the county assessor before closing.
Nearby sold comps map
Loading sold comps map…
Walkable amenities ~0.75 mi
Loading nearby amenities…
Taxation est. · year 1
- Rental income
- $10,834
- − Mortgage interest
- −$1,400
- − Property taxes
- −$87
- − Insurance
- −$125
- − Repairs & maintenance
- −$867
- − Management
- −$867
- − Depreciation
- −$727
- Taxable income
- $6,761
- Est. tax owed @ 24.0%
- −$1,623
- After-tax cash flow
- $5,151/yr
For passive investors: Depreciation is non-cash, so a rental often shows a tax loss while cash-flowing — sheltering income. Rental losses are passive: they offset passive income freely, and up to $25,000/yr can offset ordinary (W-2) income if you actively participate and your MAGI is under $100k (phasing out to $0 by $150k); unused losses carry forward. On sale, claimed depreciation is recaptured at up to 25%, and gains may owe capital-gains tax (a 1031 exchange can defer both). Figures are a year-1 estimate at your 24.0% rate — not tax advice; consult a CPA.
Schools (NCES district)
- District
- Van Buren School District
- NCES district ID
- 0513410
- Math proficiency
- 41% ▼ -8.00%
- Reading proficiency
- 41% ▼ -4.00%
- Median HH income
- $40,350
- Composite
- 34.41/100
- National rank
- #5201
- State rank
- #62 of 238 in AR
Livability — Van Buren
- Score
- 69/100
- State rank
- #75
- US rank
- #8898
Category grades
Schools grade is shown separately in the Schools card above.
Census & demographics
- County
- Crawford County · 34,546 people
- City population
- 34,546
- Metro
- Fort Smith, AR-OK
- Population (ZIP)
- 34,546
- Household income
- $62,988
- Rent vs Own
- Severe rent burden
- 571.0
Population outlook (Crawford County) Hauer SSP2
- Today (2025)
- 62,108 people
- By 2030
- 61,519 · -0.9%
- By 2040
- 59,735 · -3.8%
- By 2050
- 57,521 · -7.4%
- By 2075
- 53,143 · -14.4%
- By 2100
- 49,596 · -20.1%
Race, ethnicity, and origin ACS 2023
- Neighborhood character
- Predominantly White (76%)
- Race & ethnicity
- White 76% Hispanic / Latino 12% Two or more races 11% Asian 2% Native American 1% Black 1%
- Hispanic origin (detail)
- Mexican 5%
- Common ancestry
- Lithuanian 1% Slovak 1% Romanian 1%
- Foreign-born
- 6% · Canada
- Languages at home
- 89% English-only · Spanish 10%
Political lean MEDSL · Crawford
- 2024 margin
- Solid R (+58.2) · D 19.9% · R 78.1% · Other 2.0%
- 2008→2024 swing
- -12.1pp toward R · 2008: -46.0pp · 2024: -58.2pp
- All cycles
- 2024: R+58.2 2020: R+56.7 2016: R+55.0 2012: R+49.9 2008: R+46.0
Not yet ingested
- Civics
- —
Market trends
- HPI YoY
- ▼ -156.05%
- Current HPI
- 221.3066
- Rent YoY
- ▲ 4.76%
- Metro
- Fort Smith, AR-OK
- State GDP YoY
- ▲ 3.80%
- F500 in state
- 10
Industry mix (Fortune 500 HQ in AR)
| Industry | F500 HQs | Revenue |
|---|---|---|
| Retail | 1 | $681B |
|
||
| Food / Agriculture | 1 | $53B |
|
||
| Retail / Energy | 1 | $22B |
|
||
| Transportation / Logistics | 1 | $12B |
|
||
| Energy | 1 | $4B |
|
||
Price history
1 event — show timeline
- 2026-05-17 Listed $30,000 FSBO.com
Cash-flow waterfall
monthlySold comps — $/sqft
last 12 mo · ≤1 miLoading sold comps…