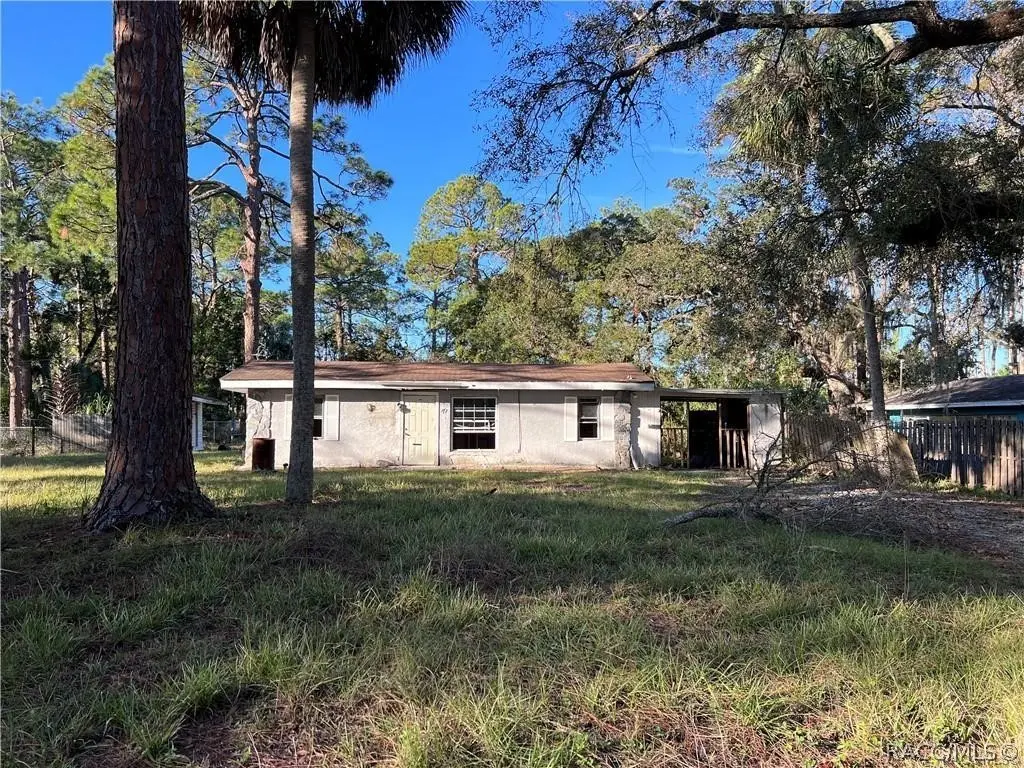
49 63rd St · Yankeetown, FL
Flood risk 10/10 · Severe
- FEMA flood zone
- AE
- Chance of flooding over 30 yrs
- 0.99%
- Est. flood insurance / yr
- $1,737 – $8,500
Fire risk 6/10 · Moderate
- Est. fire insurance / yr
- $947 – $1,759
Heat risk 9/10 · Severe
- Hot days now (above 109°F)
- 7 days/yr
- Hot days in 30 yrs
- 25 days/yr
Wind risk 9/10 · Severe
- Chance of severe wind over 30 yrs
- 99.0%
Air-quality risk 1/10 · Minimal
- Unhealthy air days now
- 0 days/yr
- Unhealthy air days in 30 yrs
- 0 days/yr
Risk factors via First Street. Map © Google.
Why this score? — see what drove the B grade
The composite is a weighted blend of 9 inputs, each scored 0–100. Each bar is that input's sub-score; the figure is the points it added to the 100-point composite (weight × sub-score).
- Cash flow +30.0/30.0
- DSCR +10.0/10.0
- 1% rule +9.3/10.0
- ARV discount +7.5/15.0
- Appreciation +5.6/10.0
- Schools +3.6/10.0
- Livability +2.8/5.0
- Rent growth +2.5/5.0
- Condition / age +2.5/5.0
$80,000
🖨 Deal sheet (PDF) 📄 Offer letter ✓ Due diligence
Listing remarks MLS
Investor's Dream in Yankeetown, Florida. This 3-bedroom, 1 bath home presents a unique opportunity for savvy investors. While it has experienced flooding from Hurricane Idalia, it offers a blank canvas for renovation and restoration. Situated in the charming town of Yankeetown, this property holds significant potential for those seeking to revitalize and capitalize on the resilient Florida real estate market.
Key facts
- Gulf of mexico
- Abundant wildlife
- Withlacoochee river
Tags
Property features AI
Exterior
- Parking: Attached carport; Private driveway; Boat parking; Total of 1 parking space
- Utilities: Public sewer and septic tank
- Home design: Single-family residence; One story
- Construction: Block and concrete construction; Block foundation; Asphalt shingle roof; Built on one level
- Exterior features: Cleared lot; Paved road access; No pool
Interior
- Flooring: Tile flooring
- Bathrooms: One full bathroom
- Heating & cooling: Central air conditioning
- Interior features: Master bedroom located downstairs
Neighborhood map
What this means for you Summary
Snapshot
- This is a 3-bed/1.0-bath single-family listed at $80k.
Deal economics
- At list price, monthly cash flow is $-98 ($-1k/yr) — negative.
- To cash-flow at today's rent, offer at most $63k (21.5% below list).
- Meets the 1% rule at list price ($1k rent vs $80k).
- Recommended offer: $63k (21.5% below list) — sets the bar for cash-flow.
- Cap rate 11.2% vs local median 0.5% in Yankeetown — top-decile yield for the area; either an underpriced asset or a hidden risk that comps aren't pricing in. Stress-test before assuming the spread holds.
Location & tenants
- Location reads 56/100 on livability (#869 in FL) — a working-class tenant base; expect higher turnover. Strengths: cost of living A+; Watch: health & safety C-, amenities F, commute F.
- Levy (rural): math 45% / reading 43% proficiency, ranked #54 of 73 in FL (top 74%) — families likely to look elsewhere, expect single-tenant / working-renter base with shorter leases; 62% free/reduced lunch — lower-income household profile, screen leases tightly.
- Zoned schools: Nature Coast Middle School (math 32% / reading 42%, grade F, #399 of 571 statewide, top 71%, 90 students, 82% FRL, charter) — zoned schools average 82% FRL vs 62% district-wide (20 pts higher); higher-poverty schools than district average — tighter screening recommended.
- Market conditions: 38 active listings in the ZIP; 199 units permitted in Levy County in 2024 (0 in 5+ unit buildings).
Forward outlook
- In year one you build about $1k of equity ($553 loan paydown + $909 appreciation (1.1% local appreciation)).
- Levy County population projected at -28% by 2050 — secular population decline; favor cash flow + early exit over multi-decade hold.
Negotiation context
- It's been on market 95 days — a 9% lower offer ($73k) is reasonable based on typical stale-listing flexibility.
- 2 sale attempts since 3y ago with the ask held roughly flat each time — persistent listings suggest the price (not the market) is what's stuck; bring a comps-based counter.
- Current owner paid $65k; 23% above their basis — modest negotiation headroom, anchor on the comps not their cost.
Risks & watch-outs
- Watch-outs: flood insurance adds $427/mo; built in 1947 — expect roof / HVAC / electrical / plumbing capex.
- Climate carrying-cost: in FEMA flood zone AE (mandatory federal flood insurance); severe wind risk, 99% chance of damaging wind over 30y; major wildfire risk; extreme-heat days projected 7→25/yr by 2055 (HVAC capex compounding) — expect insurance premiums to compound above CPI over the hold.
Questions for the listing agent
- What do current leases actually rent for vs. the listed asking? Can we see a recent rent roll and the last 12 months of T-12 income?
- It's been on market 95 days. Have you received any prior offers? Is the seller open to a 22% concession, seller financing, or rate buy-down credit?
- Built in 1947 — when were the roof, HVAC, electrical panel, plumbing, and water heater last replaced?
- What's the actual annual flood-insurance premium (NFIP or private), and is the property in a SFHA with mandatory coverage?
- Why hasn't it sold? Are there any deal-killer items the seller is aware of (foundation, flood, title, zoning, code violations)?
- Is there a deadline driving the sale (1031 exchange, divorce, estate, relocation)? That informs how much negotiation room exists.
- Schools are D-rated, which usually means shorter tenancies and higher turnover. Who's the typical renter profile here, and what's been the actual vacancy rate?
- What's the average days-on-market for RENTAL listings here right now (not sales)? A rising rental-DOM trend means longer vacancies and softer asking-rent achievability than the comps imply.
- What's the recent tenant-quality profile in this submarket — average credit score on applications, eviction rate, late-payment / NSF rate, and stable-employment percentage? A property-management company in the area should have these aggregated.
- How much new for-sale + rental construction is in the pipeline within 1–3 miles? Heavy new supply typically softens prices + rents 12–24 months out; constrained supply supports both.
Investment metrics
- 1% rule
- 1.43% ✓
- Cap rate
- 11.23%
- Cash-on-cash
- 17.63%
- DSCR
- 1.78
- GRM
- 5.8
CMA / ARV
- ARV (on-the-fly)
- $163,332
- Comps found
- 3
Show comp detail 3 sales within ~0.75 mi
| Address | Dist | Beds/Ba | Sqft | Sold | Price | $/sf | Match |
|---|---|---|---|---|---|---|---|
| 6206 Riverside Dr | 0.26mi | 2/1.5 (-1) | 1,072 (+2%) | 4mo | $160,000 | $149 | 74 |
| 11 62nd St | 0.20mi | 2/3.0 (-1) | 1,155 (+10%) | 3mo | $180,000 | $156 | 58 |
| 11615 N Caribee Pt | 0.48mi | 2/3.0 (-1) | 1,142 (+9%) | 9mo | $500,000 | $438 | 42 |
Match score weights: distance 35% · size 25% · config 20% · recency 20%. Top-matched comps best support the ARV.
Projected returns pro-forma
1.14% appreciation · 3.0% rent growth · sell at horizon
- IRR
- -3.4%
- Equity multiple
- 0.83×
- Total profit
- $-3,885
- Equity at exit
- $27,880
- IRR
- 2.0%
- Equity multiple
- 1.25×
- Total profit
- $5,501
- Equity at exit
- $37,494
Cash invested: $22,400 (down + closing). Projections, not guarantees.
Landlord ↔ Tenant lean methodology
- Overall (STATE)
- 87 Strongly Landlord-Friendly
- State Florida
- 87 Strongly Landlord-Friendly · R+3
- County
- — inherits STATE
- City
- — inherits STATE
ZIP-level market 34498
- Home prices YoY
- 0.4%
- Active inventory
- 38
- Price-to-rent
- 5.8×
Monthly cashflow live
- Estimated rent
- $1,146 medium interval (Pro) →
- Mortgage (P&I)
- −$420
- Tax from tax record
- −$124 /mo · $1,483/yr
- Insurance
- −$33
- Flood insurance flood zone
- −$427 /mo · $5,118/yr
- HOA
- −$0
- Vacancy / Maint / Mgmt
- −$241
- Net cashflow
- $-98
Break-even live
Sensitivity live
| Price | -10% $-52 | -5% $-75 | +0% $-98 | +5% $-120 | +10% $-143 |
|---|---|---|---|---|---|
| Rent | -10% $-188 | -5% $-143 | +0% $-98 | +5% $-52 | +10% $-7 |
| Rate | -1.0pp $-57 | -0.5pp $-77 | base $-98 | +0.5pp $-118 | +1.0pp $-139 |
UW: 25.0% down · 7.5% · 30yr · 1.5% tax · 5.0% vac · 8.0% maint · 8.0% mgmt
Financing live
Cash to close
- Down payment
- $20,000
- Closing costs
- $2,400
- Reserves months
- —
- Total cash needed
- —
Loan-product check · same deal, 3 products live
Conventional
25% down · 7.5% · 30yr
- Down + closing
- —
- Monthly P&I
- —
- Monthly cashflow
- —
- DSCR
- —
- Eligible?
- —
Personal DTI + credit; lowest rate.
DSCR
20% down · 8.5% · 30yr
- Down + closing
- —
- Monthly P&I
- —
- Monthly cashflow
- —
- DSCR
- —
- Eligible?
- —
No personal income docs; deal must DSCR.
Hard money
10% down · 12.0% · 12mo
- Down + closing
- —
- Monthly P&I
- —
- Monthly cashflow
- —
- DSCR
- —
- Eligible?
- —
Short-term bridge; refi at stabilization.
Listing history 23 events
-
2026-06-21days on market $80,000 Active 95 DOM
-
2026-06-18days on market $80,000 Active 92 DOM
-
2026-06-17days on market $80,000 Active 91 DOM
-
2026-06-16days on market $80,000 Active 90 DOM
-
2026-06-15days on market $80,000 Active 89 DOM
-
2026-06-14days on market $80,000 Active 87 DOM
-
2026-06-13days on market $80,000 Active 86 DOM
-
2026-06-10days on market $80,000 Active 84 DOM
-
2026-06-09days on market $80,000 Active 83 DOM
-
2026-06-08days on market $80,000 Active 82 DOM
-
2026-06-07days on market $80,000 Active 81 DOM
-
2026-06-05days on market $80,000 Active 78 DOM
-
2026-06-03days on market $80,000 Active 77 DOM
-
2026-06-02days on market $80,000 Active 76 DOM
-
2026-06-01days on market $80,000 Active 75 DOM
-
2026-05-31days on market $80,000 Active 74 DOM
-
2026-05-30days on market $80,000 Active 73 DOM
-
2026-03-18$80,000 Active
-
2023-12-22soldstatus $65,000
-
2023-12-20soldstatus $65,000 Closed 412-char remark
Show marketing remark (412 chars)
Investor's Dream in Yankeetown, Florida. This 3-bedroom, 1 bath home presents a unique opportunity for savvy investors. While it has experienced flooding from Hurricane Idalia, it offers a blank canvas for renovation and restoration. Situated in the charming town of Yankeetown, this property holds significant potential for those seeking to revitalize and capitalize on the resilient Florida real estate market.
-
2023-12-07status Pending 412-char remark
Show marketing remark (412 chars)
Investor's Dream in Yankeetown, Florida. This 3-bedroom, 1 bath home presents a unique opportunity for savvy investors. While it has experienced flooding from Hurricane Idalia, it offers a blank canvas for renovation and restoration. Situated in the charming town of Yankeetown, this property holds significant potential for those seeking to revitalize and capitalize on the resilient Florida real estate market.
-
2023-12-04$65,000 Active 412-char remark
Show marketing remark (412 chars)
Investor's Dream in Yankeetown, Florida. This 3-bedroom, 1 bath home presents a unique opportunity for savvy investors. While it has experienced flooding from Hurricane Idalia, it offers a blank canvas for renovation and restoration. Situated in the charming town of Yankeetown, this property holds significant potential for those seeking to revitalize and capitalize on the resilient Florida real estate market.
-
2021-11-18soldstatus $45,000
ⓘ Source: listings_history table (triggers on properties + properties_extension) + one-shot
backfill from property_details.listing_events for pre-trigger history.
Tax reassessment forecast FL · Resets to sale price
- Current annual tax
- $1,483 · $124/mo
- Projected year-2 tax
- $1,483 · $124/mo
- Expected delta
- $0/yr ($0/mo · 0.0%)
ⓘ Screening estimate from a state-policy table — verify with the county assessor before closing.
Climate risk First Street
- Flood 10/10 Extreme FEMA zone AE · 99% chance over 30 yrs
- Wildfire 6/10 Major
- Heat 9/10 Extreme 7 d/yr ≥109°F today · 25 d/yr by 30 yrs out
- Wind 9/10 Extreme 99% chance of damaging wind over 30 yrs
- Air quality 1/10 Low 0 unhealthy d/yr today · 0 by 30 yrs out
Nearby sold comps map
Loading sold comps map…
Walkable amenities ~0.75 mi
Loading nearby amenities…
Taxation est. · year 1
- Rental income
- $13,754
- − Mortgage interest
- −$4,481
- − Property taxes
- −$1,483
- − Insurance
- −$5,518
- − Repairs & maintenance
- −$1,100
- − Management
- −$1,100
- − Depreciation
- −$2,327
- Taxable loss
- −$2,256
- Est. tax savings @ 24.0%
- +$542
- After-tax cash flow
- $-628/yr
For passive investors: Depreciation is non-cash, so a rental often shows a tax loss while cash-flowing — sheltering income. Rental losses are passive: they offset passive income freely, and up to $25,000/yr can offset ordinary (W-2) income if you actively participate and your MAGI is under $100k (phasing out to $0 by $150k); unused losses carry forward. On sale, claimed depreciation is recaptured at up to 25%, and gains may owe capital-gains tax (a 1031 exchange can defer both). Figures are a year-1 estimate at your 24.0% rate — not tax advice; consult a CPA.
Schools (NCES district)
- District
- Levy
- NCES district ID
- 1201140
- Math proficiency
- 45% ▼ -8.00%
- Reading proficiency
- 43% ▼ -3.00%
- Median HH income
- $35,254
- Composite
- 36.42/100
- National rank
- #4673
- State rank
- #54 of 73 in FL
Livability — Yankeetown
- Score
- 56/100
- State rank
- #869
- US rank
- #22699
Category grades
Schools grade is shown separately in the Schools card above.
Census & demographics
- Census place
- Yankeetown, FL
- City population
- 666
- Population (ZIP)
- 666
Population outlook (Levy County) Hauer SSP2
- Today (2025)
- 36,536 people
- By 2030
- 34,498 · -5.6%
- By 2040
- 30,294 · -17.1%
- By 2050
- 26,368 · -27.8%
- By 2075
- 19,003 · -48.0%
- By 2100
- 13,169 · -64.0%
Race, ethnicity, and origin ACS 2023
- Neighborhood character
- Predominantly White (100%)
- Race & ethnicity
- White 100%
- Common ancestry
- Lithuanian 5% Portuguese 5% Slovak 5%
- Foreign-born
- 2%
- Languages at home
- 99% English-only · Russian/Polish/Slavic 1%
Political lean MEDSL · Levy
- 2024 margin
- Solid R (+50.3) · D 24.6% · R 74.8%
- 2008→2024 swing
- -23.3pp toward R · 2008: -26.9pp · 2024: -50.3pp
- All cycles
- 2024: R+50.3 2020: R+45.6 2016: R+44.8 2012: R+32.2 2008: R+26.9
Not yet ingested
- Civics
- —
Market trends
- HPI YoY
- ▲ 1.14%
- Current HPI
- 302.8387
- Rent YoY
- —
- Metro
- —
- State GDP YoY
- ▲ 3.28%
- F500 in state
- 36
Industry mix (Fortune 500 HQ in FL)
| Industry | F500 HQs | Revenue |
|---|---|---|
| Industrial Technology | 2 | $29B |
|
||
| Insurance | 2 | $17B |
|
||
| Retail | 1 | $60B |
|
||
| Technology Distribution | 1 | $58B |
|
||
| Homebuilding | 1 | $35B |
|
||
| Technology Manufacturing | 1 | $35B |
|
||
Price history
+77.8% since first listed6 events — show timeline
- 2026-03-18 Listed $80,000 RACC
- 2023-12-22 Sold (Public Records) $65,000 Public Records
- 2023-12-20 Sold (MLS) $65,000 RACC
- 2023-12-07 Pending — RACC
- 2023-12-04 Listed $65,000 RACC
- 2021-11-18 Sold (Public Records) $45,000 Public Records
Property tax history
+14.6%/yrLatest (2025): $1,483 · +6.8% YoY. Source: county tax records.
Cash-flow waterfall
monthlySold comps — $/sqft
last 12 mo · ≤1 miLoading sold comps…