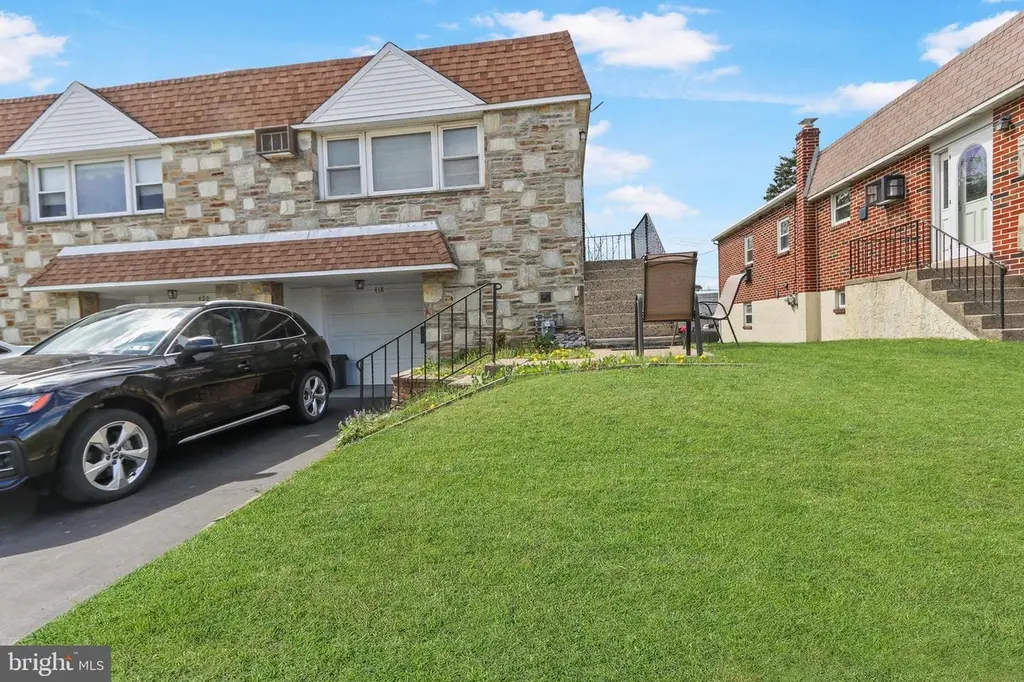
418 Jefferson St · Lansdale, PA
Flood risk 1/10 · Minimal
- FEMA flood zone
- X (unshaded)
- Chance of flooding over 30 yrs
- 0.0%
- Est. flood insurance / yr
- $473 – $860
Fire risk 1/10 · Minimal
- Est. fire insurance / yr
- $511 – $949
Heat risk 6/10 · Moderate
- Hot days now (above 99°F)
- 7 days/yr
- Hot days in 30 yrs
- 15 days/yr
Wind risk 6/10 · Moderate
- Chance of severe wind over 30 yrs
- 27.0%
Air-quality risk 4/10 · Minor
- Unhealthy air days now
- 5 days/yr
- Unhealthy air days in 30 yrs
- 8 days/yr
Risk factors via First Street. Map © Google.
Why this score? — see what drove the D- grade
The composite is a weighted blend of 9 inputs, each scored 0–100. Each bar is that input's sub-score; the figure is the points it added to the 100-point composite (weight × sub-score).
- ARV discount +15.0/15.0
- Schools +5.2/10.0
- Cash flow +4.9/30.0
- Livability +4.5/5.0
- Rent growth +3.3/5.0
- Condition / age +2.5/5.0
- 1% rule +0.2/10.0
- DSCR +0.0/10.0
- Appreciation +0.0/10.0
$425,000
🖨 Deal sheet 📄 Offer letter ✓ Due diligence
Listing remarks MLS
Great Borough Twin! This Wonderful Home Features An Awesome New Maple Kitchen w/ Built-in Table Nook, Harwood Flrs, Butler Pantry, Gas Stove, Lazy Susan & More! Upper Level Features Living Rm, dining Rm, and 3 bdrms ( 3rd bdrm used as exercise rm, can be converted back if Buyer's desire), Hall bath w/ wainscoating and tub. Main Level features 1 car garage, Laundry rm, Gas Hot Water Heater, 3 yr old Gas Furnace, Powder Rm, Play rm, and Family rm w/ Built-in Entertainment Center w/ Gas FP, Built-in shelves, and Hidden TV storage. Newer Atrium Dr to Fenced Yard w/ Tree house. All Vinyl Thermal Wdws Tilt-in, This Home is Well Cared for and a Great Value! 1 yr AHS Home Warranty Included!
Key facts
- Garage
- Built 1961
- Listed 50 days
Property features AI
Exterior
- Parking: Front-entry attached garage (1 car); Driveway space for 1 car; Two total parking spaces
- Utilities: Public water; Public sewer; 200+ amp electric service with circuit breakers; Natural gas available; Cable TV available; Phone service available; Natural gas hot water
- Home design: Semi-detached property; Estimated year built
- Construction: Brick and stone construction; Concrete perimeter foundation; Flat and pitched shingle roof
- Exterior features: Patio; Sidewalks; Street lights
Interior
- Kitchen: Eat-in kitchen
- Bedrooms: Three main-level bedrooms; One bedroom on lower level
- Flooring: Hardwood floors; Carpet; Terrazzo
- Bathrooms: One full bathroom; One half bathroom on a lower level
- Heating & cooling: Hot water baseboard heating (natural gas); Wall-mounted air conditioning (electric)
- Interior features: Ceiling fans; Built-in shelving; Formal dining room; Eat-in kitchen; Entry-level bedroom
Neighborhood map
What this means for you Summary
Snapshot
- This is a 3-bed/1.5-bath single-family listed at $425k.
Deal economics
- At list price, monthly cash flow is $-1k ($-12k/yr) — negative.
- To cash-flow at today's rent, offer at most $244k (42.6% below list).
- To meet the 1% rule (rent ≥ 1% of price), the offer needs to be $223k (47.5% below list).
- Recommended offer: $223k (47.5% below list) — sets the bar for 1% rule.
Location & tenants
- Location reads 89/100 on livability (#31 in PA, #170 nationally) — a professional / high-income tenant draw. Strengths: crime A+, commute A+, housing A+.
- North Penn SD (suburban): math 48% / reading 67% proficiency, ranked #76 of 539 in PA (top 14%) — acceptable for families but not a draw, mixed tenant base, ~2y average lease; only 20% free/reduced lunch — higher-income household profile.
- Market conditions: Rents rising (+3.1%/yr); 186 active listings in the ZIP; 20 comparable units currently listed for rent nearby; rentals leasing fast (median 2d on market — plan ~1-2 weeks tenant-placement turnaround); solid renter incomes; 1,936 units permitted in Montgomery County in 2024 (530 in 5+ unit buildings).
Forward outlook
- Local home prices are declining (-3.0%/yr); year-one equity from $3k of loan paydown is wiped out by about $13k of value loss. Plan a longer hold.
- Montgomery County population projected at +5% by 2050 — modest demand growth; plan on rents tracking national, not racing it.
Negotiation context
- It's been on market 50 days — a 3% lower offer ($412k) is reasonable based on typical stale-listing flexibility.
- 5 sale attempts since 31y ago with the ask held roughly flat each time — persistent listings suggest the price (not the market) is what's stuck; bring a comps-based counter.
- Current owner paid $174k; list at $425k implies a 144% gain — meaningful room to come down on a strong offer.
Risks & watch-outs
- Climate carrying-cost: major wind risk, 27% chance of damaging wind over 30y; extreme-heat days projected 7→15/yr by 2055 (HVAC capex compounding) — expect insurance premiums to compound above CPI over the hold.
Questions for the listing agent
- What do current leases actually rent for vs. the listed asking? Can we see a recent rent roll and the last 12 months of T-12 income?
- It's been on market 50 days. Have you received any prior offers? Is the seller open to a 48% concession, seller financing, or rate buy-down credit?
- Built in 1961 — when were the roof, HVAC, electrical panel, plumbing, and water heater last replaced?
- Is there a deadline driving the sale (1031 exchange, divorce, estate, relocation)? That informs how much negotiation room exists.
- Schools are A-rated — typically a magnet for longer-tenancy family renters. What's the average tenant stay here, and is there a school-zone premium baked into asking?
- The area grade is low — what's the realistic commute time and amenity access for the typical tenant pool here? Any planned neighborhood developments (good or bad) we should know about?
- What's the average days-on-market for RENTAL listings here right now (not sales)? A rising rental-DOM trend means longer vacancies and softer asking-rent achievability than the comps imply.
- What's the recent tenant-quality profile in this submarket — average credit score on applications, eviction rate, late-payment / NSF rate, and stable-employment percentage? A property-management company in the area should have these aggregated.
- How much new for-sale + rental construction is in the pipeline within 1–3 miles? Heavy new supply typically softens prices + rents 12–24 months out; constrained supply supports both.
Investment metrics
- 1% rule
- 0.52% ✗
- Cap rate
- 3.40%
- Cash-on-cash
- -10.33%
- DSCR
- 0.54
- GRM
- 15.9
CMA / ARV
- ARV (median comp)
- $567,488
- List price
- $425,000
- Delta
- -25.11%
- Verdict
- UNDERPRICED
- Comps
- 20 within 1.0 mi
Show comp detail 5 sales within ~0.75 mi
| Address | Dist | Beds/Ba | Sqft | Sold | Price | $/sf | Match |
|---|---|---|---|---|---|---|---|
| 634 Susquehanna Ave | 0.29mi | 2/1.0 (-1) | 997 (-0%) | 15mo | $350,000 | $351 | 67 |
| 638 Susquehanna Ave | 0.29mi | 2/1.0 (-1) | 965 (-4%) | 13mo | $360,000 | $373 | 62 |
| 499 Wade Ave | 0.70mi | 3/1.0 | 1,000 (0%) | 12mo | $370,000 | $370 | 56 |
| 307 Perkiomen Ave | 0.30mi | 3/1.0 | 1,142 (+14%) | 7mo | $412,900 | $362 | 55 |
| 714 Columbia Ave | 0.69mi | 2/1.0 (-1) | 1,080 (+8%) | 16mo | $430,000 | $398 | 34 |
Match score weights: distance 35% · size 25% · config 20% · recency 20%. Top-matched comps best support the ARV.
Projected returns pro-forma
-3.0% appreciation · 3.08% rent growth · sell at horizon
- IRR
- -34.9%
- Equity multiple
- -0.13×
- Total profit
- $-134,010
- Equity at exit
- $63,369
- IRR
- -45.4%
- Equity multiple
- -0.68×
- Total profit
- $-200,232
- Equity at exit
- $36,746
Cash invested: $119,000 (down + closing). Projections, not guarantees.
Landlord ↔ Tenant lean methodology
- Overall (STATE)
- 62 Landlord-Friendly
- State Pennsylvania
- 62 Landlord-Friendly · EVEN
- County
- — inherits STATE
- City
- — inherits STATE
ZIP-level market 19446
- Rents YoY
- 3.1%
- Active inventory
- 186
- Price-to-rent
- 15.9×
Monthly cashflow live
- Estimated rent
- $2,229 high interval (Pro) →
- Mortgage (P&I)
- −$2,229
- Tax from tax record
- −$380 /mo · $4,561/yr
- Insurance
- −$177
- HOA
- −$0
- Vacancy / Maint / Mgmt
- −$468
- Net cashflow
- $-1,025
Break-even live
UW: 25.0% down · 7.5% · 30yr · 1.5% tax · 5.0% vac · 8.0% maint · 8.0% mgmt
Financing live
Cash to close
- Down payment
- $106,250
- Closing costs
- $12,750
- Reserves months
- —
- Total cash needed
- —
Loan-product check · same deal, 3 products live
Conventional
25% down · 7.5% · 30yr
- Down + closing
- —
- Monthly P&I
- —
- Monthly cashflow
- —
- DSCR
- —
- Eligible?
- —
Personal DTI + credit; lowest rate.
DSCR
20% down · 8.5% · 30yr
- Down + closing
- —
- Monthly P&I
- —
- Monthly cashflow
- —
- DSCR
- —
- Eligible?
- —
No personal income docs; deal must DSCR.
Hard money
10% down · 12.0% · 12mo
- Down + closing
- —
- Monthly P&I
- —
- Monthly cashflow
- —
- DSCR
- —
- Eligible?
- —
Short-term bridge; refi at stabilization.
Rent comps 20 comps
| Address | Beds | Baths | Sqft | Rent | $/sqft | DOM | Units | Dist |
|---|---|---|---|---|---|---|---|---|
| 117 S Broad St Lansdale, PA | 2.0 | 1.0–2.0 | 811 | $2,395 | $2.95 | 1d | 14 | 0.28mi |
| 333 S Line St Lansdale, PA | 2.0 | 1.0 | 968 | $1,900 | $1.96 | 21d | 1 | 0.31mi |
| 319 Whites Rd Lansdale, PA | 2.0 | 1.0 | 875 | $1,815 | $2.07 | 1d | 3 | 0.35mi |
| 200 S Line St Lansdale, PA | 1.0–2.0 | 1.0–1.5 | 1077 | $2,299 | $2.13 | 19d | 6 | 0.36mi |
| 359 Whites Rd Unit C Lansdale, PA | 2.0 | 1.5 | 864 | $2,000 | $2.31 | 21d | 1 | 0.40mi |
| 38 Jenkins Ave Lansdale, PA | 1.0–2.0 | 1.0 | 713 | $1,681 | $2.36 | 1d | 2 | 0.41mi |
| 100 Reading Cir Lansdale, PA | 1.0–2.0 | 1.0–2.0 | 1042 | $2,979 | $2.86 | 1d | 28 | 0.59mi |
| 325 Madison St Lansdale, PA | 2.0 | 1.0–2.0 | 886 | $2,320 | $2.62 | 1d | 8 | 0.73mi |
| 501 N Cannon Ave Unit B105 Lansdale, PA | 2.0 | 1.0 | 850 | $1,995 | $2.35 | 1d | 1 | 0.97mi |
| 501 N Cannon Ave Unit A203 Lansdale, PA | 2.0 | 1.0 | 850 | $1,895 | $2.23 | 1d | 1 | 0.98mi |
| 108 Allison Ct Lansdale, PA | 2.0 | 1.5 | 1232 | $2,500 | $2.03 | 2d | 1 | 1.02mi |
| 31 W End Dr Lansdale, PA | 3.0 | 2.0 | 1380 | $3,100 | $2.25 | 16d | 1 | 1.09mi |
| 826 Shaw Ave Lansdale, PA | 3.0 | 1.0 | 1170 | $2,500 | $2.14 | 43d | 1 | 1.10mi |
| 757 E Main St Lansdale, PA | 1.0–2.0 | 1.0 | 759 | $1,620 | $2.13 | 1d | 31 | 1.12mi |
| 7 Belfast Dr North Wales, PA | 2.0 | 1.0 | 934 | $1,999 | $2.14 | 1d | 1 | 1.17mi |
| 1 Marlbrook Ln Lansdale, PA | 1.0–3.0 | 1.0–2.0 | 1251 | $2,639 | $2.11 | 1d | 19 | 1.18mi |
| 7 Wexford Dr North Wales, PA | 2.0 | 1.0 | 990 | $1,900 | $1.92 | 3d | 1 | 1.23mi |
| 1158 Welsh Rd Lansdale, PA | 1.0–2.0 | 1.0–1.5 | 880 | $1,880 | $2.14 | 1d | 19 | 1.27mi |
| 1408 N Wales Rd North Wales, PA | 3.0 | 1.0 | 1033 | $2,300 | $2.23 | 1d | 1 | 1.35mi |
| 100 Snyder Rd Lansdale, PA | 1.0–2.0 | 1.0–1.5 | 803 | $2,215 | $2.76 | 1d | 18 | 1.36mi |
Listing history 33 events
-
2026-06-18days on market $425,000 Active 50 DOM
-
2026-06-17days on market $425,000 Active 49 DOM
-
2026-06-16days on market $425,000 Active 48 DOM
-
2026-06-15days on market $425,000 Active 47 DOM
-
2026-06-13days on market $425,000 Active 45 DOM
-
2026-06-13days on market $425,000 Active 44 DOM
-
2026-06-09days on market $425,000 Active 41 DOM
-
2026-06-08days on market $425,000 Active 40 DOM
-
2026-06-07days on market $425,000 Active 39 DOM
-
2026-06-03days on market $425,000 Active 35 DOM
-
2026-06-02days on market $425,000 Active 34 DOM
-
2026-06-01days on market $425,000 Active 33 DOM
-
2026-05-31days on market $425,000 Active 32 DOM
-
2026-04-29$425,000 Active 1180-char remark
-
2025-08-31historical
-
2025-07-19price $350,000
-
2025-07-08price $369,900
-
2025-06-27price $379,900
-
2025-06-23price $391,500
-
2025-06-20price $399,800
-
2025-06-19price $400,000
-
2025-06-16$415,000 Active
-
2005-01-20soldstatus $174,000
-
2005-01-14soldstatus $174,000
Show marketing remark (698 chars)
Great Borough Twin! This Wonderful Home Features An Awesome New Maple Kitchen w/ Built-in Table Nook, Harwood Flrs, Butler Pantry, Gas Stove, Lazy Susan & More! Upper Level Features Living Rm, dining Rm, and 3 bdrms ( 3rd bdrm used as exercise rm, can be converted back if Buyer's desire), Hall bath w/ wainscoating and tub. Main Level features 1 car garage, Laundry rm, Gas Hot Water Heater, 3 yr old Gas Furnace, Powder Rm, Play rm, and Family rm w/ Built-in Entertainment Center w/ Gas FP, Built-in shelves, and Hidden TV storage. Newer Atrium Dr to Fenced Yard w/ Tree house. All Vinyl Thermal Wdws Tilt-in, This Home is Well Cared for and a Great Value! 1 yr AHS Home Warranty Included!
-
2004-11-30historical
Show marketing remark (698 chars)
Great Borough Twin! This Wonderful Home Features An Awesome New Maple Kitchen w/ Built-in Table Nook, Harwood Flrs, Butler Pantry, Gas Stove, Lazy Susan & More! Upper Level Features Living Rm, dining Rm, and 3 bdrms ( 3rd bdrm used as exercise rm, can be converted back if Buyer's desire), Hall bath w/ wainscoating and tub. Main Level features 1 car garage, Laundry rm, Gas Hot Water Heater, 3 yr old Gas Furnace, Powder Rm, Play rm, and Family rm w/ Built-in Entertainment Center w/ Gas FP, Built-in shelves, and Hidden TV storage. Newer Atrium Dr to Fenced Yard w/ Tree house. All Vinyl Thermal Wdws Tilt-in, This Home is Well Cared for and a Great Value! 1 yr AHS Home Warranty Included!
-
2004-10-26$174,000
Show marketing remark (698 chars)
Great Borough Twin! This Wonderful Home Features An Awesome New Maple Kitchen w/ Built-in Table Nook, Harwood Flrs, Butler Pantry, Gas Stove, Lazy Susan & More! Upper Level Features Living Rm, dining Rm, and 3 bdrms ( 3rd bdrm used as exercise rm, can be converted back if Buyer's desire), Hall bath w/ wainscoating and tub. Main Level features 1 car garage, Laundry rm, Gas Hot Water Heater, 3 yr old Gas Furnace, Powder Rm, Play rm, and Family rm w/ Built-in Entertainment Center w/ Gas FP, Built-in shelves, and Hidden TV storage. Newer Atrium Dr to Fenced Yard w/ Tree house. All Vinyl Thermal Wdws Tilt-in, This Home is Well Cared for and a Great Value! 1 yr AHS Home Warranty Included!
-
1996-04-30soldstatus $116,807
-
1996-04-26soldstatus $116,807
-
1996-03-16historical
-
1996-01-16$116,807
-
1996-01-10historical
-
1995-06-01$117,950
-
1990-11-21soldstatus $119,000
ⓘ Source: listings_history table (triggers on properties + properties_extension) + one-shot
backfill from property_details.listing_events for pre-trigger history.
Tax reassessment forecast PA · Partial reset (capped growth)
- Current annual tax
- $4,561 · $380/mo
- Projected year-2 tax
- $5,638 · $470/mo
- Expected delta
- +$1,077/yr (+$90/mo · 23.6%)
ⓘ Screening estimate from a state-policy table — verify with the county assessor before closing.
Climate risk First Street
- Flood 1/10 Low FEMA zone X (unshaded) · 0% chance over 30 yrs
- Wildfire 1/10 Low
- Heat 6/10 Major 7 d/yr ≥99°F today · 15 d/yr by 30 yrs out
- Wind 6/10 Major 27% chance of damaging wind over 30 yrs
- Air quality 4/10 Moderate 5 unhealthy d/yr today · 8 by 30 yrs out
Nearby sold comps map
Loading sold comps map…
Walkable amenities ~0.75 mi
Loading nearby amenities…
Taxation est. · year 1
- Rental income
- $26,752
- − Mortgage interest
- −$23,807
- − Property taxes
- −$4,561
- − Insurance
- −$2,125
- − Repairs & maintenance
- −$2,140
- − Management
- −$2,140
- − Depreciation
- −$12,364
- Taxable loss
- −$20,384
- Est. tax savings @ 24.0%
- +$4,892
- After-tax cash flow
- $-7,404/yr
For passive investors: Depreciation is non-cash, so a rental often shows a tax loss while cash-flowing — sheltering income. Rental losses are passive: they offset passive income freely, and up to $25,000/yr can offset ordinary (W-2) income if you actively participate and your MAGI is under $100k (phasing out to $0 by $150k); unused losses carry forward. On sale, claimed depreciation is recaptured at up to 25%, and gains may owe capital-gains tax (a 1031 exchange can defer both). Figures are a year-1 estimate at your 24.0% rate — not tax advice; consult a CPA.
Schools (NCES district)
- District
- North Penn SD
- NCES district ID
- 4217280
- Math proficiency
- 48% ▼ -10.00%
- Reading proficiency
- 67% ▼ -9.00%
- Median HH income
- $76,866
- Composite
- 51.5/100
- National rank
- #1722
- State rank
- #76 of 539 in PA
Livability — Lansdale
- Score
- 89/100
- State rank
- #31
- US rank
- #170
Category grades
Schools grade is shown separately in the Schools card above.
Census & demographics
- Census place
- Lansdale, PA
- County
- Montgomery County · 712,331 people
- City population
- 61,848
- Metro
- Philadelphia-Camden-Wilmington, PA-NJ-DE-MD
- Population (ZIP)
- 61,848
- Household income
- $106,310
- Rent vs Own
- Severe rent burden
- 1930.0
Population outlook (Montgomery County) Hauer SSP2
- Today (2025)
- 856,074 people
- By 2030
- 870,887 · +1.7%
- By 2040
- 891,195 · +4.1%
- By 2050
- 896,417 · +4.7%
- By 2075
- 903,212 · +5.5%
- By 2100
- 843,240 · -1.5%
Race, ethnicity, and origin ACS 2023
- Neighborhood character
- Predominantly White (71%)
- Race & ethnicity
- White 71% Asian 14% Black 7% Two or more races 4% Hispanic / Latino 4%
- Common ancestry
- Romanian 5% Slovak 2% Scotch-Irish 1%
- Foreign-born
- 16% · Canada, South Korea, China
- Languages at home
- 81% English-only · Other Indo-European 6% Spanish 2% Korean 2%
Political lean MEDSL · Montgomery
- 2024 margin
- Strong D (+22.8) · D 60.9% · R 38.1% · Other 1.1%
- 2008→2024 swing
- +2.0pp toward D · 2008: 20.8pp · 2024: 22.8pp
- All cycles
- 2024: D+22.8 2020: D+26.3 2016: D+21.1 2012: D+14.3 2008: D+20.8
Not yet ingested
- Civics
- —
Market trends
- HPI YoY
- ▼ -340.90%
- Current HPI
- 279.3557
- Rent YoY
- ▲ 3.08%
- Metro
- Philadelphia-Camden-Wilmington, PA-NJ-DE-MD
- State GDP YoY
- ▲ 1.68%
- F500 in state
- 34
Industry mix (Fortune 500 HQ in PA)
| Industry | F500 HQs | Revenue |
|---|---|---|
| Healthcare | 2 | $309B |
|
||
| Insurance | 2 | $27B |
|
||
| Telecommunications / Media | 1 | $124B |
|
||
| Industrial Distribution | 1 | $22B |
|
||
| Financial Services | 1 | $20B |
|
||
| Chemicals / Materials | 1 | $18B |
|
||
Price history
+257.1% since first listed20 events — show timeline
- 2026-04-29 Listed $425,000 BRIGHT MLS
- 2025-08-31 Listing Removed — BRIGHT MLS
- 2025-07-19 Price Changed $350,000 BRIGHT MLS
- 2025-07-08 Price Changed $369,900 BRIGHT MLS
- 2025-06-27 Price Changed $379,900 BRIGHT MLS
- 2025-06-23 Price Changed $391,500 BRIGHT MLS
- 2025-06-20 Price Changed $399,800 BRIGHT MLS
- 2025-06-19 Price Changed $400,000 BRIGHT MLS
- 2025-06-16 Listed $415,000 BRIGHT MLS
- 2005-01-20 Sold (Public Records) $174,000 Public Records
- 2005-01-14 Sold (MLS) $174,000 BRIGHT MLS
- 2004-11-30 Listing Removed — BRIGHT MLS
- 2004-10-26 Listed $174,000 BRIGHT MLS
- 1996-04-30 Sold (Public Records) $116,807 Public Records
- 1996-04-26 Sold (MLS) $116,807 BRIGHT MLS
- 1996-03-16 Listing Removed — BRIGHT MLS
- 1996-01-16 Listed $116,807 BRIGHT MLS
- 1996-01-10 Listing Removed — BRIGHT MLS
- 1995-06-01 Listed $117,950 BRIGHT MLS
- 1990-11-21 Sold (Public Records) $119,000 Public Records
Property tax history
+3.5%/yrLatest (2026): $4,561 · +4.6% YoY. Source: county tax records.
Cash-flow waterfall
monthlySold comps — $/sqft
last 12 mo · ≤1 miLoading sold comps…