 Duplex
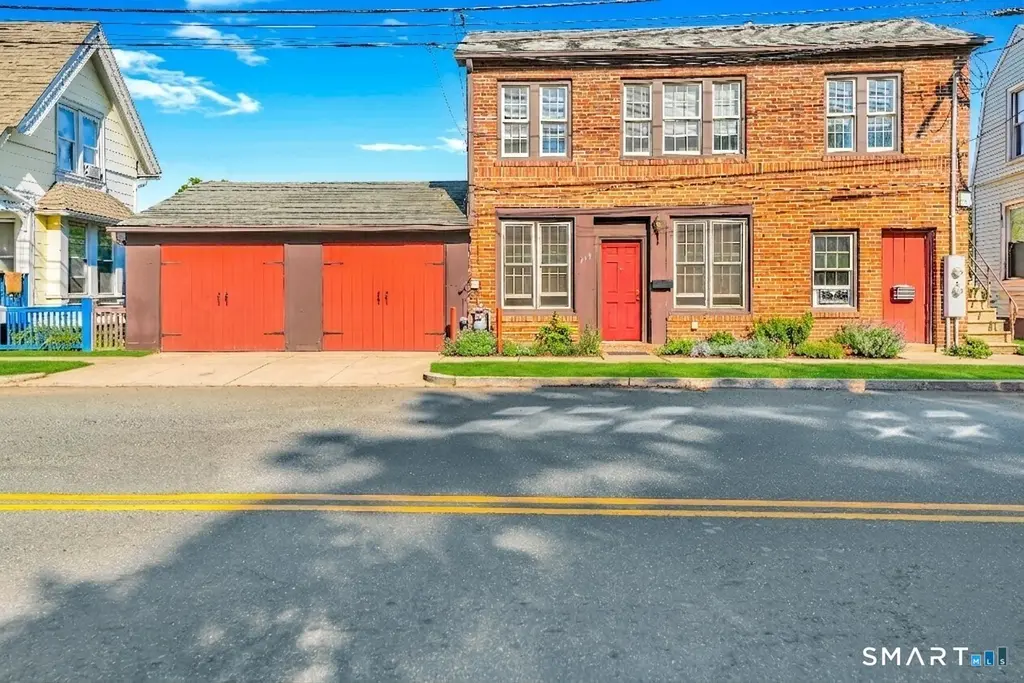
393 Colony St · Meriden, CT
Flood risk 9/10 · Severe
- FEMA flood zone
- X (unshaded)
- Chance of flooding over 30 yrs
- 0.99%
- Est. flood insurance / yr
- $473 – $860
Fire risk 1/10 · Minimal
- Est. fire insurance / yr
- $829 – $1,539
Heat risk 6/10 · Moderate
- Hot days now (above 98°F)
- 7 days/yr
- Hot days in 30 yrs
- 17 days/yr
Wind risk 6/10 · Moderate
- Chance of severe wind over 30 yrs
- 27.0%
Air-quality risk 4/10 · Minor
- Unhealthy air days now
- 3 days/yr
- Unhealthy air days in 30 yrs
- 5 days/yr
Risk factors via First Street. Map © Google.
Why this score? — see what drove the B grade
The composite is a weighted blend of 9 inputs, each scored 0–100. Each bar is that input's sub-score; the figure is the points it added to the 100-point composite (weight × sub-score).
- Cash flow +26.7/30.0
- ARV discount +15.0/15.0
- DSCR +9.2/10.0
- 1% rule +6.7/10.0
- Livability +4.2/5.0
- Schools +3.0/10.0
- Rent growth +2.9/5.0
- Condition / age +2.5/5.0
- Appreciation +0.0/10.0
$259,000
🖨 Deal sheet 📄 Offer letter ✓ Due diligence
Multi-family units
County records classify this as Multi-Family (2-4 Unit). Listing-text estimate: 2 units. confirmed
Listing remarks MLS
This home could ge purchased as package with 397 colony street mls# n274095 low price and low taxes make this home a good live-in or investment property. Exterior maintance cost low
Key facts
- Dark countertops
- Pedestal sink
- Built 1900
Tags
Property features AI
Exterior
- Parking: Attached garage; 2-car garage
- Utilities: Public water connected; Public sewer connected
- Home design: Multi-family (2-family) property
- Construction: Frame construction; Concrete foundation; Asphalt shingle roof; Built as a multi-family dwelling
- Exterior features: Brick siding; City views; Level lot
Interior
- Bedrooms: 4 bedrooms total
- Bathrooms: 2 full bathrooms
- Heating & cooling: Baseboard and steam heating; Heat fuel: electric and natural gas; Hot water: natural gas, electric, and other
- Interior features: 8 total rooms; Full, unfinished basement; Multi-family property with 2 units
Neighborhood map
What this means for you Summary
Snapshot
- This is a 2 × 2-bed/1.0-bath units multifamily listed at $259k.
Deal economics
- At list price, monthly cash flow is $646 ($8k/yr) — positive. Per door: $323/mo.
- The deal already cash-flows at list — no discount required.
- Meets the 1% rule at list price ($3k rent vs $259k).
- Cap rate 9.5% vs local median 4.2% in Meriden — top-decile yield for the area; either an underpriced asset or a hidden risk that comps aren't pricing in. Stress-test before assuming the spread holds.
Location & tenants
- Location reads 85/100 on livability (#4 in CT, #505 nationally) — a professional / high-income tenant draw. Strengths: amenities A+, housing A+, health & safety A+.
- Meriden School District (suburban): math 27% / reading 41% proficiency, ranked #116 of 153 in CT (top 76%) — families likely to look elsewhere, expect single-tenant / working-renter base with shorter leases; 61% free/reduced lunch — lower-income household profile, screen leases tightly.
- Zoned schools: John Barry School (math 26% / reading 37%, grade F, #376 of 553 statewide, top 68%, 472 students, 87% FRL); Orville H. Platt High School (math 12% / reading 32%, grade F, #156 of 194 statewide, top 82%, 1,108 students, 80% FRL) — zoned schools average 84% FRL vs 61% district-wide (23 pts higher); higher-poverty schools than district average — tighter screening recommended.
- Market conditions: Rents rising (+1.6%/yr); 98 active listings in the ZIP; 35 comparable units currently listed for rent nearby; rentals at typical pace (median 24d on market — plan ~3-4 weeks tenant-placement turnaround); 40% of comp listings sitting > 30 days — soft ceiling on asking rent; 1,059 units permitted in South Central Connecticut Planning Region in 2024 (779 in 5+ unit buildings).
- At $3,034/mo this rent would consume 51% of the median local household income ($71k/yr) (locally 1516% of renters already pay >50% of income on rent) — very limited rent-growth headroom before tenants either downsize or default.
Forward outlook
- Local home prices are declining (-3.0%/yr); year-one equity from $2k of loan paydown is wiped out by about $8k of value loss. Plan a longer hold.
Negotiation context
- Only 13 days on market — expect competitive offers; lowballing is unlikely to land.
- 3 sale attempts since 18y ago with the ask held roughly flat each time — persistent listings suggest the price (not the market) is what's stuck; bring a comps-based counter.
- Current owner paid $79k; list at $259k implies a 228% gain — meaningful room to come down on a strong offer.
Risks & watch-outs
- Watch-outs: flood insurance adds $56/mo; built in 1900 — expect roof / HVAC / electrical / plumbing capex.
- Climate carrying-cost: severe flood risk; major wind risk, 27% chance of damaging wind over 30y; extreme-heat days projected 7→17/yr by 2055 (HVAC capex compounding) — expect insurance premiums to compound above CPI over the hold.
Questions for the listing agent
- Can we see the unit-by-unit rent roll, current vacancy, and any below-market leases? What's the average tenancy length?
- What capital expenditures (roof, boiler, parking lot, exteriors) have been made in the last 5 years, and what's planned in the next 2?
- Built in 1900 — when were the roof, HVAC, electrical panel, plumbing, and water heater last replaced?
- What's the actual annual flood-insurance premium (NFIP or private), and is the property in a SFHA with mandatory coverage?
- Is there a deadline driving the sale (1031 exchange, divorce, estate, relocation)? That informs how much negotiation room exists.
- What's the average days-on-market for RENTAL listings here right now (not sales)? A rising rental-DOM trend means longer vacancies and softer asking-rent achievability than the comps imply.
- What's the recent tenant-quality profile in this submarket — average credit score on applications, eviction rate, late-payment / NSF rate, and stable-employment percentage? A property-management company in the area should have these aggregated.
- How much new apartment / multifamily construction is in the pipeline within 1–3 miles? Heavy new supply (>2% of stock underway) typically softens rents 12–24 months out; light construction supports rent growth.
Investment metrics
- 1% rule
- 1.17% ✓
- Cap rate
- 9.54%
- Cash-on-cash
- 11.61%
- DSCR
- 1.52
- GRM
- 7.1
CMA / ARV
- ARV (on-the-fly)
- $329,360
- Comps found
- 4
Show comp detail 4 sales within ~0.75 mi
| Address | Dist | Beds/Ba | Sqft | Sold | Price | $/sf | Match |
|---|---|---|---|---|---|---|---|
| 97 Woodland St | 0.42mi | 2/2.0 (-1) | 1,350 (-6%) | 1mo | $310,000 | $230 | 66 |
| 124 Miller St | 0.63mi | 4/2.0 (+1) | 1,418 (-1%) | 13mo | $250,000 | $176 | 54 |
| 100 Woodland St | 0.44mi | 4/2.0 (+1) | 1,352 (-6%) | 17mo | $267,000 | $197 | 51 |
| 109 Hicks St | 0.48mi | 4/3.0 (+1) | 1,630 (+14%) | 7mo | $435,000 | $267 | 40 |
Match score weights: distance 35% · size 25% · config 20% · recency 20%. Top-matched comps best support the ARV.
Projected returns pro-forma
-3.0% appreciation · 1.65% rent growth · sell at horizon
- IRR
- -1.8%
- Equity multiple
- 0.93×
- Total profit
- $-4,854
- Equity at exit
- $38,618
- IRR
- 6.4%
- Equity multiple
- 1.45×
- Total profit
- $32,623
- Equity at exit
- $22,394
Cash invested: $72,520 (down + closing). Projections, not guarantees.
Landlord ↔ Tenant lean methodology
- Overall (STATE)
- 27 Tenant-Leaning
- State Connecticut
- 27 Tenant-Leaning · D+7
- County
- — inherits STATE
- City
- — inherits STATE
ZIP-level market 06450
- Rents YoY
- 1.6%
- Active inventory
- 98
- Price-to-rent
- 14.2×
Monthly cashflow live
- Estimated rent
- $3,034 high interval (Pro) →
- Mortgage (P&I)
- −$1,358
- Tax from tax record
- −$229 /mo · $2,747/yr
- Insurance
- −$108
- Flood insurance flood zone
- −$56 /mo · $666/yr
- HOA
- −$0
- Vacancy / Maint / Mgmt
- −$637
- Net cashflow
- $646
Break-even live
2-unit breakdown (identical units grouped — click to expand)
| Units | Beds | Baths | Est. rent |
|---|---|---|---|
| 2× units | 2 | 1 | $3,034 |
| #1 | 2 | 1 | $1,517 |
| #2 | 2 | 1 | $1,517 |
| Total (2 units) | $3,034 | ||
UW: 25.0% down · 7.5% · 30yr · 1.5% tax · 5.0% vac · 8.0% maint · 8.0% mgmt
Financing live
Cash to close
- Down payment
- $64,750
- Closing costs
- $7,770
- Reserves months
- —
- Total cash needed
- —
Loan-product check · same deal, 3 products live
Conventional
25% down · 7.5% · 30yr
- Down + closing
- —
- Monthly P&I
- —
- Monthly cashflow
- —
- DSCR
- —
- Eligible?
- —
Personal DTI + credit; lowest rate.
DSCR
20% down · 8.5% · 30yr
- Down + closing
- —
- Monthly P&I
- —
- Monthly cashflow
- —
- DSCR
- —
- Eligible?
- —
No personal income docs; deal must DSCR.
Hard money
10% down · 12.0% · 12mo
- Down + closing
- —
- Monthly P&I
- —
- Monthly cashflow
- —
- DSCR
- —
- Eligible?
- —
Short-term bridge; refi at stabilization.
Rent comps 35 comps
| Address | Beds | Baths | Sqft | Rent | $/sqft | DOM | Units | Dist |
|---|---|---|---|---|---|---|---|---|
| 17 Sherman Ave Unit 3rd Meriden, CT | 3.0 | 1.0 | 1088 | $2,300 | $2.11 | 43d | 1 | 0.09mi |
| 96 Franklin St Unit 2nd Floor Meriden, CT | 3.0 | 1.0 | 900 | $1,800 | $2.00 | 43d | 1 | 0.11mi |
| 75 Wilcox Ave Meriden, CT | 4.0 | 1.0 | 1763 | $2,350 | $1.33 | 43d | 1 | 0.11mi |
| 120 Wilcox Ave Unit 2 Meriden, CT | 3.0 | 1.0 | 1250 | $2,000 | $1.60 | 11d | 1 | 0.17mi |
| 120 Wilcox Ave #3 Meriden, CT | 2.0 | 1.0 | 1200 | $1,750 | $1.46 | 19d | 1 | 0.18mi |
| 289 Center St Unit 2893 Meriden, CT | 2.0 | 1.5 | 950 | $1,600 | $1.68 | 23d | 1 | 0.35mi |
| 51 Park St Meriden, CT | 1.0–3.0 | 1.0–1.5 | 800 | $2,260 | $2.83 | 2d | 6 | 0.37mi |
| 19 Cambridge St Unit 2 Meriden, CT | 3.0 | 1.0 | 1100 | $2,100 | $1.91 | 43d | 1 | 0.45mi |
| 250 Kensington Ave Meriden, CT | 2.0 | 1.0 | 1200 | $1,885 | $1.57 | 1d | 1 | 0.50mi |
| 1068 Broad St Unit 1 Meriden, CT | 3.0 | 1.0 | 1200 | $2,000 | $1.67 | 43d | 1 | 0.57mi |
| 300 Britannia St Meriden, CT | 1.0–4.0 | 1.0–2.0 | 980 | $2,326 | $2.37 | 2d | 8 | 0.58mi |
| 65 Twiss St Meriden, CT | 2.0 | 1.0 | 1566 | $1,300 | $0.83 | 14d | 1 | 0.61mi |
| 49 Springdale Ave Meriden, CT | 4.0 | 1.0 | 1000 | $2,200 | $2.20 | 43d | 1 | 0.70mi |
| 109 Blackstone St Unit 109 Meriden, CT | 2.0 | 1.5 | 1056 | $2,100 | $1.99 | 23d | 1 | 0.72mi |
| 39 N Spring St Unit 2 Meriden, CT | 3.0 | 1.0 | 1650 | $2,400 | $1.45 | 43d | 1 | 0.74mi |
| 1 Barristers Ct Unit 2nd Flr Meriden, CT | 3.0 | 1.0 | 1512 | $2,200 | $1.46 | 23d | 1 | 0.75mi |
| 19 Hobart St #1 Meriden, CT | 3.0 | 2.0 | 1105 | $2,200 | $1.99 | 43d | 1 | 0.77mi |
| 145 Harbor Pond Dr Meriden, CT | 2.0 | 2.5 | 1350 | $2,400 | $1.78 | 2d | 2 | 0.80mi |
| 116 Springdale Ave Unit 1st Flr Meriden, CT | 2.0 | 1.0 | 1646 | $1,600 | $0.97 | 43d | 1 | 0.80mi |
| 44 Willow St #44 Meriden, CT | 2.0 | 1.0 | 1024 | $1,750 | $1.71 | 21d | 1 | 0.84mi |
| 153 Sams Rd Meriden, CT | 2.0 | 2.5 | 1320 | $2,450 | $1.86 | 1d | 1 | 0.86mi |
| 882 N Colony Rd Meriden, CT | 2.0 | 1.5 | 1232 | $3,000 | $2.44 | 10d | 1 | 0.86mi |
| 25 Amity St Meriden, CT | 3.0 | 1.5 | 1776 | $2,500 | $1.41 | 23d | 1 | 0.90mi |
| 200 Sams Rd Meriden, CT | 2.0–3.0 | 1.5–2.5 | 855 | $2,700 | $3.16 | 1d | 4 | 0.95mi |
| 77 Windsor Ave Unit 2 Meriden, CT | 2.0 | 1.0 | 896 | $1,700 | $1.90 | 44d | 1 | 0.98mi |
| 88 Olive St Meriden, CT | 3.0 | 1.0 | 1100 | $1,600 | $1.45 | 43d | 1 | 1.02mi |
| 33 Olive St Meriden, CT | 2.0 | 1.0 | 1763 | $1,550 | $0.88 | 43d | 1 | 1.05mi |
| 5 Oak St Unit 2 Meriden, CT | 2.0 | 1.0 | 911 | $1,500 | $1.65 | 43d | 1 | 1.05mi |
| 11 Nutmeg Dr Meriden, CT | 2.0–3.0 | 1.5–2.5 | 1600 | $2,600 | $1.62 | 1d | 4 | 1.15mi |
| 19 Goff St Meriden, CT | 3.0 | 1.5 | 900 | $1,700 | $1.89 | 43d | 1 | 1.32mi |
| 184 Gravel St #26 Meriden, CT | 2.0 | 1.5 | 1080 | $2,200 | $2.04 | 23d | 1 | 1.39mi |
| 130 Bradley Ave Apt 405 Meriden, CT | 2.0 | 1.0 | 1100 | $1,480 | $1.35 | 23d | 1 | 1.40mi |
| 130 Bradley Ave Apt 306 Meriden, CT | 2.0 | 1.0 | 1100 | $1,580 | $1.44 | 19d | 1 | 1.40mi |
| 130 Bradley Ave Meriden, CT | 2.0 | 1.0 | 1100 | $1,500 | $1.36 | 14d | 1 | 1.40mi |
| 31 Winthrop St Meriden, CT | 4.0 | 2.0 | 1550 | $2,400 | $1.55 | 3d | 1 | 1.45mi |
Listing history 10 events
-
2026-06-16status $259,000 Under Contract 13 DOM
-
2026-06-15days on market $259,000 Active 13 DOM
-
2026-06-14days on market $259,000 Active 11 DOM
-
2026-06-10days on market $259,000 Active 8 DOM
-
2026-06-09days on market $259,000 Active 7 DOM
-
2026-06-08days on market $259,000 Active 6 DOM
-
2026-06-07days on market $259,000 Active 5 DOM
-
2026-06-05days on market $259,000 Active 2 DOM
-
2026-06-03remarks 699-char remark
-
2026-06-03$259,000 Active 1 DOM
ⓘ Source: listings_history table (triggers on properties + properties_extension) + one-shot
backfill from property_details.listing_events for pre-trigger history.
Tax reassessment forecast CT · Partial reset (capped growth)
- Current annual tax
- $2,747 · $229/mo
- Projected year-2 tax
- $4,145 · $345/mo
- Expected delta
- +$1,398/yr (+$116/mo · 50.9%)
ⓘ Screening estimate from a state-policy table — verify with the county assessor before closing.
Climate risk First Street
- Flood 9/10 Extreme FEMA zone X (unshaded) · 99% chance over 30 yrs
- Wildfire 1/10 Low
- Heat 6/10 Major 7 d/yr ≥98°F today · 17 d/yr by 30 yrs out
- Wind 6/10 Major 27% chance of damaging wind over 30 yrs
- Air quality 4/10 Moderate 3 unhealthy d/yr today · 5 by 30 yrs out
Nearby sold comps map
Loading sold comps map…
Walkable amenities ~0.75 mi
Loading nearby amenities…
Taxation est. · year 1
- Rental income
- $36,408
- − Mortgage interest
- −$14,508
- − Property taxes
- −$2,747
- − Insurance
- −$1,962
- − Repairs & maintenance
- −$2,913
- − Management
- −$2,913
- − Depreciation
- −$7,535
- Taxable income
- $3,832
- Est. tax owed @ 24.0%
- −$920
- After-tax cash flow
- $6,836/yr
For passive investors: Depreciation is non-cash, so a rental often shows a tax loss while cash-flowing — sheltering income. Rental losses are passive: they offset passive income freely, and up to $25,000/yr can offset ordinary (W-2) income if you actively participate and your MAGI is under $100k (phasing out to $0 by $150k); unused losses carry forward. On sale, claimed depreciation is recaptured at up to 25%, and gains may owe capital-gains tax (a 1031 exchange can defer both). Figures are a year-1 estimate at your 24.0% rate — not tax advice; consult a CPA.
Schools (NCES district)
- District
- Meriden School District
- NCES district ID
- 0902400
- Math proficiency
- 27% ▼ -8.00%
- Reading proficiency
- 41% ▼ -6.00%
- Median HH income
- $53,883
- Composite
- 29.84/100
- National rank
- #6413
- State rank
- #116 of 153 in CT
Livability — Meriden
- Score
- 85/100
- State rank
- #4
- US rank
- #505
Category grades
Schools grade is shown separately in the Schools card above.
Census & demographics
- Census place
- Meriden, CT
- County
- New Haven County · 688,236 people
- City population
- 60,545
- Metro
- New Haven-Milford, CT
- Population (ZIP)
- 35,694
- Household income
- $71,250
- Rent vs Own
- Severe rent burden
- 1516.0
Population outlook (South Central Connecticut County) Hauer SSP2
- By 2040
- 608,362
Race, ethnicity, and origin ACS 2023
- Neighborhood character
- Diverse neighborhood (Simpson 0.60)
- Race & ethnicity
- White 51% Hispanic / Latino 36% Two or more races 16% Black 7% Asian 3%
- Hispanic origin (detail)
- Mexican 6% Puerto Rican 23% Dominican 3%
- Common ancestry
- Romanian 8% Lithuanian 4% Scotch-Irish 2%
- Foreign-born
- 10% · Canada, China, South Korea
- Languages at home
- 70% English-only · Spanish 25% Russian/Polish/Slavic 1% Other Indo-European 1%
Political lean MEDSL · South Central Connecticut
- 2024 margin
- Strong D (+20.1) · D 59.0% · R 38.9% · Other 2.1%
- All cycles
- 2024: D+20.1
Not yet ingested
- Civics
- —
Market trends
- HPI YoY
- ▼ -154.37%
- Current HPI
- 263.7288
- Rent YoY
- ▲ 1.65%
- Metro
- New Haven-Milford, CT
- State GDP YoY
- ▲ 1.06%
- F500 in state
- 38
Industry mix (Fortune 500 HQ in CT)
| Industry | F500 HQs | Revenue |
|---|---|---|
| Industrial Machinery | 4 | $38B |
|
||
| Insurance | 3 | $71B |
|
||
| Financial Services | 2 | $25B |
|
||
| Transportation / Logistics | 2 | $18B |
|
||
| Healthcare | 1 | $247B |
|
||
| Telecommunications | 1 | $55B |
|
||
Price history
+684.8% since first listed7 events — show timeline
- 2026-06-02 Listed $259,000 Smart MLS
- 2024-08-14 Listing Removed — Smart MLS
- 2024-07-08 Contingent — Smart MLS
- 2024-06-13 Listed $150,000 Smart MLS
- 2008-10-27 Sold (MLS) $79,000 Smart MLS
- 2008-02-25 Listed $89,900 Smart MLS
- 2001-02-26 Sold (Public Records) $33,000 Public Records
Property tax history
-0.2%/yrLatest (2023): $2,747 · +6.0% YoY. Source: county tax records.
Cash-flow waterfall
monthlySold comps — $/sqft
last 12 mo · ≤1 miLoading sold comps…