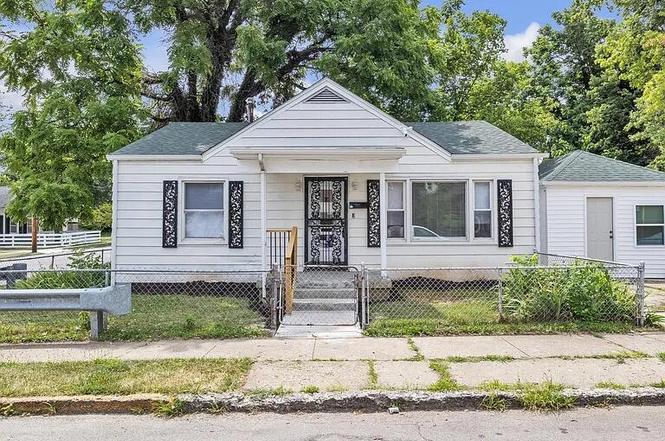
570 Ohio St · Lexington-Fayette, KY
Flood risk 1/10 · Minimal
- FEMA flood zone
- X (unshaded)
- Chance of flooding over 30 yrs
- 0.0%
- Est. flood insurance / yr
- $507 – $1,088
Fire risk 1/10 · Minimal
- Est. fire insurance / yr
- $839 – $1,559
Heat risk 4/10 · Minor
- Hot days now (above 101°F)
- 7 days/yr
- Hot days in 30 yrs
- 18 days/yr
Wind risk 2/10 · Minimal
- Chance of severe wind over 30 yrs
- 1.0%
Air-quality risk 1/10 · Minimal
- Unhealthy air days now
- 0 days/yr
- Unhealthy air days in 30 yrs
- 0 days/yr
Risk factors via First Street. Map © Google.
Why this score? — see what drove the C grade
The composite is a weighted blend of 9 inputs, each scored 0–100. Each bar is that input's sub-score; the figure is the points it added to the 100-point composite (weight × sub-score).
- Cash flow +18.8/30.0
- ARV discount +15.0/15.0
- DSCR +5.9/10.0
- 1% rule +5.0/10.0
- Rent growth +5.0/5.0
- Schools +3.4/10.0
- Livability +2.5/5.0
- Condition / age +2.5/5.0
- Appreciation +0.0/10.0
$149,900
🖨 Deal sheet 📄 Offer letter ✓ Due diligence
Listing remarks MLS
This adorable little ranch has been completely remodeled! The comprehensive renovation included adding a primary suite with a beautiful ensuite and walk-in shower. Refinished hardwood floors throughout the main living area and brand new laminate flooring in the primary suite. Both full bathrooms have had a total makeover with gorgeous tiled showers. Brand new range in the kitchen and updated cabinets. This home also has a brand new HVAC system and hot water heater (both less than one year old!). Electrical system and panel box have also been upgraded. This property is dual zoned for residential and/or commercial use. Cameras throughout the house are negotiable. Selling as-is, inspections welcome!
Key facts
- 2,678 sq ft lot
- Built 1900
- Listed 98 days
Neighborhood map
What this means for you Summary
Snapshot
- This is a 3-bed/1.0-bath single-family listed at $150k.
Deal economics
- At list price, monthly cash flow is $150 ($2k/yr) — positive.
- The deal already cash-flows at list — no discount required.
- Meets the 1% rule at list price ($2k rent vs $150k).
- Recommended offer: $136k (9.0% below list) — sets the bar for market timing.
- Cap rate 7.5% vs local median 3.8% in Lexington-Fayette — top-decile yield for the area; either an underpriced asset or a hidden risk that comps aren't pricing in. Stress-test before assuming the spread holds.
Location & tenants
- Location reads: area grade C — affects rentability + tenant quality, not the cash-flow math above.
- Fayette County (urban): math 35% / reading 45% proficiency, ranked #27 of 165 in KY (top 16%) — families likely to look elsewhere, expect single-tenant / working-renter base with shorter leases.
- Zoned schools: William Wells Brown Elementary (math 8% / reading 12%, grade F, #648 of 676 statewide, top 98%, 308 students, 86% FRL); Lexington Trad Magnet School (math 11% / reading 29%, grade F, #206 of 217 statewide, top 95%, 296 students, 81% FRL); Frederick Douglass High School (math 36% / reading 42%, grade F, #51 of 254 statewide, top 21%, 1,667 students, 43% FRL) — zoned schools average 70% FRL vs 44% district-wide (26 pts higher); higher-poverty schools than district average — tighter screening recommended.
- Zoned-school proficiency averages 23% at this address vs 40% district-wide (-17 pts) — the specific schools serving this property underperform the Fayette County average; the district grade overstates school quality for this exact location.
- Market conditions: Rents rising fast (+11.8%/yr); 82 active listings in the ZIP; 30 comparable units currently listed for rent nearby; rentals at typical pace (median 24d on market — plan ~3-4 weeks tenant-placement turnaround); lower-income renter base — watch delinquency; 1,036 units permitted in Fayette County in 2024 (542 in 5+ unit buildings).
Forward outlook
- Local home prices are declining (-3.0%/yr); year-one equity from $1k of loan paydown is wiped out by about $4k of value loss. Plan a longer hold.
- Fayette County population projected at +35% by 2050 — long-run rental-demand tailwind backs the buy-and-hold thesis.
- At projected returns (-3.0% appreciation + 8.0% rent growth), your $42k cash investment doubles in ~10 years — after that, you're playing with house money.
Negotiation context
- It's been on market 98 days — a 9% lower offer ($136k) is reasonable based on typical stale-listing flexibility.
- 4 sale attempts since 2y ago; this cycle's ask has dropped $10k (6%) from the opening price — seller is motivated, your offer sets the floor, not the list.
- Current owner paid $109k; 38% above their basis — modest negotiation headroom, anchor on the comps not their cost.
Risks & watch-outs
- Watch-outs: built in 1900 — expect roof / HVAC / electrical / plumbing capex.
Questions for the listing agent
- It's been on market 98 days. Have you received any prior offers? Is the seller open to a 9% concession, seller financing, or rate buy-down credit?
- Built in 1900 — when were the roof, HVAC, electrical panel, plumbing, and water heater last replaced?
- Why hasn't it sold? Are there any deal-killer items the seller is aware of (foundation, flood, title, zoning, code violations)?
- Is there a deadline driving the sale (1031 exchange, divorce, estate, relocation)? That informs how much negotiation room exists.
- What's the average days-on-market for RENTAL listings here right now (not sales)? A rising rental-DOM trend means longer vacancies and softer asking-rent achievability than the comps imply.
- What's the recent tenant-quality profile in this submarket — average credit score on applications, eviction rate, late-payment / NSF rate, and stable-employment percentage? A property-management company in the area should have these aggregated.
- How much new for-sale + rental construction is in the pipeline within 1–3 miles? Heavy new supply typically softens prices + rents 12–24 months out; constrained supply supports both.
Investment metrics
- 1% rule
- 1.00% ✓
- Cap rate
- 7.49%
- Cash-on-cash
- 4.28%
- DSCR
- 1.19
- GRM
- 8.3
CMA / ARV
- ARV (on-the-fly)
- $186,186
- Comps found
- 12
Show comp detail 12 sales within ~0.75 mi
| Address | Dist | Beds/Ba | Sqft | Sold | Price | $/sf | Match |
|---|---|---|---|---|---|---|---|
| 564 Ohio St | 0.01mi | 2/1.0 (-1) | 881 (+9%) | 11mo | $126,000 | $143 | 70 |
| 549 N Limestone | 0.37mi | 2/1.0 (-1) | 840 (+4%) | 3mo | $240,000 | $286 | 68 |
| 936 Highland Park Dr | 0.56mi | 2/1.0 (-1) | 816 (+1%) | 1mo | $190,000 | $233 | 66 |
| 569 N Upper St | 0.44mi | 2/1.0 (-1) | 775 (-4%) | 6mo | $68,600 | $89 | 64 |
| 522 Ohio St | 0.09mi | 2/1.0 (-1) | 714 (-11%) | 15mo | $145,000 | $203 | 59 |
| 830 E 7th St | 0.75mi | 2/1.0 (-1) | 785 (-3%) | 0mo | $180,000 | $229 | 55 |
| 440 Ohio St | 0.21mi | 2/1.0 (-1) | 900 (+12%) | 12mo | $161,300 | $179 | 55 |
| 132 York St | 0.38mi | 2/1.0 (-1) | 750 (-7%) | 14mo | $180,000 | $240 | 54 |
| 717 Aurora Ave | 0.72mi | 2/1.0 (-1) | 754 (-6%) | 6mo | $260,000 | $345 | 46 |
| 116 Avon Ave | 0.63mi | 2/1.0 (-1) | 834 (+4%) | 18mo | $168,000 | $201 | 45 |
| 126 Devonia Ave | 0.75mi | 3/1.5 | 924 (+15%) | 1mo | $225,000 | $244 | 38 |
| 920 Highland Park Dr | 0.50mi | 2/1.0 (-1) | 693 (-14%) | 14mo | $160,000 | $231 | 37 |
Match score weights: distance 35% · size 25% · config 20% · recency 20%. Top-matched comps best support the ARV.
Projected returns pro-forma
-3.0% appreciation · 8.0% rent growth · sell at horizon
- IRR
- -4.1%
- Equity multiple
- 0.84×
- Total profit
- $-6,811
- Equity at exit
- $22,351
- IRR
- 10.6%
- Equity multiple
- 2.01×
- Total profit
- $42,522
- Equity at exit
- $12,961
Cash invested: $41,972 (down + closing). Projections, not guarantees.
Landlord ↔ Tenant lean methodology
- Overall (STATE)
- 83 Strongly Landlord-Friendly
- State Kentucky
- 83 Strongly Landlord-Friendly · R+16
- County
- — inherits STATE
- City
- — inherits STATE
ZIP-level market 40508
- Rents YoY
- 11.8%
- Active inventory
- 82
- Price-to-rent
- 8.3×
Monthly cashflow live
- Estimated rent
- $1,501 high interval (Pro) →
- Mortgage (P&I)
- −$786
- Tax est. 1.5%
- −$187 /mo · $2,248/yr
- Insurance
- −$62
- HOA
- −$0
- Vacancy / Maint / Mgmt
- −$315
- Net cashflow
- $150
Break-even live
UW: 25.0% down · 7.5% · 30yr · 1.5% tax · 5.0% vac · 8.0% maint · 8.0% mgmt
Financing live
Cash to close
- Down payment
- $37,475
- Closing costs
- $4,497
- Reserves months
- —
- Total cash needed
- —
Loan-product check · same deal, 3 products live
Conventional
25% down · 7.5% · 30yr
- Down + closing
- —
- Monthly P&I
- —
- Monthly cashflow
- —
- DSCR
- —
- Eligible?
- —
Personal DTI + credit; lowest rate.
DSCR
20% down · 8.5% · 30yr
- Down + closing
- —
- Monthly P&I
- —
- Monthly cashflow
- —
- DSCR
- —
- Eligible?
- —
No personal income docs; deal must DSCR.
Hard money
10% down · 12.0% · 12mo
- Down + closing
- —
- Monthly P&I
- —
- Monthly cashflow
- —
- DSCR
- —
- Eligible?
- —
Short-term bridge; refi at stabilization.
Rent comps 30 comps
| Address | Beds | Baths | Sqft | Rent | $/sqft | DOM | Units | Dist |
|---|---|---|---|---|---|---|---|---|
| 706 Lancaster Ave Lexington, KY | 3.0 | 3.0 | 1050 | $1,495 | $1.42 | 14d | 1 | 0.20mi |
| 426 E Fifth St Unit Z1 Lexington, KY | 2.0 | 1.0 | 719 | $1,195 | $1.66 | 23d | 1 | 0.20mi |
| 214 E Seventh St Lexington, KY | 2.0 | 1.0 | 832 | $1,000 | $1.20 | 23d | 1 | 0.21mi |
| 425 Hawkins Ave Lexington, KY | 3.0 | 1.5 | 1124 | $1,570 | $1.40 | 14d | 1 | 0.27mi |
| 199 Eddie St Lexington, KY | 2.0 | 1.0 | 552 | $1,295 | $2.35 | 14d | 1 | 0.27mi |
| 434 N Martin Luther King Blvd #201 Lexington, KY | 2.0 | 2.0 | 950 | $1,450 | $1.53 | 23d | 1 | 0.32mi |
| 653 Jackson St Lexington, KY | 2.0 | 1.0 | 839 | $1,295 | $1.54 | 14d | 1 | 0.36mi |
| 161 E Loudon Ave Lexington, KY | 2.0 | 1.0 | 1118 | $1,300 | $1.16 | 23d | 1 | 0.44mi |
| 222 W Sixth St Lexington, KY | 3.0 | 1.5 | 1050 | $1,150 | $1.10 | 23d | 1 | 0.48mi |
| 246 Warnock St Lexington, KY | 2.0 | 1.0 | 810 | $1,195 | $1.48 | 23d | 1 | 0.50mi |
| 236 Warnock St Lexington, KY | 3.0 | 1.0 | 1028 | $2,200 | $2.14 | 23d | 1 | 0.52mi |
| 115 W Loudon Ave Unit L97 Lexington, KY | 3.0 | 2.0 | 960 | $980 | $1.02 | 23d | 1 | 0.64mi |
| 811 Shelby Ave Unit Z1 Lexington, KY | 2.0 | 1.0 | 792 | $1,224 | $1.55 | 14d | 1 | 0.86mi |
| 120 E Main St Lexington, KY | 2.0 | 1.0–2.0 | 710 | $2,486 | $3.50 | 14d | 20 | 0.87mi |
| 143 Woodland Ave Lexington, KY | 2.0 | 1.0 | 1100 | $1,650 | $1.50 | 23d | 1 | 0.94mi |
| 139 N Hanover Ave Lexington, KY | 2.0 | 1.0 | 600 | $1,275 | $2.12 | 23d | 1 | 1.00mi |
| 341 Grosvenor Ave Unit 1 Lexington, KY | 3.0 | 2.0 | 700 | $2,050 | $2.93 | 23d | 1 | 1.01mi |
| 341 Grosvenor Ave Unit 3 Lexington, KY | 3.0 | 3.0 | 875 | $2,500 | $2.86 | 23d | 1 | 1.01mi |
| 341 Grosvenor Ave #4 Lexington, KY | 3.0 | 3.0 | 859 | $2,600 | $3.03 | 23d | 1 | 1.01mi |
| 345 Blackburn Ave Lexington, KY | 2.0 | 2.0 | 946 | $1,925 | $2.03 | 14d | 1 | 1.04mi |
| 302 Owsley Ave Lexington, KY | 4.0 | 1.0 | 1025 | $1,895 | $1.85 | 23d | 1 | 1.09mi |
| 261 S Limestone #303 Lexington, KY | 2.0 | 2.0 | 1102 | $2,995 | $2.72 | 23d | 1 | 1.11mi |
| 275 S Limestone #115 Lexington, KY | 2.0 | 2.0 | 1010 | $2,500 | $2.48 | 23d | 1 | 1.12mi |
| 330 Newtown Pike Lexington, KY | 1.0–3.0 | 1.0–2.0 | 976 | $1,377 | $1.41 | 23d | 1 | 1.17mi |
| 330 Rose St Lexington, KY | 1.0–2.0 | 1.0 | 627 | $1,450 | $2.31 | 23d | 1 | 1.19mi |
| 161 Preston Ave #3 Lexington, KY | 2.0 | 1.0 | 900 | $1,500 | $1.67 | 14d | 1 | 1.27mi |
| 723 Charles Ave Lexington, KY | 3.0 | 1.0 | 992 | $1,300 | $1.31 | 14d | 1 | 1.29mi |
| 232 Bassett Ave Lexington, KY | 2.0 | 1.0 | 989 | $1,495 | $1.51 | 14d | 1 | 1.30mi |
| 832 W High St Unit 1 Lexington, KY | 3.0 | 1.5 | 900 | $1,400 | $1.56 | 23d | 1 | 1.40mi |
| 585 S Upper St #114 Lexington, KY | 2.0 | 2.0 | 1000 | $1,995 | $2.00 | 23d | 1 | 1.43mi |
Listing history 15 events
-
2026-03-17status Pending
-
2026-02-18price $149,900
-
2026-02-18price $174,900
-
2026-01-18status Active
-
2025-12-16historical
-
2025-11-07$159,900 Active
-
2024-08-30soldstatus $109,000 Closed 705-char remark
Show marketing remark (705 chars)
This adorable little ranch has been completely remodeled! The comprehensive renovation included adding a primary suite with a beautiful ensuite and walk-in shower. Refinished hardwood floors throughout the main living area and brand new laminate flooring in the primary suite. Both full bathrooms have had a total makeover with gorgeous tiled showers. Brand new range in the kitchen and updated cabinets. This home also has a brand new HVAC system and hot water heater (both less than one year old!). Electrical system and panel box have also been upgraded. This property is dual zoned for residential and/or commercial use. Cameras throughout the house are negotiable. Selling as-is, inspections welcome!
-
2024-08-23status Pending 705-char remark
Show marketing remark (705 chars)
This adorable little ranch has been completely remodeled! The comprehensive renovation included adding a primary suite with a beautiful ensuite and walk-in shower. Refinished hardwood floors throughout the main living area and brand new laminate flooring in the primary suite. Both full bathrooms have had a total makeover with gorgeous tiled showers. Brand new range in the kitchen and updated cabinets. This home also has a brand new HVAC system and hot water heater (both less than one year old!). Electrical system and panel box have also been upgraded. This property is dual zoned for residential and/or commercial use. Cameras throughout the house are negotiable. Selling as-is, inspections welcome!
-
2024-08-19historical Contingent 705-char remark
Show marketing remark (705 chars)
This adorable little ranch has been completely remodeled! The comprehensive renovation included adding a primary suite with a beautiful ensuite and walk-in shower. Refinished hardwood floors throughout the main living area and brand new laminate flooring in the primary suite. Both full bathrooms have had a total makeover with gorgeous tiled showers. Brand new range in the kitchen and updated cabinets. This home also has a brand new HVAC system and hot water heater (both less than one year old!). Electrical system and panel box have also been upgraded. This property is dual zoned for residential and/or commercial use. Cameras throughout the house are negotiable. Selling as-is, inspections welcome!
-
2024-08-16$109,000 Active 705-char remark
Show marketing remark (705 chars)
This adorable little ranch has been completely remodeled! The comprehensive renovation included adding a primary suite with a beautiful ensuite and walk-in shower. Refinished hardwood floors throughout the main living area and brand new laminate flooring in the primary suite. Both full bathrooms have had a total makeover with gorgeous tiled showers. Brand new range in the kitchen and updated cabinets. This home also has a brand new HVAC system and hot water heater (both less than one year old!). Electrical system and panel box have also been upgraded. This property is dual zoned for residential and/or commercial use. Cameras throughout the house are negotiable. Selling as-is, inspections welcome!
-
2024-08-14historical
-
2024-07-31price $149,000
-
2024-07-10price $159,000
-
2024-07-05$179,000 Active
-
2023-11-30soldstatus $50,000
ⓘ Source: listings_history table (triggers on properties + properties_extension) + one-shot
backfill from property_details.listing_events for pre-trigger history.
Climate risk First Street
- Flood 1/10 Low FEMA zone X (unshaded) · 0% chance over 30 yrs
- Wildfire 1/10 Low
- Heat 4/10 Moderate 7 d/yr ≥101°F today · 18 d/yr by 30 yrs out
- Wind 2/10 Low 100% chance of damaging wind over 30 yrs
- Air quality 1/10 Low 0 unhealthy d/yr today · 0 by 30 yrs out
Nearby sold comps map
Loading sold comps map…
Walkable amenities ~0.75 mi
Loading nearby amenities…
Taxation est. · year 1
- Rental income
- $18,007
- − Mortgage interest
- −$8,397
- − Property taxes
- −$2,248
- − Insurance
- −$750
- − Repairs & maintenance
- −$1,441
- − Management
- −$1,441
- − Depreciation
- −$4,361
- Taxable loss
- −$629
- Est. tax savings @ 24.0%
- +$151
- After-tax cash flow
- $1,946/yr
For passive investors: Depreciation is non-cash, so a rental often shows a tax loss while cash-flowing — sheltering income. Rental losses are passive: they offset passive income freely, and up to $25,000/yr can offset ordinary (W-2) income if you actively participate and your MAGI is under $100k (phasing out to $0 by $150k); unused losses carry forward. On sale, claimed depreciation is recaptured at up to 25%, and gains may owe capital-gains tax (a 1031 exchange can defer both). Figures are a year-1 estimate at your 24.0% rate — not tax advice; consult a CPA.
Schools (NCES district)
- District
- Fayette County
- NCES district ID
- 2101860
- Math proficiency
- 35% ▼ -16.00%
- Reading proficiency
- 45% ▼ -13.00%
- Median HH income
- $49,245
- Composite
- 34.38/100
- National rank
- #5211
- State rank
- #27 of 165 in KY
Livability — Lexington-Fayette
No livability data for this city. (Only ~50 U.S. cities are tracked.)
Census & demographics
- Census place
- Lexington-Fayette, KY
- County
- Fayette County · 317,143 people
- City population
- 321,882
- Metro
- Lexington-Fayette, KY
- Population (ZIP)
- 23,756
- Household income
- $29,440
- Rent vs Own
- Severe rent burden
- 2644.0
Population outlook (Fayette County) Hauer SSP2
- Today (2025)
- 363,454 people
- By 2030
- 388,270 · +6.8%
- By 2040
- 438,688 · +20.7%
- By 2050
- 490,667 · +35.0%
- By 2075
- 625,394 · +72.1%
- By 2100
- 721,354 · +98.5%
Race, ethnicity, and origin ACS 2023
- Neighborhood character
- Diverse neighborhood (Simpson 0.58)
- Race & ethnicity
- White 60% Black 22% Hispanic / Latino 9% Two or more races 7% Asian 3%
- Hispanic origin (detail)
- Mexican 5%
- Common ancestry
- Serbian 2% Italian 2% Lithuanian 2%
- Foreign-born
- 9% · Canada, China
- Languages at home
- 87% English-only · Spanish 8% Chinese 1% Other Indo-European 1%
Political lean MEDSL · Fayette
- 2024 margin
- D (+18.1) · D 58.0% · R 39.9% · Other 2.1%
- 2008→2024 swing
- +13.3pp toward D · 2008: 4.8pp · 2024: 18.1pp
- All cycles
- 2024: D+18.1 2020: D+20.8 2016: D+9.5 2012: D+1.0 2008: D+4.8
Not yet ingested
- Civics
- —
Market trends
- HPI YoY
- ▼ -251.04%
- Current HPI
- 204.3994
- Rent YoY
- ▲ 11.83%
- Metro
- Lexington-Fayette, KY
- State GDP YoY
- ▲ 1.81%
- F500 in state
- 4
Industry mix (Fortune 500 HQ in KY)
| Industry | F500 HQs | Revenue |
|---|---|---|
| Healthcare | 1 | $118B |
|
||
| Food / Beverage | 1 | $7B |
|
||
Price history
+199.8% since first listed15 events — show timeline
- 2026-03-17 Pending — ImagineMLS
- 2026-02-18 Price Changed $149,900 ImagineMLS
- 2026-02-18 Price Changed $174,900 ImagineMLS
- 2026-01-18 Relisted — ImagineMLS
- 2025-12-16 Listing Removed — ImagineMLS
- 2025-11-07 Listed $159,900 ImagineMLS
- 2024-08-30 Sold (MLS) $109,000 ImagineMLS
- 2024-08-23 Pending — ImagineMLS
- 2024-08-19 Contingent — ImagineMLS
- 2024-08-16 Listed $109,000 ImagineMLS
- 2024-08-14 Listing Removed — ImagineMLS
- 2024-07-31 Price Changed $149,000 ImagineMLS
- 2024-07-10 Price Changed $159,000 ImagineMLS
- 2024-07-05 Listed $179,000 ImagineMLS
- 2023-11-30 Sold (Public Records) $50,000 Public Records
Cash-flow waterfall
monthlySold comps — $/sqft
last 12 mo · ≤1 miLoading sold comps…