 🏷️ Likely Rental
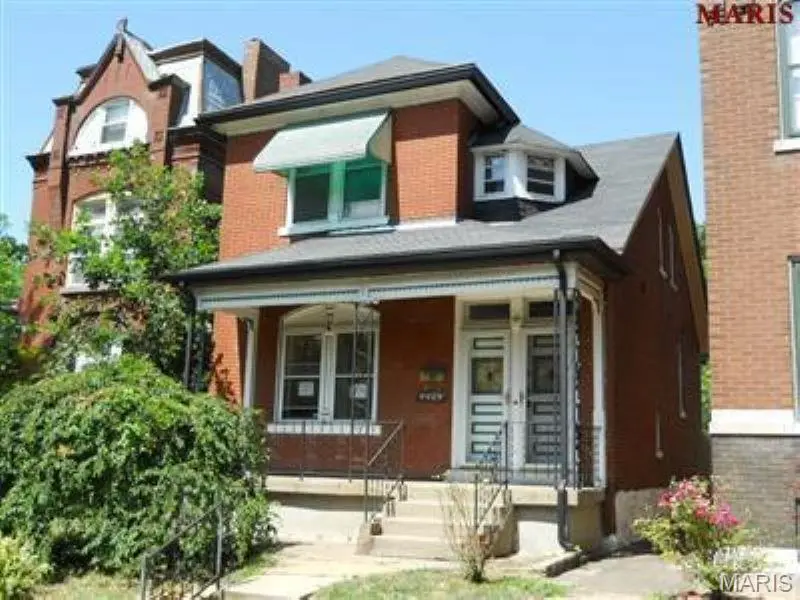
4429 Pennsylvania Ave · St. Louis, MO
Flood risk 1/10 · Minimal
- FEMA flood zone
- X (unshaded)
- Chance of flooding over 30 yrs
- 0.0%
- Est. flood insurance / yr
- $473 – $860
Fire risk 1/10 · Minimal
- Est. fire insurance / yr
- $1,054 – $1,958
Heat risk 5/10 · Moderate
- Hot days now (above 108°F)
- 7 days/yr
- Hot days in 30 yrs
- 21 days/yr
Wind risk 2/10 · Minimal
- Chance of severe wind over 30 yrs
- 1.0%
Air-quality risk 3/10 · Minor
- Unhealthy air days now
- 3 days/yr
- Unhealthy air days in 30 yrs
- 4 days/yr
Risk factors via First Street. Map © Google.
Why this score? — see what drove the B- grade
The composite is a weighted blend of 9 inputs, each scored 0–100. Each bar is that input's sub-score; the figure is the points it added to the 100-point composite (weight × sub-score).
- Cash flow +30.0/30.0
- 1% rule +10.0/10.0
- DSCR +10.0/10.0
- ARV discount +7.5/15.0
- Rent growth +3.3/5.0
- Livability +2.5/5.0
- Condition / age +2.5/5.0
- Schools +1.2/10.0
- Appreciation +0.0/10.0
$44,900
🖨 Deal sheet 📄 Offer letter ✓ Due diligence
Listing remarks MLS
South City charmer full of potential! Located at 4429 Pennsylvania Ave, this 2-bedroom, 1-bath home is a fantastic opportunity for investors or rehabbers looking to bring their vision to life. The main floor features hardwood flooring throughout, along with some original millwork that adds character and historic appeal. This property has been consistently rented over the years, offering a strong track record as an income-producing asset, and is ready for updates, improvements, or a new tenant. With the right touch, this home could truly shine. Whether you're looking to renovate and resell or add to your rental portfolio, this is a great chance to invest in a classic South City property with solid bones and timeless charm.
Key facts
- 3,175 sq ft lot
- Built 1898
- Listed 35 days
Neighborhood map
What this means for you Summary
Snapshot
- This is a 2-bed/1.0-bath single-family listed at $45k.
Deal economics
- At list price, monthly cash flow is $509 ($6k/yr) — positive.
- The deal already cash-flows at list — no discount required.
- Meets the 1% rule at list price ($1k rent vs $45k).
- Recommended offer: $44k (3.0% below list) — sets the bar for market timing.
- Cap rate 19.9% vs local median 5.0% in St. Louis — top-decile yield for the area; either an underpriced asset or a hidden risk that comps aren't pricing in. Stress-test before assuming the spread holds.
Location & tenants
- Location reads: area grade B — affects rentability + tenant quality, not the cash-flow math above.
- St. Louis City (urban): math 10% / reading 18% proficiency, ranked #312 of 324 in MO (top 96%) — low school quality limits family demand, transient renter base, plan for 1-2y turnover; 80% free/reduced lunch — lower-income household profile, screen leases tightly.
- Market conditions: Rents rising (+3.3%/yr); 125 active listings in the ZIP; 40 comparable units currently listed for rent nearby; rentals at typical pace (median 24d on market — plan ~3-4 weeks tenant-placement turnaround); 294 units permitted in St. Louis city in 2024 (227 in 5+ unit buildings).
Forward outlook
- Local home prices are declining (-3.0%/yr); year-one equity from $310 of loan paydown is wiped out by about $1k of value loss. Plan a longer hold.
- St. Louis County population projected to shrink 6% by 2050 — rents likely to lag national; underwrite the cash flow, not the appreciation.
- At projected returns (-3.0% appreciation + 3.3% rent growth), your $13k cash investment doubles in ~3 years — after that, you're playing with house money.
Negotiation context
- It's been on market 35 days — a 3% lower offer ($44k) is reasonable based on typical stale-listing flexibility.
- 2 sale attempts; this cycle's ask has dropped $15k (25%) from the opening price — seller is motivated, your offer sets the floor, not the list.
Risks & watch-outs
- Watch-outs: built in 1898 — expect roof / HVAC / electrical / plumbing capex.
- Climate carrying-cost: extreme-heat days projected 7→21/yr by 2055 (HVAC capex compounding) — expect insurance premiums to compound above CPI over the hold.
Questions for the listing agent
- It's been on market 35 days. Have you received any prior offers? Is the seller open to a 3% concession, seller financing, or rate buy-down credit?
- Built in 1898 — when were the roof, HVAC, electrical panel, plumbing, and water heater last replaced?
- Is there a deadline driving the sale (1031 exchange, divorce, estate, relocation)? That informs how much negotiation room exists.
- What's the average days-on-market for RENTAL listings here right now (not sales)? A rising rental-DOM trend means longer vacancies and softer asking-rent achievability than the comps imply.
- What's the recent tenant-quality profile in this submarket — average credit score on applications, eviction rate, late-payment / NSF rate, and stable-employment percentage? A property-management company in the area should have these aggregated.
- How much new for-sale + rental construction is in the pipeline within 1–3 miles? Heavy new supply typically softens prices + rents 12–24 months out; constrained supply supports both.
Investment metrics
- 1% rule
- 2.39% ✓
- Cap rate
- 19.89%
- Cash-on-cash
- 48.58%
- DSCR
- 3.16
- GRM
- 3.5
CMA / ARV
- ARV (median comp)
- $149,830
- List price
- $44,900
- Delta
- -70.03%
- Verdict
- UNDERPRICED
- Comps
- 20 within 1.0 mi
Show comp detail 12 sales within ~0.75 mi
| Address | Dist | Beds/Ba | Sqft | Sold | Price | $/sf | Match |
|---|---|---|---|---|---|---|---|
| 3025 Mount Pleasant St | 0.18mi | 3/2.0 (+1) | 1,462 (+3%) | 0mo | $130,000 | $89 | 77 |
| 4240 Nebraska Ave | 0.25mi | 3/— (+1) | 1,476 (+4%) | 6mo | $35,000 | $24 | 72 |
| 4636 S Compton Ave | 0.31mi | 3/2.0 (+1) | 1,502 (+6%) | 2mo | $180,000 | $120 | 66 |
| 3139 Mount Pleasant St | 0.23mi | 3/2.0 (+1) | 1,270 (-11%) | 1mo | $175,000 | $138 | 62 |
| 4224 Grace Ave | 0.55mi | 2/1.0 | 1,498 (+5%) | 6mo | $115,900 | $77 | 60 |
| 5011 Alaska Ave | 0.64mi | 3/1.5 (+1) | 1,369 (-4%) | 1mo | $184,900 | $135 | 56 |
| 5030 Idaho Ave | 0.64mi | 2/2.0 | 1,350 (-5%) | 8mo | $159,900 | $118 | 51 |
| 4659 Tennessee Ave | 0.56mi | 2/1.0 | 1,215 (-15%) | 1mo | $109,000 | $90 | 49 |
| 4116 Virginia Ave | 0.45mi | 3/2.0 (+1) | 1,613 (+13%) | 1mo | $235,000 | $146 | 46 |
| 3740 Meramec St | 0.71mi | 2/1.0 | 1,600 (+12%) | 1mo | $95,000 | $59 | 45 |
| 5123 Wicklow Pl | 0.64mi | 3/2.0 (+1) | 1,315 (-8%) | 6mo | $210,000 | $160 | 44 |
| 4921 S Compton Ave | 0.53mi | 3/2.0 (+1) | 1,210 (-15%) | 4mo | $224,900 | $186 | 38 |
Match score weights: distance 35% · size 25% · config 20% · recency 20%. Top-matched comps best support the ARV.
Projected returns pro-forma
-3.0% appreciation · 3.27% rent growth · sell at horizon
- IRR
- 46.5%
- Equity multiple
- 3.03×
- Total profit
- $25,466
- Equity at exit
- $6,695
- IRR
- 52.4%
- Equity multiple
- 6.19×
- Total profit
- $65,260
- Equity at exit
- $3,882
Cash invested: $12,572 (down + closing). Projections, not guarantees.
Landlord ↔ Tenant lean methodology
- Overall (STATE)
- 81 Strongly Landlord-Friendly
- State Missouri
- 81 Strongly Landlord-Friendly · R+10
- County
- — inherits STATE
- City
- — inherits STATE
ZIP-level market 63111
- Rents YoY
- 3.3%
- Active inventory
- 125
- Price-to-rent
- 3.5×
Monthly cashflow live
- Estimated rent
- $1,074 high interval (Pro) →
- Mortgage (P&I)
- −$235
- Tax from tax record
- −$85 /mo · $1,024/yr
- Insurance
- −$19
- HOA
- −$0
- Vacancy / Maint / Mgmt
- −$226
- Net cashflow
- $509
Break-even live
UW: 25.0% down · 7.5% · 30yr · 1.5% tax · 5.0% vac · 8.0% maint · 8.0% mgmt
Financing live
Cash to close
- Down payment
- $11,225
- Closing costs
- $1,347
- Reserves months
- —
- Total cash needed
- —
Loan-product check · same deal, 3 products live
Conventional
25% down · 7.5% · 30yr
- Down + closing
- —
- Monthly P&I
- —
- Monthly cashflow
- —
- DSCR
- —
- Eligible?
- —
Personal DTI + credit; lowest rate.
DSCR
20% down · 8.5% · 30yr
- Down + closing
- —
- Monthly P&I
- —
- Monthly cashflow
- —
- DSCR
- —
- Eligible?
- —
No personal income docs; deal must DSCR.
Hard money
10% down · 12.0% · 12mo
- Down + closing
- —
- Monthly P&I
- —
- Monthly cashflow
- —
- DSCR
- —
- Eligible?
- —
Short-term bridge; refi at stabilization.
Rent comps 40 comps
| Address | Beds | Baths | Sqft | Rent | $/sqft | DOM | Units | Dist |
|---|---|---|---|---|---|---|---|---|
| 4450 Pennsylvania Ave Saint Louis, MO | 3.0 | 1.0 | 1500 | $1,100 | $0.73 | 4d | 1 | 0.09mi |
| 4513 Pennsylvania Ave Unit 4515 1F St. Louis, MO | 1.0 | 1.0 | 1000 | $875 | $0.88 | 43d | 1 | 0.12mi |
| 4308 Nebraska Ave Unit A St. Louis, MO | 1.0 | 1.0 | 1012 | $1,148 | $1.13 | 7d | 1 | 0.18mi |
| 4308 Nebraska Ave Unit B St. Louis, MO | 2.0 | 2.0 | 1012 | $1,148 | $1.13 | 7d | 1 | 0.18mi |
| 4528 Nebraska Ave Unit 305 St. Louis, MO | 2.0 | 2.0 | 950 | $1,345 | $1.42 | 23d | 1 | 0.20mi |
| 4542 Virginia Ave Unit 1F St. Louis, MO | 1.0 | 1.0 | 935 | $700 | $0.75 | 23d | 1 | 0.30mi |
| 4617 S Compton Ave Saint Louis, MO | 1.0 | 1.0 | 987 | $795 | $0.81 | 3d | 1 | 0.30mi |
| 4238 California Ave St. Louis, MO | 2.0 | 1.0 | 1000 | $1,300 | $1.30 | 43d | 1 | 0.31mi |
| 4127 Minnesota Ave Unit 1F St. Louis, MO | 3.0 | 1.0 | 1155 | $1,200 | $1.04 | 43d | 1 | 0.36mi |
| 4127 Minnesota Ave Unit 2F St. Louis, MO | 3.0 | 1.0 | 1155 | $1,200 | $1.04 | 43d | 1 | 0.36mi |
| 4130 Minnesota Ave Saint Louis, MO | 2.0 | 1.0 | 1234 | $975 | $0.79 | 14d | 1 | 0.36mi |
| 4145 S Compton Ave Saint Louis, MO | 3.0 | 2.0 | 1656 | $1,520 | $0.92 | 43d | 1 | 0.36mi |
| 4126 Minnesota Ave Unit 2f St. Louis, MO | 2.0 | 1.0 | 1150 | $1,028 | $0.89 | 23d | 1 | 0.36mi |
| 3230 Pulaski St Unit 3232B St. Louis, MO | 1.0 | 1.0 | 892 | $885 | $0.99 | 4d | 1 | 0.36mi |
| 4127 Oregon Ave Unit 2F St. Louis, MO | 2.0 | 1.0 | 1000 | $1,203 | $1.20 | 23d | 1 | 0.39mi |
| 4657 Idaho Ave Unit 4659 St. Louis, MO | 2.0 | 2.0 | 1668 | $1,295 | $0.78 | 23d | 1 | 0.41mi |
| 3138 Gasconade St Unit 3138 2W St. Louis, MO | 1.0 | 1.0 | 950 | $850 | $0.89 | 17d | 1 | 0.41mi |
| 4401 Tennessee Ave Unit A St. Louis, MO | 1.0 | 1.0 | 1100 | $995 | $0.90 | 4d | 1 | 0.41mi |
| 4637 Louisiana Ave Saint Louis, MO | 2.0 | 1.0 | 1104 | $1,175 | $1.06 | 12d | 1 | 0.45mi |
| 4416 S Grand Blvd Saint Louis, MO | 3.0 | 1.0 | 963 | $1,550 | $1.61 | 23d | 1 | 0.46mi |
| 4217 S Grand Blvd Unit 1 St. Louis, MO | 3.0 | 1.0 | 1250 | $1,400 | $1.12 | 4d | 1 | 0.48mi |
| 3324 Liberty St Saint Louis, MO | 2.0 | 1.0 | 1100 | $950 | $0.86 | 16d | 1 | 0.51mi |
| 3243 Delor St Unit 3243 St. Louis, MO | 3.0 | 1.0 | 1100 | $1,250 | $1.14 | 22d | 1 | 0.51mi |
| 4716 Louisiana Ave Unit 2F St. Louis, MO | 2.0 | 1.0 | 1200 | $995 | $0.83 | 43d | 1 | 0.55mi |
| 3637 Meramec St Saint Louis, MO | 3.0 | 1.5 | 1632 | $1,925 | $1.18 | 17d | 1 | 0.56mi |
| 2806 Osage St Apt 2E St. Louis, MO | 1.0 | 1.0 | 992 | $750 | $0.76 | 43d | 1 | 0.56mi |
| 4684 S Grand Blvd Saint Louis, MO | 1.0 | 1.0 | 1000 | $800 | $0.80 | 10d | 1 | 0.60mi |
| 3922 Minnesota Ave Saint Louis, MO | 2.0 | 1.0 | 1000 | $925 | $0.93 | 43d | 1 | 0.61mi |
| 5102 Wicklow Pl Saint Louis, MO | 2.0 | 1.5 | 928 | $1,350 | $1.45 | 23d | 1 | 0.62mi |
| 3914 Michigan Ave Saint Louis, MO | 2.0 | 1.0 | 1376 | $1,150 | $0.84 | 43d | 1 | 0.63mi |
| 5009 S Broadway St Unit 5011A St. Louis, MO | 2.0 | 1.0 | 990 | $1,200 | $1.21 | 43d | 1 | 0.63mi |
| 4234 Dewey Ave Saint Louis, MO | 1.0 | 1.0 | 884 | $745 | $0.84 | 43d | 1 | 0.63mi |
| 3635 Marceline Ter Unit 2ND St. Louis, MO | 3.0 | 1.0 | 1250 | $1,275 | $1.02 | 43d | 1 | 0.64mi |
| 4722 S Grand Blvd Unit 2N St. Louis, MO | 1.0 | 1.0 | 925 | $750 | $0.81 | 14d | 1 | 0.64mi |
| 3116 Keokuk St Unit 1F St. Louis, MO | 2.0 | 1.0 | 900 | $850 | $0.94 | 2d | 1 | 0.65mi |
| 3116 Keokuk St Saint Louis, MO | 2.0 | 1.0 | 900 | $850 | $0.94 | 2d | 1 | 0.65mi |
| 3146 Keokuk St Saint Louis, MO | 3.0 | 1.0 | 1528 | $1,500 | $0.98 | 23d | 1 | 0.65mi |
| 5027 S Broadway St Unit 5027 St. Louis, MO | 2.0 | 1.0 | 900 | $950 | $1.06 | 43d | 1 | 0.66mi |
| 3855 Minnesota Ave Unit B St. Louis, MO | 2.0 | 1.0 | 900 | $850 | $0.94 | 43d | 1 | 0.68mi |
| 3131 Keokuk St #3131 Saint Louis, MO | 3.0 | 2.0 | 1500 | $1,475 | $0.98 | 14d | 1 | 0.68mi |
Listing history 6 events
-
2026-05-14price $44,900 733-char remark
Show marketing remark (733 chars)
South City charmer full of potential! Located at 4429 Pennsylvania Ave, this 2-bedroom, 1-bath home is a fantastic opportunity for investors or rehabbers looking to bring their vision to life. The main floor features hardwood flooring throughout, along with some original millwork that adds character and historic appeal. This property has been consistently rented over the years, offering a strong track record as an income-producing asset, and is ready for updates, improvements, or a new tenant. With the right touch, this home could truly shine. Whether you're looking to renovate and resell or add to your rental portfolio, this is a great chance to invest in a classic South City property with solid bones and timeless charm.
-
2026-04-22status Active 733-char remark
Show marketing remark (733 chars)
South City charmer full of potential! Located at 4429 Pennsylvania Ave, this 2-bedroom, 1-bath home is a fantastic opportunity for investors or rehabbers looking to bring their vision to life. The main floor features hardwood flooring throughout, along with some original millwork that adds character and historic appeal. This property has been consistently rented over the years, offering a strong track record as an income-producing asset, and is ready for updates, improvements, or a new tenant. With the right touch, this home could truly shine. Whether you're looking to renovate and resell or add to your rental portfolio, this is a great chance to invest in a classic South City property with solid bones and timeless charm.
-
2026-04-02status Pending 733-char remark
Show marketing remark (733 chars)
South City charmer full of potential! Located at 4429 Pennsylvania Ave, this 2-bedroom, 1-bath home is a fantastic opportunity for investors or rehabbers looking to bring their vision to life. The main floor features hardwood flooring throughout, along with some original millwork that adds character and historic appeal. This property has been consistently rented over the years, offering a strong track record as an income-producing asset, and is ready for updates, improvements, or a new tenant. With the right touch, this home could truly shine. Whether you're looking to renovate and resell or add to your rental portfolio, this is a great chance to invest in a classic South City property with solid bones and timeless charm.
-
2026-03-26$59,900 Active 733-char remark
Show marketing remark (733 chars)
South City charmer full of potential! Located at 4429 Pennsylvania Ave, this 2-bedroom, 1-bath home is a fantastic opportunity for investors or rehabbers looking to bring their vision to life. The main floor features hardwood flooring throughout, along with some original millwork that adds character and historic appeal. This property has been consistently rented over the years, offering a strong track record as an income-producing asset, and is ready for updates, improvements, or a new tenant. With the right touch, this home could truly shine. Whether you're looking to renovate and resell or add to your rental portfolio, this is a great chance to invest in a classic South City property with solid bones and timeless charm.
-
2022-03-15price $875
-
2004-11-02soldstatus
ⓘ Source: listings_history table (triggers on properties + properties_extension) + one-shot
backfill from property_details.listing_events for pre-trigger history.
Tax reassessment forecast MO · Resets to sale price
- Current annual tax
- $1,024 · $85/mo
- Projected year-2 tax
- $1,024 · $85/mo
- Expected delta
- $0/yr ($0/mo · 0.0%)
ⓘ Screening estimate from a state-policy table — verify with the county assessor before closing.
Climate risk First Street
- Flood 1/10 Low FEMA zone X (unshaded) · 0% chance over 30 yrs
- Wildfire 1/10 Low
- Heat 5/10 Major 7 d/yr ≥108°F today · 21 d/yr by 30 yrs out
- Wind 2/10 Low 100% chance of damaging wind over 30 yrs
- Air quality 3/10 Moderate 3 unhealthy d/yr today · 4 by 30 yrs out
Nearby sold comps map
Loading sold comps map…
Walkable amenities ~0.75 mi
Loading nearby amenities…
Taxation est. · year 1
- Rental income
- $12,888
- − Mortgage interest
- −$2,515
- − Property taxes
- −$1,024
- − Insurance
- −$224
- − Repairs & maintenance
- −$1,031
- − Management
- −$1,031
- − Depreciation
- −$1,306
- Taxable income
- $5,756
- Est. tax owed @ 24.0%
- −$1,381
- After-tax cash flow
- $4,726/yr
For passive investors: Depreciation is non-cash, so a rental often shows a tax loss while cash-flowing — sheltering income. Rental losses are passive: they offset passive income freely, and up to $25,000/yr can offset ordinary (W-2) income if you actively participate and your MAGI is under $100k (phasing out to $0 by $150k); unused losses carry forward. On sale, claimed depreciation is recaptured at up to 25%, and gains may owe capital-gains tax (a 1031 exchange can defer both). Figures are a year-1 estimate at your 24.0% rate — not tax advice; consult a CPA.
Schools (NCES district)
- District
- St. Louis City
- NCES district ID
- 2929280
- Math proficiency
- 10% ▼ -6.00%
- Reading proficiency
- 18% ▼ -3.00%
- Median HH income
- $35,685
- Composite
- 11.54/100
- National rank
- #9699
- State rank
- #312 of 324 in MO
Livability — St. Louis
No livability data for this city. (Only ~50 U.S. cities are tracked.)
Census & demographics
- Census place
- St. Louis, MO
- County
- Saint Louis City · 254,015 people
- City population
- 283,259
- Metro
- St. Louis, MO-IL
- Population (ZIP)
- 18,851
- Household income
- $47,039
- Rent vs Own
- Severe rent burden
- 1364.0
Population outlook (St. Louis County) Hauer SSP2
- Today (2025)
- 315,737 people
- By 2030
- 313,865 · -0.6%
- By 2040
- 305,439 · -3.3%
- By 2050
- 296,529 · -6.1%
- By 2075
- 271,028 · -14.2%
- By 2100
- 255,359 · -19.1%
Race, ethnicity, and origin ACS 2023
- Neighborhood character
- Diverse neighborhood (Simpson 0.65)
- Race & ethnicity
- Black 42% White 41% Two or more races 11% Hispanic / Latino 9% Asian 1%
- Hispanic origin (detail)
- Mexican 6%
- Common ancestry
- Lithuanian 3% Slovak 1% Romanian 1%
- Foreign-born
- 7% · Canada, India
- Languages at home
- 90% English-only · Spanish 7% Other Indo-European 1%
Political lean MEDSL · St. Louis
- 2024 margin
- Solid D (+64.7) · D 81.4% · R 16.7% · Other 2.0%
- 2008→2024 swing
- -3.5pp toward R · 2008: 68.2pp · 2024: 64.7pp
- All cycles
- 2024: D+64.7 2020: D+66.2 2016: D+63.7 2012: D+66.6 2008: D+68.2
Not yet ingested
- Civics
- —
Market trends
- HPI YoY
- ▼ -92.80%
- Current HPI
- 169.4644
- Rent YoY
- ▲ 3.27%
- Metro
- St. Louis, MO-IL
- State GDP YoY
- ▲ 1.84%
- F500 in state
- 20
Industry mix (Fortune 500 HQ in MO)
| Industry | F500 HQs | Revenue |
|---|---|---|
| Healthcare | 1 | $163B |
|
||
| Insurance | 1 | $21B |
|
||
| Industrial Technology | 1 | $17B |
|
||
| Retail | 1 | $16B |
|
||
| Industrial Distribution | 1 | $10B |
|
||
| Utilities | 1 | $9B |
|
||
Price history
-25.0% since first listed6 events — show timeline
- 2026-05-14 Price Changed $44,900 MARIS as Distributed by MLS Grid
- 2026-04-22 Relisted — MARIS as Distributed by MLS Grid
- 2026-04-02 Pending — MARIS as Distributed by MLS Grid
- 2026-03-26 Listed $59,900 MARIS as Distributed by MLS Grid
- 2022-03-15 Price Changed $875 RENT.
- 2004-11-02 Sold (Public Records) — Public Records
Property tax history
+5.1%/yrLatest (2024): $1,024 · +5.0% YoY. Source: county tax records.
Cash-flow waterfall
monthlySold comps — $/sqft
last 12 mo · ≤1 miLoading sold comps…