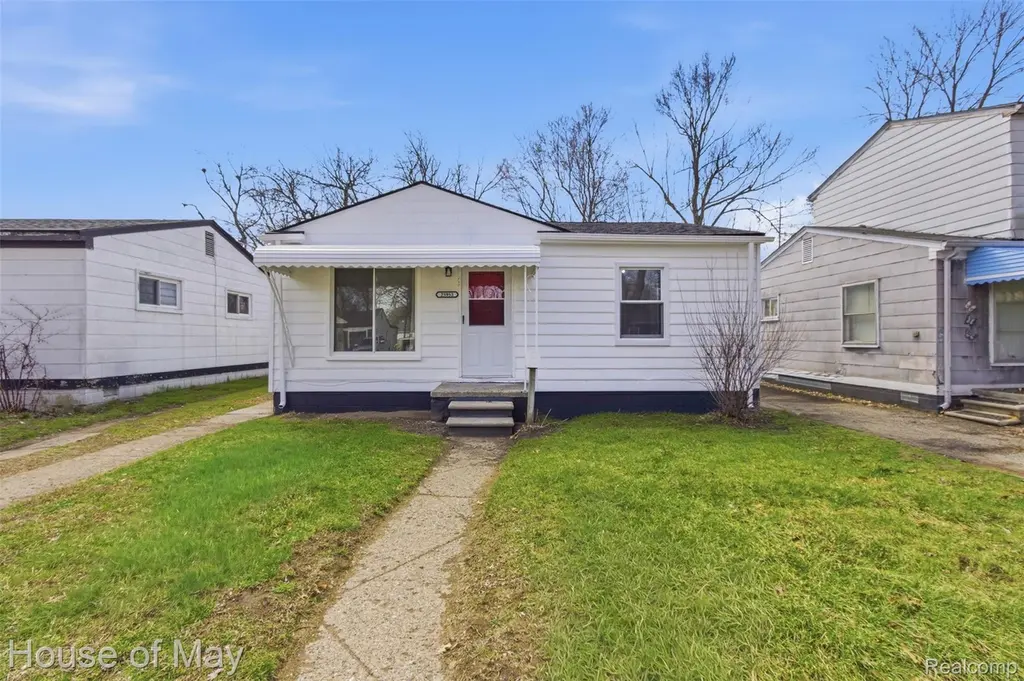
25953 Dartmouth St · Inkster, MI
Flood risk 1/10 · Minimal
- FEMA flood zone
- X (unshaded)
- Chance of flooding over 30 yrs
- 0.0%
- Est. flood insurance / yr
- $507 – $1,088
Fire risk 1/10 · Minimal
- Est. fire insurance / yr
- $784 – $1,456
Heat risk 3/10 · Minor
- Hot days now (above 98°F)
- 7 days/yr
- Hot days in 30 yrs
- 14 days/yr
Wind risk 2/10 · Minimal
- Chance of severe wind over 30 yrs
- —
Air-quality risk 2/10 · Minimal
- Unhealthy air days now
- 1 days/yr
- Unhealthy air days in 30 yrs
- 2 days/yr
Risk factors via First Street. Map © Google.
Why this score? — see what drove the C+ grade
The composite is a weighted blend of 9 inputs, each scored 0–100. Each bar is that input's sub-score; the figure is the points it added to the 100-point composite (weight × sub-score).
- Cash flow +30.0/30.0
- 1% rule +10.0/10.0
- DSCR +10.0/10.0
- Livability +3.4/5.0
- Rent growth +3.2/5.0
- ARV discount +2.9/15.0
- Condition / age +2.5/5.0
- Schools +0.7/10.0
- Appreciation +0.0/10.0
$79,000
🖨 Deal sheet (PDF) 📄 Offer letter ✓ Due diligence
Listing remarks MLS
Welcome to the newly updated 25953 Dartmouth St! This gorgeous ranch delivers the perfect balance of affordability, functionality and upside for homeowners and investors! From the moment you step inside, you're greeted with beautiful hardwood flooring, neutral finishes and natural light that fills the home, creating an inviting atmosphere that is both comfortable and convenient. The floorplan flows graciously into two comfortably sized bedrooms and a spacious kitchen that offers generous cabinetry and a functional layout, ideal for everyday living with room to personalize over time. Seller has completed the Certificate of Occupancy, ensuring the property meets city compliance standards and is ready for immediate occupancy. Recent improvements include new paint throughout, updated plumbing systems, and a series of renovations that enhance both functionality and aesthetics of the home. Step outside to a deep backyard with plenty of green space, perfect for entertaining, gardening, or future enhancements. The lot size alone provides added value and flexibility for long-term use. We're excited to showcase this amazing home. Schedule your tour today!
Key facts
- Hardwood flooring
- Generous cabinetry
- New paint
Tags
Property features AI
Exterior
- Parking: No garage
- Utilities: Public water; Public sewer
- Home design: Single-family residence; One story; Ground-level entry
- Construction: Vinyl siding
- Exterior features: Paved road access; Lot dimensions approximately 40 x 138 (0.13 acres)
Interior
- Bathrooms: 1 full bathroom
- Heating & cooling: Forced air heating (natural gas); No cooling
- Interior features: Crawl space basement; Total of 4 rooms
Neighborhood map
What this means for you Summary
Snapshot
- This is a 2-bed/1.0-bath single-family listed at $79k.
Deal economics
- At list price, monthly cash flow is $459 ($6k/yr) — positive.
- The deal already cash-flows at list — no discount required.
- Meets the 1% rule at list price ($1k rent vs $79k).
- Recommended offer: $77k (3.0% below list) — sets the bar for market timing.
- Cap rate 13.3% vs local median 9.3% in Inkster — top-decile yield for the area; either an underpriced asset or a hidden risk that comps aren't pricing in. Stress-test before assuming the spread holds.
Location & tenants
- Location reads 67/100 on livability (#406 in MI) — a middle-class / working-renter tenant base. Strengths: commute A+, cost of living A+, housing A+; Watch: health & safety D, schools F, crime F.
- Westwood Community School District (suburban): math 6% / reading 11% proficiency, ranked #529 of 540 in MI (top 98%) — low school quality limits family demand, transient renter base, plan for 1-2y turnover; 81% free/reduced lunch — lower-income household profile, screen leases tightly.
- Market conditions: Rents rising (+3.0%/yr); 146 active listings in the ZIP; 1 comparable units currently listed for rent nearby; lower-income renter base — watch delinquency; 2,639 units permitted in Wayne County in 2024 (1,216 in 5+ unit buildings).
- This rent runs 38% of the median local income ($39k/yr) — at the standard rent-burdened threshold; future hikes will face affordability resistance.
Forward outlook
- Local home prices are declining (-3.0%/yr); year-one equity from $546 of loan paydown is wiped out by about $2k of value loss. Plan a longer hold.
- Wayne County population projected at -17% by 2050 — secular population decline; favor cash flow + early exit over multi-decade hold.
- At projected returns (-3.0% appreciation + 3.0% rent growth), your $22k cash investment doubles in ~5 years — after that, you're playing with house money.
Negotiation context
- It's been on market 57 days — a 3% lower offer ($77k) is reasonable based on typical stale-listing flexibility.
- 3 sale attempts since 17y ago with the ask held roughly flat each time — persistent listings suggest the price (not the market) is what's stuck; bring a comps-based counter.
- Current owner paid $6k; list at $79k implies a 1115% gain — meaningful room to come down on a strong offer.
Risks & watch-outs
- Watch-outs: built in 1954 — expect roof / HVAC / electrical / plumbing capex.
Questions for the listing agent
- It's been on market 57 days. Have you received any prior offers? Is the seller open to a 3% concession, seller financing, or rate buy-down credit?
- Built in 1954 — when were the roof, HVAC, electrical panel, plumbing, and water heater last replaced?
- Is there a deadline driving the sale (1031 exchange, divorce, estate, relocation)? That informs how much negotiation room exists.
- Schools are F-rated, which usually means shorter tenancies and higher turnover. Who's the typical renter profile here, and what's been the actual vacancy rate?
- Crime grade is F in this area — have there been break-ins, vandalism, or insurance claims at this property in the last 3 years? What carrier currently insures it and at what premium?
- What's the average days-on-market for RENTAL listings here right now (not sales)? A rising rental-DOM trend means longer vacancies and softer asking-rent achievability than the comps imply.
- What's the recent tenant-quality profile in this submarket — average credit score on applications, eviction rate, late-payment / NSF rate, and stable-employment percentage? A property-management company in the area should have these aggregated.
- How much new for-sale + rental construction is in the pipeline within 1–3 miles? Heavy new supply typically softens prices + rents 12–24 months out; constrained supply supports both.
Investment metrics
- 1% rule
- 1.57% ✓
- Cap rate
- 13.27%
- Cash-on-cash
- 24.91%
- DSCR
- 2.11
- GRM
- 5.3
CMA / ARV
- ARV (on-the-fly)
- $71,688
- Comps found
- 12
Show comp detail 12 sales within ~0.75 mi
| Address | Dist | Beds/Ba | Sqft | Sold | Price | $/sf | Match |
|---|---|---|---|---|---|---|---|
| 25866 Andover St | 0.06mi | 2/1.0 | 696 (0%) | 9mo | $48,000 | $69 | 90 |
| 26241 Annapolis St | 0.43mi | 2/1.0 | 696 (0%) | 6mo | $54,500 | $78 | 74 |
| 26252 Eton Ave | 0.52mi | 2/1.0 | 696 (0%) | 8mo | $123,000 | $177 | 69 |
| 25933 Norfolk St | 0.56mi | 2/1.0 | 710 (+2%) | 5mo | $90,000 | $127 | 66 |
| 25960 Yale St | 0.53mi | 2/1.0 | 680 (-2%) | 10mo | $70,000 | $103 | 63 |
| 24754 Annapolis St | 0.72mi | 2/1.0 | 702 (+1%) | 3mo | $121,000 | $172 | 62 |
| 26389 Annapolis St | 0.48mi | 2/1.0 | 729 (+5%) | 9mo | $126,500 | $174 | 62 |
| 26641 New York St | 0.62mi | 2/1.0 | 720 (+3%) | 5mo | $66,000 | $92 | 62 |
| 25911 Norfolk St | 0.56mi | 2/2.0 | 710 (+2%) | 12mo | $53,100 | $75 | 56 |
| 24691 Dartmouth St | 0.70mi | 2/1.0 | 720 (+3%) | 11mo | $185,000 | $257 | 52 |
| 26970 Colgate St | 0.62mi | 2/1.0 | 756 (+9%) | 14mo | $65,000 | $86 | 45 |
| 5169 Glenis St | 0.74mi | 2/1.0 | 800 (+15%) | 13mo | $70,000 | $88 | 30 |
Match score weights: distance 35% · size 25% · config 20% · recency 20%. Top-matched comps best support the ARV.
Projected returns pro-forma
-3.0% appreciation · 2.95% rent growth · sell at horizon
- IRR
- 18.3%
- Equity multiple
- 1.74×
- Total profit
- $16,381
- Equity at exit
- $11,779
- IRR
- 26.7%
- Equity multiple
- 3.34×
- Total profit
- $51,672
- Equity at exit
- $6,830
Cash invested: $22,120 (down + closing). Projections, not guarantees.
Landlord ↔ Tenant lean methodology
- Overall (STATE)
- 62 Landlord-Friendly
- State Michigan
- 62 Landlord-Friendly · EVEN
- County
- — inherits STATE
- City
- — inherits STATE
ZIP-level market 48141
- Home prices YoY
- -2.9%
- Rents YoY
- 3.0%
- Active inventory
- 146
- Price-to-rent
- 5.3×
Monthly cashflow live
- Estimated rent
- $1,237 medium interval (Pro) →
- Mortgage (P&I)
- −$414
- Tax from tax record
- −$71 /mo · $854/yr
- Insurance
- −$33
- HOA
- −$0
- Vacancy / Maint / Mgmt
- −$260
- Net cashflow
- $459
Break-even live
Sensitivity live
| Price | -10% $504 | -5% $482 | +0% $459 | +5% $437 | +10% $414 |
|---|---|---|---|---|---|
| Rent | -10% $361 | -5% $410 | +0% $459 | +5% $508 | +10% $557 |
| Rate | -1.0pp $499 | -0.5pp $479 | base $459 | +0.5pp $439 | +1.0pp $418 |
UW: 25.0% down · 7.5% · 30yr · 1.5% tax · 5.0% vac · 8.0% maint · 8.0% mgmt
Financing live
Cash to close
- Down payment
- $19,750
- Closing costs
- $2,370
- Reserves months
- —
- Total cash needed
- —
Loan-product check · same deal, 3 products live
Conventional
25% down · 7.5% · 30yr
- Down + closing
- —
- Monthly P&I
- —
- Monthly cashflow
- —
- DSCR
- —
- Eligible?
- —
Personal DTI + credit; lowest rate.
DSCR
20% down · 8.5% · 30yr
- Down + closing
- —
- Monthly P&I
- —
- Monthly cashflow
- —
- DSCR
- —
- Eligible?
- —
No personal income docs; deal must DSCR.
Hard money
10% down · 12.0% · 12mo
- Down + closing
- —
- Monthly P&I
- —
- Monthly cashflow
- —
- DSCR
- —
- Eligible?
- —
Short-term bridge; refi at stabilization.
Rent comps 1 comps
| Address | Beds | Baths | Sqft | Rent | $/sqft | DOM | Units | Dist |
|---|---|---|---|---|---|---|---|---|
| 5845 Michael St Taylor, MI | 2.0 | 1.0 | 618 | $1,325 | $2.14 | 5d | 1 | 1.00mi |
Listing history 20 events
-
2026-06-21days on market $79,000 Active 57 DOM
-
2026-06-18days on market $79,000 Active 54 DOM
-
2026-06-17days on market $79,000 Active 53 DOM
-
2026-06-16days on market $79,000 Active 52 DOM
-
2026-06-15days on market $79,000 Active 51 DOM
-
2026-06-13days on market $79,000 Active 49 DOM
-
2026-06-13days on market $79,000 Active 48 DOM
-
2026-06-09days on market $79,000 Active 45 DOM
-
2026-06-08days on market $79,000 Active 44 DOM
-
2026-06-07days on market $79,000 Active 43 DOM
-
2026-06-04days on market $79,000 Active 40 DOM
-
2026-06-03days on market $79,000 Active 39 DOM
-
2026-06-02days on market $79,000 Active 38 DOM
-
2026-06-01days on market $79,000 Active 37 DOM
-
2026-05-31days on market $79,000 Active 36 DOM
-
2026-04-25$79,000 Active
Show marketing remark (1163 chars)
Welcome to the newly updated 25953 Dartmouth St! This gorgeous ranch delivers the perfect balance of affordability, functionality and upside for homeowners and investors! From the moment you step inside, you're greeted with beautiful hardwood flooring, neutral finishes and natural light that fills the home, creating an inviting atmosphere that is both comfortable and convenient. The floorplan flows graciously into two comfortably sized bedrooms and a spacious kitchen that offers generous cabinetry and a functional layout, ideal for everyday living with room to personalize over time. Seller has completed the Certificate of Occupancy, ensuring the property meets city compliance standards and is ready for immediate occupancy. Recent improvements include new paint throughout, updated plumbing systems, and a series of renovations that enhance both functionality and aesthetics of the home. Step outside to a deep backyard with plenty of green space, perfect for entertaining, gardening, or future enhancements. The lot size alone provides added value and flexibility for long-term use. We're excited to showcase this amazing home. Schedule your tour today!
-
2026-04-25$79,000 Active 1163-char remark
Show marketing remark (1163 chars)
Welcome to the newly updated 25953 Dartmouth St! This gorgeous ranch delivers the perfect balance of affordability, functionality and upside for homeowners and investors! From the moment you step inside, you're greeted with beautiful hardwood flooring, neutral finishes and natural light that fills the home, creating an inviting atmosphere that is both comfortable and convenient. The floorplan flows graciously into two comfortably sized bedrooms and a spacious kitchen that offers generous cabinetry and a functional layout, ideal for everyday living with room to personalize over time. Seller has completed the Certificate of Occupancy, ensuring the property meets city compliance standards and is ready for immediate occupancy. Recent improvements include new paint throughout, updated plumbing systems, and a series of renovations that enhance both functionality and aesthetics of the home. Step outside to a deep backyard with plenty of green space, perfect for entertaining, gardening, or future enhancements. The lot size alone provides added value and flexibility for long-term use. We're excited to showcase this amazing home. Schedule your tour today!
-
2010-02-16soldstatus $6,500 187-char remark
Show marketing remark (187 chars)
SUBJECT TO THIRD PARTY APPROVAL. COMMISSION SUBJECT TO BANK APPROVAL AND MIGHT CHANGE. SOLD AS IS. BUYER RESPONSIBLE FOR CITY INSPECTION AND OBTAINING THE ACR. SOME APPLIANCES. NEEDS TLC.
-
2009-10-09$7,900 187-char remark
Show marketing remark (187 chars)
SUBJECT TO THIRD PARTY APPROVAL. COMMISSION SUBJECT TO BANK APPROVAL AND MIGHT CHANGE. SOLD AS IS. BUYER RESPONSIBLE FOR CITY INSPECTION AND OBTAINING THE ACR. SOME APPLIANCES. NEEDS TLC.
-
2000-05-10soldstatus $20,000
ⓘ Source: listings_history table (triggers on properties + properties_extension) + one-shot
backfill from property_details.listing_events for pre-trigger history.
Tax reassessment forecast MI · Partial reset (capped growth)
- Current annual tax
- $854 · $71/mo
- Projected year-2 tax
- $1,035 · $86/mo
- Expected delta
- +$182/yr (+$15/mo · 21.3%)
ⓘ Screening estimate from a state-policy table — verify with the county assessor before closing.
Climate risk First Street
- Flood 1/10 Low FEMA zone X (unshaded) · 0% chance over 30 yrs
- Wildfire 1/10 Low
- Heat 3/10 Moderate 7 d/yr ≥98°F today · 14 d/yr by 30 yrs out
- Wind 2/10 Low
- Air quality 2/10 Low 1 unhealthy d/yr today · 2 by 30 yrs out
Nearby sold comps map
Loading sold comps map…
Walkable amenities ~0.75 mi
Loading nearby amenities…
Taxation est. · year 1
- Rental income
- $14,848
- − Mortgage interest
- −$4,425
- − Property taxes
- −$854
- − Insurance
- −$395
- − Repairs & maintenance
- −$1,188
- − Management
- −$1,188
- − Depreciation
- −$2,298
- Taxable income
- $4,500
- Est. tax owed @ 24.0%
- −$1,080
- After-tax cash flow
- $4,430/yr
For passive investors: Depreciation is non-cash, so a rental often shows a tax loss while cash-flowing — sheltering income. Rental losses are passive: they offset passive income freely, and up to $25,000/yr can offset ordinary (W-2) income if you actively participate and your MAGI is under $100k (phasing out to $0 by $150k); unused losses carry forward. On sale, claimed depreciation is recaptured at up to 25%, and gains may owe capital-gains tax (a 1031 exchange can defer both). Figures are a year-1 estimate at your 24.0% rate — not tax advice; consult a CPA.
Schools (NCES district)
- District
- Westwood Community School District
- NCES district ID
- 2611640
- Math proficiency
- 6% ▼ -6.00%
- Reading proficiency
- 11% ▼ -6.00%
- Median HH income
- $36,350
- Composite
- 7.06/100
- National rank
- #9967
- State rank
- #529 of 540 in MI
Livability — Inkster
- Score
- 67/100
- State rank
- #406
- US rank
- #11087
Category grades
Schools grade is shown separately in the Schools card above.
Census & demographics
- Census place
- Inkster, MI
- County
- Wayne County · 1,562,939 people
- City population
- 25,428
- Metro
- Detroit-Warren-Dearborn, MI
- Population (ZIP)
- 25,428
- Household income
- $39,252
- Rent vs Own
- Severe rent burden
- 1558.0
Population outlook (Wayne County) Hauer SSP2
- Today (2025)
- 1,675,273 people
- By 2030
- 1,620,300 · -3.3%
- By 2040
- 1,502,341 · -10.3%
- By 2050
- 1,384,039 · -17.4%
- By 2075
- 1,124,592 · -32.9%
- By 2100
- 881,193 · -47.4%
Race, ethnicity, and origin ACS 2023
- Neighborhood character
- Predominantly Black (72%)
- Race & ethnicity
- Black 72% White 17% Two or more races 7% Hispanic / Latino 2% Asian 1%
- Common ancestry
- Romanian 3% Slovak 1% Italian 1%
- Foreign-born
- 5% · Canada, China
- Languages at home
- 92% English-only · Arabic 3% Other Asian/Pacific 1% Spanish 1%
Political lean MEDSL · Wayne
- 2024 margin
- Strong D (+29.0) · D 62.7% · R 33.7% · Other 3.6%
- 2008→2024 swing
- -20.5pp toward R · 2008: 49.5pp · 2024: 29.0pp
- All cycles
- 2024: D+29.0 2020: D+38.1 2016: D+37.3 2012: D+46.9 2008: D+49.5
Not yet ingested
- Civics
- —
Market trends
- HPI YoY
- ▼ -11.74%
- Current HPI
- 390.2139
- Rent YoY
- ▲ 2.95%
- Metro
- Detroit-Warren-Dearborn, MI
- State GDP YoY
- ▲ 1.37%
- F500 in state
- 28
Industry mix (Fortune 500 HQ in MI)
| Industry | F500 HQs | Revenue |
|---|---|---|
| Automotive Parts | 3 | $48B |
|
||
| Automotive | 2 | $372B |
|
||
| Chemicals | 1 | $45B |
|
||
| Automotive Retail | 1 | $29B |
|
||
| Healthcare / Medical Devices | 1 | $23B |
|
||
| Automotive Technology | 1 | $20B |
|
||
Price history
+295.0% since first listed5 events — show timeline
- 2026-04-25 Listed $79,000 REALCOMP
- 2026-04-25 Listed $79,000 MiRealSource-MiMLS
- 2010-02-16 Sold (MLS) $6,500 REALCOMP
- 2009-10-09 Listed $7,900 REALCOMP
- 2000-05-10 Sold (Public Records) $20,000 Public Records
Property tax history
-6.4%/yrLatest (2025): $854 · -49.7% YoY. Source: county tax records.
Cash-flow waterfall
monthlySold comps — $/sqft
last 12 mo · ≤1 miLoading sold comps…