 🔨 Auction
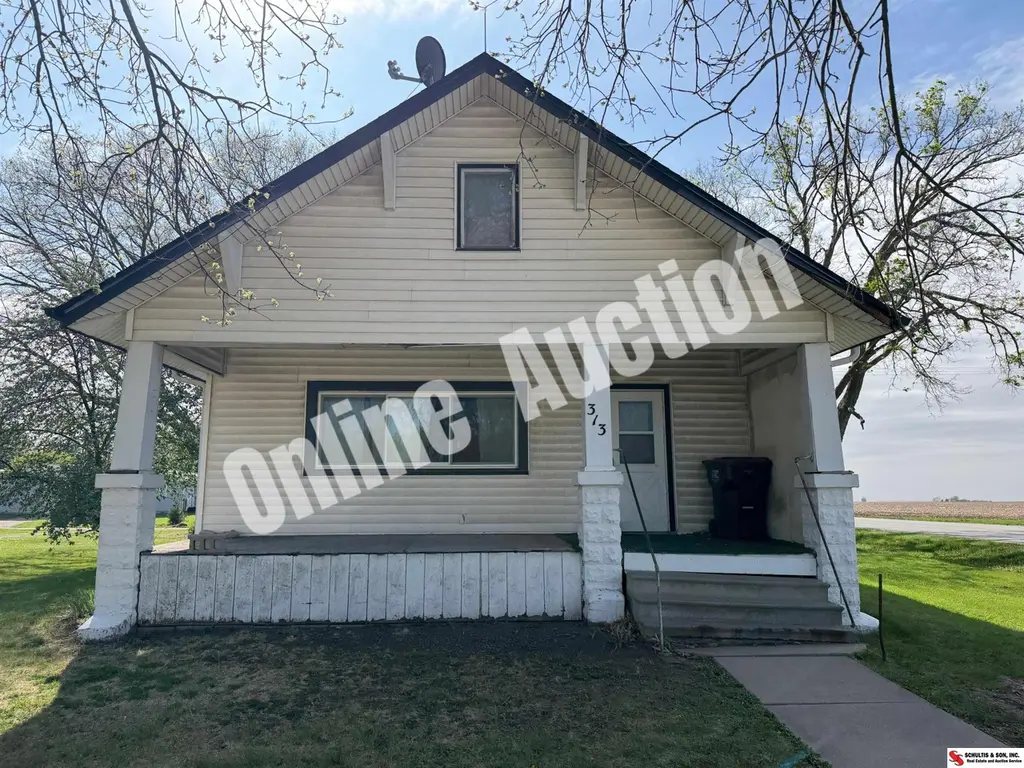
313 N County Rd · Plymouth, NE
Flood risk 1/10 · Minimal
- FEMA flood zone
- X (unshaded)
- Chance of flooding over 30 yrs
- 0.0%
- Est. flood insurance / yr
- $473 – $860
Fire risk 1/10 · Minimal
- Est. fire insurance / yr
- $1,161 – $2,155
Heat risk 3/10 · Minor
- Hot days now (above 105°F)
- 7 days/yr
- Hot days in 30 yrs
- 16 days/yr
Wind risk 2/10 · Minimal
- Chance of severe wind over 30 yrs
- —
Air-quality risk 1/10 · Minimal
- Unhealthy air days now
- 0 days/yr
- Unhealthy air days in 30 yrs
- 0 days/yr
Risk factors via First Street. Map © Google.
Why this score? — see what drove the B- grade
The composite is a weighted blend of 9 inputs, each scored 0–100. Each bar is that input's sub-score; the figure is the points it added to the 100-point composite (weight × sub-score).
- Cash flow +23.6/30.0
- Appreciation +7.7/10.0
- DSCR +7.6/10.0
- ARV discount +7.5/15.0
- 1% rule +6.1/10.0
- Schools +4.9/10.0
- Livability +2.9/5.0
- Rent growth +2.5/5.0
- Condition / age +2.5/5.0
$1
🖨 Deal sheet (PDF) 📄 Offer letter ✓ Due diligence
Listing remarks
ONLINE ONLY AUCTION ends Friday, May 15th at 6 PM (soft close). Bidding and Auction Terms and Conditions at www. bidschultis.com. The 1,482 sq ft home features a living room, dining room, kitchen, 2 bedrooms, and a bathroom on the main floor. The upstairs has a ton of possibilities! The home has a newer roof, vinyl siding, and newer windows. There is a detached garage behind the home. The lot is 75'x140'.
Key facts
- Newer roof
- 75x140 lot
- Newer windows
Tags
Property features AI
Exterior
- Parking: Detached garage; 2 covered parking spaces; 2 total parking spaces
- Utilities: Public water; Public sewer
- Home design: Single-family residence; One and one-half stories; Built in 1918; Not new / not a model
- Construction: Block foundation
- Exterior features: Porch; Lot approximately 0.24 acre (75 x 140), up to 1/4 acre
Interior
- Bedrooms: Master bedroom on the main floor; Second bedroom on the main floor; Total of 5 rooms
- Bathrooms: One bathroom on the main level; One three-quarter bathroom
- Heating & cooling: Natural gas heating; Forced air heating
- Interior features: Unfinished basement; No fireplaces
Neighborhood map
What this means for you Summary
Snapshot
- This is a 3-bed/1.5-bath single-family listed at $1.
Deal economics
- At list price, monthly cash flow is $229 ($3k/yr) — positive.
- The deal already cash-flows at list — no discount required.
- Meets the 1% rule at list price ($1k rent vs $1).
Location & tenants
- Location reads 58/100 on livability (#494 in NE) — a working-class tenant base; expect higher turnover. Strengths: cost of living A+, housing A+; Watch: health & safety C-, employment D, amenities F.
- Tri County Public Schools (rural): math 56% / reading 58% proficiency, ranked #28 of 111 in NE (top 25%) — acceptable for families but not a draw, mixed tenant base, ~2y average lease.
- Zoned schools: Tri County Elementary School (math 62% / reading 62%, grade B, #93 of 502 statewide, top 21%, 238 students, 30% FRL); Tri County Jr-Sr High School (math 47% / reading 57%, grade D+, #98 of 261 statewide, top 40%, 192 students, 35% FRL).
- Market conditions: 5 active listings in the ZIP; 9 units permitted in Jefferson County in 2024 (0 in 5+ unit buildings).
Forward outlook
- In year one you build about $7k of equity ($837 loan paydown + $7k appreciation (5.4% local appreciation)).
- Jefferson County population projected to shrink 6% by 2050 — rents likely to lag national; underwrite the cash flow, not the appreciation.
- At projected returns (5.4% appreciation + 3.0% rent growth), your $34k cash investment doubles in ~4 years — after that, you're playing with house money.
- By year 5, paydown + projected appreciation supports a ~$32k cash-out refi (75% LTV) — recoverable capital for the next deal without selling this one.
Negotiation context
- It's been on market 31 days — a 3% lower offer ($0) is reasonable based on typical stale-listing flexibility.
Risks & watch-outs
- Watch-outs: property tax is 181714.5% of price; built in 1918 — expect roof / HVAC / electrical / plumbing capex.
Questions for the listing agent
- It's been on market 31 days. Have you received any prior offers? Is the seller open to a 5% concession, seller financing, or rate buy-down credit?
- Built in 1918 — when were the roof, HVAC, electrical panel, plumbing, and water heater last replaced?
- Property tax is high relative to price — has the assessment been appealed recently, and will the sale trigger a re-assessment?
- Is there a deadline driving the sale (1031 exchange, divorce, estate, relocation)? That informs how much negotiation room exists.
- Schools are D-rated, which usually means shorter tenancies and higher turnover. Who's the typical renter profile here, and what's been the actual vacancy rate?
- What's the average days-on-market for RENTAL listings here right now (not sales)? A rising rental-DOM trend means longer vacancies and softer asking-rent achievability than the comps imply.
- What's the recent tenant-quality profile in this submarket — average credit score on applications, eviction rate, late-payment / NSF rate, and stable-employment percentage? A property-management company in the area should have these aggregated.
- How much new for-sale + rental construction is in the pipeline within 1–3 miles? Heavy new supply typically softens prices + rents 12–24 months out; constrained supply supports both.
Investment metrics
- 1% rule
- 1.11% ✓
- Cap rate
- 8.56%
- Cash-on-cash
- 8.11%
- DSCR
- 1.36
- GRM
- 7.5
CMA / ARV
- ARV (median comp)
- $121,143
- List price
- $1
- Delta
- -100.00%
- Verdict
- UNDERPRICED
- Comps
- 7 within 1.0 mi
Show comp detail 4 sales within ~0.75 mi
| Address | Dist | Beds/Ba | Sqft | Sold | Price | $/sf | Match |
|---|---|---|---|---|---|---|---|
| 102 E Main St | 0.18mi | 4/2.0 (+1) | 1,574 (+6%) | 7mo | $197,000 | $125 | 68 |
| 203 N Madison Ave | 0.18mi | 3/1.0 | 1,444 (-3%) | 22mo | $76,000 | $53 | 67 |
| 105 S County Rd | 0.22mi | 2/1.0 (-1) | 1,333 (-10%) | 12mo | $85,000 | $64 | 56 |
| 115 N Jefferson Ave | 0.25mi | 2/2.0 (-1) | 1,300 (-12%) | 13mo | $119,500 | $92 | 50 |
Match score weights: distance 35% · size 25% · config 20% · recency 20%. Top-matched comps best support the ARV.
Projected returns pro-forma
5.44% appreciation · 3.0% rent growth · sell at horizon
- IRR
- 20.8%
- Equity multiple
- 2.35×
- Total profit
- $45,633
- Equity at exit
- $71,945
- IRR
- 20.3%
- Equity multiple
- 4.66×
- Total profit
- $124,023
- Equity at exit
- $126,980
Cash invested: $33,920 (down + closing). Projections, not guarantees.
Landlord ↔ Tenant lean methodology
- Overall (STATE)
- 83 Strongly Landlord-Friendly
- State Nebraska
- 83 Strongly Landlord-Friendly · R+13
- County
- — inherits STATE
- City
- — inherits STATE
ZIP-level market 68424
- Home prices YoY
- 1.9%
- Active inventory
- 5
Monthly cashflow live
- Estimated rent
- $1,350 medium interval (Pro) →
- Mortgage (P&I)
- −$635
- Tax est. 1.5%
- −$151 /mo · $1,817/yr
- Insurance
- −$50
- HOA
- −$0
- Vacancy / Maint / Mgmt
- −$283
- Net cashflow
- $229
Break-even live
Sensitivity live
| Price | -10% $313 | -5% $271 | +0% $229 | +5% $187 | +10% $145 |
|---|---|---|---|---|---|
| Rent | -10% $123 | -5% $176 | +0% $229 | +5% $282 | +10% $336 |
| Rate | -1.0pp $290 | -0.5pp $260 | base $229 | +0.5pp $198 | +1.0pp $166 |
UW: 25.0% down · 7.5% · 30yr · 1.5% tax · 5.0% vac · 8.0% maint · 8.0% mgmt
Financing live
Cash to close
- Down payment
- $30,286
- Closing costs
- $3,634
- Reserves months
- —
- Total cash needed
- —
Loan-product check · same deal, 3 products live
Conventional
25% down · 7.5% · 30yr
- Down + closing
- —
- Monthly P&I
- —
- Monthly cashflow
- —
- DSCR
- —
- Eligible?
- —
Personal DTI + credit; lowest rate.
DSCR
20% down · 8.5% · 30yr
- Down + closing
- —
- Monthly P&I
- —
- Monthly cashflow
- —
- DSCR
- —
- Eligible?
- —
No personal income docs; deal must DSCR.
Hard money
10% down · 12.0% · 12mo
- Down + closing
- —
- Monthly P&I
- —
- Monthly cashflow
- —
- DSCR
- —
- Eligible?
- —
Short-term bridge; refi at stabilization.
Listing history 1 events
-
2026-04-01$1 New 413-char remark
ⓘ Source: listings_history table (triggers on properties + properties_extension) + one-shot
backfill from property_details.listing_events for pre-trigger history.
Climate risk First Street
- Flood 1/10 Low FEMA zone X (unshaded) · 0% chance over 30 yrs
- Wildfire 1/10 Low
- Heat 3/10 Moderate 7 d/yr ≥105°F today · 16 d/yr by 30 yrs out
- Wind 2/10 Low
- Air quality 1/10 Low 0 unhealthy d/yr today · 0 by 30 yrs out
Nearby sold comps map
Loading sold comps map…
Walkable amenities ~0.75 mi
Loading nearby amenities…
Taxation est. · year 1
- Rental income
- $16,197
- − Mortgage interest
- −$6,786
- − Property taxes
- −$1,817
- − Insurance
- −$606
- − Repairs & maintenance
- −$1,296
- − Management
- −$1,296
- − Depreciation
- −$3,524
- Taxable income
- $873
- Est. tax owed @ 24.0%
- −$210
- After-tax cash flow
- $2,540/yr
For passive investors: Depreciation is non-cash, so a rental often shows a tax loss while cash-flowing — sheltering income. Rental losses are passive: they offset passive income freely, and up to $25,000/yr can offset ordinary (W-2) income if you actively participate and your MAGI is under $100k (phasing out to $0 by $150k); unused losses carry forward. On sale, claimed depreciation is recaptured at up to 25%, and gains may owe capital-gains tax (a 1031 exchange can defer both). Figures are a year-1 estimate at your 24.0% rate — not tax advice; consult a CPA.
Schools (NCES district)
- District
- Tri County Public Schools
- NCES district ID
- 3105970
- Math proficiency
- 56% ▲ 6.00%
- Reading proficiency
- 58% ▲ 8.00%
- Median HH income
- $51,517
- Composite
- 48.73/100
- National rank
- #2098
- State rank
- #28 of 111 in NE
Livability — Plymouth
- Score
- 58/100
- State rank
- #494
- US rank
- #21099
Category grades
Schools grade is shown separately in the Schools card above.
Census & demographics
- Census place
- Plymouth, NE
- Population (ZIP)
- 747
Population outlook (Jefferson County) Hauer SSP2
- Today (2025)
- 6,961 people
- By 2030
- 6,831 · -1.9%
- By 2040
- 6,590 · -5.3%
- By 2050
- 6,510 · -6.5%
- By 2075
- 6,831 · -1.9%
- By 2100
- 7,072 · +1.6%
Race, ethnicity, and origin ACS 2023
- Neighborhood character
- Predominantly White (98%)
- Race & ethnicity
- White 98% Two or more races 2%
- Common ancestry
- French 4% Lithuanian 2% Iranian 1%
- Foreign-born
- 7%
- Languages at home
- 97% English-only · Spanish 3%
Political lean MEDSL · Jefferson
- 2024 margin
- Solid R (+45.3) · D 26.7% · R 72.0% · Other 1.4%
- 2008→2024 swing
- -29.6pp toward R · 2008: -15.8pp · 2024: -45.3pp
- All cycles
- 2024: R+45.3 2020: R+42.9 2016: R+45.4 2012: R+28.4 2008: R+15.8
Not yet ingested
- Civics
- —
Market trends
- HPI YoY
- ▲ 5.44%
- Current HPI
- 294.943
- Rent YoY
- —
- Metro
- —
- State GDP YoY
- ▲ 0.68%
- F500 in state
- 2
Industry mix (Fortune 500 HQ in NE)
| Industry | F500 HQs | Revenue |
|---|---|---|
| Conglomerate | 1 | $371B |
|
||
Price history
3 events — show timeline
- 2026-06-03 Sold (MLS) $47,300 GPRMLS
- 2026-05-22 Pending — GPRMLS
- 2026-04-01 Listed $1 GPRMLS
Property tax history
+3.3%/yrLatest (2025): $806 · -10.3% YoY. Source: county tax records.
Cash-flow waterfall
monthlySold comps — $/sqft
last 12 mo · ≤1 miLoading sold comps…