402 2nd St · Summersville, MO
Flood risk No data
- FEMA flood zone
- —
- Chance of flooding over 30 yrs
- —
- Est. flood insurance / yr
- —
Fire risk No data
- Est. fire insurance / yr
- —
Heat risk No data
- Hot days now (above threshold)
- —
- Hot days in 30 yrs
- —
Wind risk No data
- Chance of severe wind over 30 yrs
- —
Air-quality risk No data
- Unhealthy air days now
- —
- Unhealthy air days in 30 yrs
- —
Risk factors via First Street. Map © Google.
Why this score? — see what drove the C+ grade
The composite is a weighted blend of 9 inputs, each scored 0–100. Each bar is that input's sub-score; the figure is the points it added to the 100-point composite (weight × sub-score).
- Cash flow +19.0/30.0
- ARV discount +15.0/15.0
- Appreciation +8.1/10.0
- DSCR +6.0/10.0
- 1% rule +5.1/10.0
- Schools +3.3/10.0
- Livability +2.8/5.0
- Rent growth +2.5/5.0
- Condition / age +2.5/5.0
$85,000
🖨 Deal sheet 📄 Offer letter ✓ Due diligence
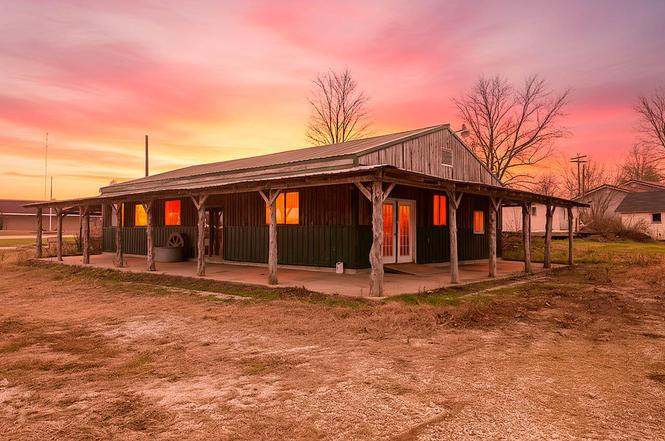
Listing remarks
Unique Country Home with Commercial OpportunityThis truly unique property offers a rare chance to own a space that seamlessly blends residential comfort with commercial potential. Originally built in 2010 as a restaurant, the building has since been converted into a 1-bedroom, 1-bath home, while still easily adaptable back into a restaurant or reimagined for nearly any business concept you can envision. Studio, cafe, boutique, office, short-term rental, or live-work setup, the flexibility here is unmatched. The open floor plan creates a welcoming, functional space with character you will not find anywhere else. A standout feature is the indoor pond water element in the living area, adding a
Key facts
- Covered patios
- 0.31 acre lot
- 4 garage spots
Tags
Neighborhood map
What this means for you Summary
Snapshot
- This is a 1-bed/1.0-bath single-family listed at $85k.
Deal economics
- At list price, monthly cash flow is $89 ($1k/yr) — positive.
- The deal already cash-flows at list — no discount required.
- Meets the 1% rule at list price ($856 rent vs $85k).
- Recommended offer: $77k (9.0% below list) — sets the bar for market timing.
Location & tenants
- Location reads 55/100 on livability (#724 in MO) — a working-class tenant base; expect higher turnover. Strengths: cost of living A+; Watch: crime F, amenities F, commute F.
- Summersville R-II (rural): math 35% / reading 46% proficiency, ranked #163 of 324 in MO (top 50%) — families likely to look elsewhere, expect single-tenant / working-renter base with shorter leases.
- Zoned schools: Summersville Elem. (math 32% / reading 42%, grade F, #611 of 1,115 statewide, top 59%, 224 students, 53% FRL); Summersville High (math 37% / reading 47%, grade F, #218 of 521 statewide, top 45%, 234 students, 37% FRL).
- Market conditions: 32 active listings in the ZIP; 10 units permitted in Texas County in 2024 (5 in 5+ unit buildings).
Forward outlook
- In year one you build about $6k of equity ($588 loan paydown + $5k appreciation (6.2% local appreciation)).
- Texas County population projected at -11% by 2050 — secular population decline; favor cash flow + early exit over multi-decade hold.
- At projected returns (6.2% appreciation + 3.0% rent growth), your $24k cash investment doubles in ~4 years — after that, you're playing with house money.
- By year 6, paydown + projected appreciation supports a ~$32k cash-out refi (75% LTV) — recoverable capital for the next deal without selling this one.
Negotiation context
- It's been on market 91 days — a 9% lower offer ($77k) is reasonable based on typical stale-listing flexibility.
Questions for the listing agent
- It's been on market 91 days. Have you received any prior offers? Is the seller open to a 9% concession, seller financing, or rate buy-down credit?
- Why hasn't it sold? Are there any deal-killer items the seller is aware of (foundation, flood, title, zoning, code violations)?
- Is there a deadline driving the sale (1031 exchange, divorce, estate, relocation)? That informs how much negotiation room exists.
- Crime grade is F in this area — have there been break-ins, vandalism, or insurance claims at this property in the last 3 years? What carrier currently insures it and at what premium?
- What's the average days-on-market for RENTAL listings here right now (not sales)? A rising rental-DOM trend means longer vacancies and softer asking-rent achievability than the comps imply.
- What's the recent tenant-quality profile in this submarket — average credit score on applications, eviction rate, late-payment / NSF rate, and stable-employment percentage? A property-management company in the area should have these aggregated.
- How much new for-sale + rental construction is in the pipeline within 1–3 miles? Heavy new supply typically softens prices + rents 12–24 months out; constrained supply supports both.
Investment metrics
- 1% rule
- 1.01% ✓
- Cap rate
- 7.54%
- Cash-on-cash
- 4.47%
- DSCR
- 1.20
- GRM
- 8.3
CMA / ARV
- ARV (on-the-fly)
- $102,000
- Comps found
- 1
Show comp detail 1 sale within ~0.75 mi
| Address | Dist | Beds/Ba | Sqft | Sold | Price | $/sf | Match |
|---|---|---|---|---|---|---|---|
| 496 Day Ave | 0.18mi | 2/1.0 (+1) | 917 (-8%) | 16mo | $93,500 | $102 | 60 |
Match score weights: distance 35% · size 25% · config 20% · recency 20%. Top-matched comps best support the ARV.
Projected returns pro-forma
6.16% appreciation · 3.0% rent growth · sell at horizon
- IRR
- 19.4%
- Equity multiple
- 2.30×
- Total profit
- $31,003
- Equity at exit
- $54,291
- IRR
- 18.7%
- Equity multiple
- 4.64×
- Total profit
- $86,593
- Equity at exit
- $99,202
Cash invested: $23,800 (down + closing). Projections, not guarantees.
Landlord ↔ Tenant lean methodology
- Overall (STATE)
- 81 Strongly Landlord-Friendly
- State Missouri
- 81 Strongly Landlord-Friendly · R+10
- County
- — inherits STATE
- City
- — inherits STATE
ZIP-level market 65571
- Home prices YoY
- 3.0%
- Active inventory
- 32
- Price-to-rent
- 8.3×
Monthly cashflow live
- Estimated rent
- $856 medium interval (Pro) →
- Mortgage (P&I)
- −$446
- Tax est. 1.5%
- −$106 /mo · $1,275/yr
- Insurance
- −$35
- HOA
- −$0
- Vacancy / Maint / Mgmt
- −$180
- Net cashflow
- $89
Break-even live
UW: 25.0% down · 7.5% · 30yr · 1.5% tax · 5.0% vac · 8.0% maint · 8.0% mgmt
Financing live
Cash to close
- Down payment
- $21,250
- Closing costs
- $2,550
- Reserves months
- —
- Total cash needed
- —
Loan-product check · same deal, 3 products live
Conventional
25% down · 7.5% · 30yr
- Down + closing
- —
- Monthly P&I
- —
- Monthly cashflow
- —
- DSCR
- —
- Eligible?
- —
Personal DTI + credit; lowest rate.
DSCR
20% down · 8.5% · 30yr
- Down + closing
- —
- Monthly P&I
- —
- Monthly cashflow
- —
- DSCR
- —
- Eligible?
- —
No personal income docs; deal must DSCR.
Hard money
10% down · 12.0% · 12mo
- Down + closing
- —
- Monthly P&I
- —
- Monthly cashflow
- —
- DSCR
- —
- Eligible?
- —
Short-term bridge; refi at stabilization.
Listing history 2 events
-
2026-03-18status Pending
-
2025-12-16$85,000 Active
ⓘ Source: listings_history table (triggers on properties + properties_extension) + one-shot
backfill from property_details.listing_events for pre-trigger history.
Nearby sold comps map
Loading sold comps map…
Walkable amenities ~0.75 mi
Loading nearby amenities…
Taxation est. · year 1
- Rental income
- $10,269
- − Mortgage interest
- −$4,761
- − Property taxes
- −$1,275
- − Insurance
- −$425
- − Repairs & maintenance
- −$822
- − Management
- −$822
- − Depreciation
- −$2,473
- Taxable loss
- −$308
- Est. tax savings @ 24.0%
- +$74
- After-tax cash flow
- $1,137/yr
For passive investors: Depreciation is non-cash, so a rental often shows a tax loss while cash-flowing — sheltering income. Rental losses are passive: they offset passive income freely, and up to $25,000/yr can offset ordinary (W-2) income if you actively participate and your MAGI is under $100k (phasing out to $0 by $150k); unused losses carry forward. On sale, claimed depreciation is recaptured at up to 25%, and gains may owe capital-gains tax (a 1031 exchange can defer both). Figures are a year-1 estimate at your 24.0% rate — not tax advice; consult a CPA.
Schools (NCES district)
- District
- Summersville R-II
- NCES district ID
- 2929810
- Math proficiency
- 35% ▼ -8.00%
- Reading proficiency
- 46% ▼ -6.00%
- Median HH income
- $32,220
- Composite
- 33.17/100
- National rank
- #5542
- State rank
- #163 of 324 in MO
Livability — Summersville
- Score
- 55/100
- State rank
- #724
- US rank
- #23102
Category grades
Schools grade is shown separately in the Schools card above.
Census & demographics
- Census place
- Summersville, MO
- Population (ZIP)
- 1,927
Population outlook (Texas County) Hauer SSP2
- Today (2025)
- 24,648 people
- By 2030
- 23,981 · -2.7%
- By 2040
- 22,840 · -7.3%
- By 2050
- 21,832 · -11.4%
- By 2075
- 19,481 · -21.0%
- By 2100
- 16,634 · -32.5%
Race, ethnicity, and origin ACS 2023
- Neighborhood character
- Predominantly White (96%)
- Race & ethnicity
- White 96% Two or more races 4%
- Common ancestry
- Polish 6% Italian 3% Slovak 2%
Political lean MEDSL · Texas
- 2024 margin
- Solid R (+71.7) · D 13.8% · R 85.5%
- 2008→2024 swing
- -36.7pp toward R · 2008: -35.1pp · 2024: -71.7pp
- All cycles
- 2024: R+71.7 2020: R+68.6 2016: R+65.4 2012: R+44.1 2008: R+35.1
Not yet ingested
- Civics
- —
Market trends
- HPI YoY
- ▲ 6.16%
- Current HPI
- 213.3356
- Rent YoY
- —
- Metro
- —
- State GDP YoY
- ▲ 1.84%
- F500 in state
- 20
Industry mix (Fortune 500 HQ in MO)
| Industry | F500 HQs | Revenue |
|---|---|---|
| Healthcare | 1 | $163B |
|
||
| Insurance | 1 | $21B |
|
||
| Industrial Technology | 1 | $17B |
|
||
| Retail | 1 | $16B |
|
||
| Industrial Distribution | 1 | $10B |
|
||
| Utilities | 1 | $9B |
|
||
Price history
2 events — show timeline
- 2026-03-18 Pending — SOMO
- 2025-12-16 Listed $85,000 SOMO
Cash-flow waterfall
monthlySold comps — $/sqft
last 12 mo · ≤1 miLoading sold comps…