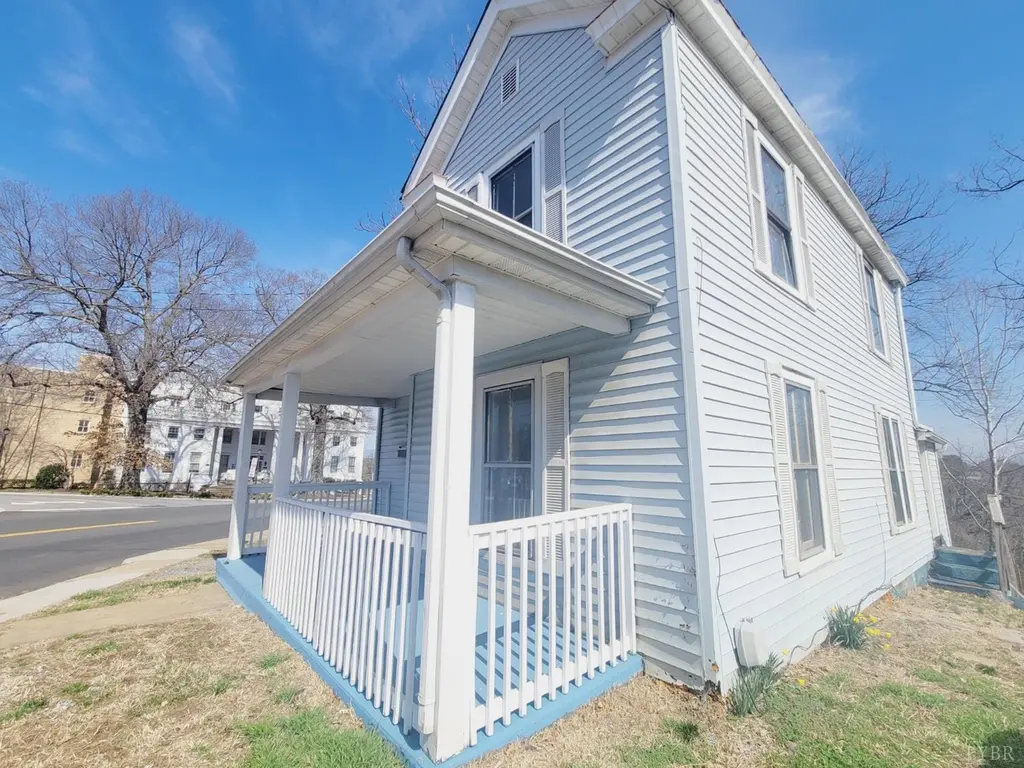
58 Federal St · Lynchburg, VA
Flood risk 1/10 · Minimal
- FEMA flood zone
- X (unshaded)
- Chance of flooding over 30 yrs
- 0.0%
- Est. flood insurance / yr
- $507 – $1,088
Fire risk 2/10 · Minimal
- Est. fire insurance / yr
- $666 – $1,236
Heat risk 6/10 · Moderate
- Hot days now (above 102°F)
- 7 days/yr
- Hot days in 30 yrs
- 18 days/yr
Wind risk 2/10 · Minimal
- Chance of severe wind over 30 yrs
- 3.0%
Air-quality risk 2/10 · Minimal
- Unhealthy air days now
- 0 days/yr
- Unhealthy air days in 30 yrs
- 1 days/yr
Risk factors via First Street. Map © Google.
Why this score? — see what drove the B+ grade
The composite is a weighted blend of 9 inputs, each scored 0–100. Each bar is that input's sub-score; the figure is the points it added to the 100-point composite (weight × sub-score).
- Cash flow +30.0/30.0
- ARV discount +15.0/15.0
- 1% rule +10.0/10.0
- DSCR +10.0/10.0
- Livability +4.5/5.0
- Schools +4.0/10.0
- Rent growth +3.6/5.0
- Condition / age +2.5/5.0
- Appreciation +0.0/10.0
$120,000
🖨 Deal sheet 📄 Offer letter ✓ Due diligence
Listing remarks MLS
Great investment property! Just needs some additional touches and updates. Two story house in the Heart of Lynchburg! Recently painted and updated bathroom and kitchen vinyl. Spacious rooms and original hardwood floors. Eat-in kitchen with washer & dryer hook ups off of the kitchen. A nice sized front porch to relax and enjoy!
Key facts
- Front porch
- Updated kitchen
- Eat-in kitchen
Tags
Neighborhood map
What this means for you Summary
Snapshot
- This is a 7-bed/2.0-bath single-family listed at $120k.
Deal economics
- At list price, monthly cash flow is $707 ($8k/yr) — positive.
- The deal already cash-flows at list — no discount required.
- Meets the 1% rule at list price ($2k rent vs $120k).
- Recommended offer: $109k (9.0% below list) — sets the bar for market timing.
- Cap rate 13.4% vs local median 4.0% in Lynchburg — top-decile yield for the area; either an underpriced asset or a hidden risk that comps aren't pricing in. Stress-test before assuming the spread holds.
Location & tenants
- Location reads 91/100 on livability (#1 in VA, #58 nationally) — a professional / high-income tenant draw. Strengths: amenities A+, commute A+, cost of living A+; Watch: crime C-, employment D+.
- Lynchburg City Public School District (urban): math 36% / reading 61% proficiency, ranked #104 of 131 in VA (top 79%) — families likely to look elsewhere, expect single-tenant / working-renter base with shorter leases; 61% free/reduced lunch — lower-income household profile, screen leases tightly.
- Market conditions: Rents rising fast (+4.6%/yr); 105 active listings in the ZIP; 472 units permitted in Lynchburg city in 2024 (240 in 5+ unit buildings).
- This rent runs 42% of the median local income ($53k/yr) — at the standard rent-burdened threshold; future hikes will face affordability resistance.
Forward outlook
- Local home prices are declining (-3.0%/yr); year-one equity from $830 of loan paydown is wiped out by about $4k of value loss. Plan a longer hold.
- Lynchburg County population projected at +37% by 2050 — long-run rental-demand tailwind backs the buy-and-hold thesis.
- At projected returns (-3.0% appreciation + 4.6% rent growth), your $34k cash investment doubles in ~5 years — after that, you're playing with house money.
Negotiation context
- It's been on market 105 days — a 9% lower offer ($109k) is reasonable based on typical stale-listing flexibility.
- 4 sale attempts since 12y ago; this cycle's ask has dropped $29k (19%) from the opening price — seller is motivated, your offer sets the floor, not the list.
- Current owner paid $26k; list at $120k implies a 362% gain — meaningful room to come down on a strong offer.
Risks & watch-outs
- Watch-outs: built in 1906 — expect roof / HVAC / electrical / plumbing capex.
- Climate carrying-cost: extreme-heat days projected 7→18/yr by 2055 (HVAC capex compounding) — expect insurance premiums to compound above CPI over the hold.
Questions for the listing agent
- It's been on market 105 days. Have you received any prior offers? Is the seller open to a 9% concession, seller financing, or rate buy-down credit?
- Built in 1906 — when were the roof, HVAC, electrical panel, plumbing, and water heater last replaced?
- Why hasn't it sold? Are there any deal-killer items the seller is aware of (foundation, flood, title, zoning, code violations)?
- Is there a deadline driving the sale (1031 exchange, divorce, estate, relocation)? That informs how much negotiation room exists.
- Schools are A-rated — typically a magnet for longer-tenancy family renters. What's the average tenant stay here, and is there a school-zone premium baked into asking?
- What's the average days-on-market for RENTAL listings here right now (not sales)? A rising rental-DOM trend means longer vacancies and softer asking-rent achievability than the comps imply.
- What's the recent tenant-quality profile in this submarket — average credit score on applications, eviction rate, late-payment / NSF rate, and stable-employment percentage? A property-management company in the area should have these aggregated.
- How much new for-sale + rental construction is in the pipeline within 1–3 miles? Heavy new supply typically softens prices + rents 12–24 months out; constrained supply supports both.
Investment metrics
- 1% rule
- 1.53% ✓
- Cap rate
- 13.36%
- Cash-on-cash
- 25.25%
- DSCR
- 2.12
- GRM
- 5.5
CMA / ARV
- ARV (median comp)
- $150,932
- List price
- $120,000
- Delta
- -20.49%
- Verdict
- UNDERPRICED
- Comps
- 20 within 1.0 mi
Projected returns pro-forma
-3.0% appreciation · 4.56% rent growth · sell at horizon
- IRR
- 20.4%
- Equity multiple
- 1.85×
- Total profit
- $28,477
- Equity at exit
- $17,892
- IRR
- 29.6%
- Equity multiple
- 3.83×
- Total profit
- $95,046
- Equity at exit
- $10,375
Cash invested: $33,600 (down + closing). Projections, not guarantees.
Landlord ↔ Tenant lean methodology
- Overall (STATE)
- 55 Moderately Landlord-Leaning
- State Virginia
- 55 Moderately Landlord-Leaning · D+2
- County
- — inherits STATE
- City
- — inherits STATE
ZIP-level market 24504
- Home prices YoY
- -12.7%
- Rents YoY
- 4.6%
- Active inventory
- 105
- Price-to-rent
- 5.5×
Monthly cashflow live
- Estimated rent
- $1,833 medium interval (Pro) →
- Mortgage (P&I)
- −$629
- Tax from tax record
- −$62 /mo · $741/yr
- Insurance
- −$50
- HOA
- −$0
- Vacancy / Maint / Mgmt
- −$385
- Net cashflow
- $707
Break-even live
UW: 25.0% down · 7.5% · 30yr · 1.5% tax · 5.0% vac · 8.0% maint · 8.0% mgmt
Financing live
Cash to close
- Down payment
- $30,000
- Closing costs
- $3,600
- Reserves months
- —
- Total cash needed
- —
Loan-product check · same deal, 3 products live
Conventional
25% down · 7.5% · 30yr
- Down + closing
- —
- Monthly P&I
- —
- Monthly cashflow
- —
- DSCR
- —
- Eligible?
- —
Personal DTI + credit; lowest rate.
DSCR
20% down · 8.5% · 30yr
- Down + closing
- —
- Monthly P&I
- —
- Monthly cashflow
- —
- DSCR
- —
- Eligible?
- —
No personal income docs; deal must DSCR.
Hard money
10% down · 12.0% · 12mo
- Down + closing
- —
- Monthly P&I
- —
- Monthly cashflow
- —
- DSCR
- —
- Eligible?
- —
Short-term bridge; refi at stabilization.
Listing history 26 events
-
2026-06-19days on market $120,000 Active 105 DOM
-
2026-06-18days on market $120,000 Active 104 DOM
-
2026-06-17days on market $120,000 Active 103 DOM
-
2026-06-16days on market $120,000 Active 102 DOM
-
2026-06-15days on market $120,000 Active 101 DOM
-
2026-06-14days on market $120,000 Active 99 DOM
-
2026-06-13days on market $120,000 Active 98 DOM
-
2026-06-10days on market $120,000 Active 96 DOM
-
2026-06-09days on market $120,000 Active 95 DOM
-
2026-06-09price $120,000 Active 94 DOM
-
2026-06-08days on market $130,000 Active 94 DOM
-
2026-06-07days on market $130,000 Active 93 DOM
-
2026-06-03days on market $130,000 Active 89 DOM
-
2026-06-02days on market $130,000 Active 88 DOM
-
2026-06-01days on market $130,000 Active 87 DOM
-
2026-05-31days on market $130,000 Active 86 DOM
-
2026-05-30days on market $130,000 Active 85 DOM
-
2026-05-08price $130,000 334-char remark
Show marketing remark (334 chars)
Great investment property! Just needs some additional touches and updates. Two story house in the Heart of Lynchburg! Recently painted and updated bathroom and kitchen vinyl. Spacious rooms and original hardwood floors. Eat-in kitchen with washer & dryer hook ups off of the kitchen. A nice sized front porch to relax and enjoy!
-
2026-03-06$149,000 Active 334-char remark
Show marketing remark (334 chars)
Great investment property! Just needs some additional touches and updates. Two story house in the Heart of Lynchburg! Recently painted and updated bathroom and kitchen vinyl. Spacious rooms and original hardwood floors. Eat-in kitchen with washer & dryer hook ups off of the kitchen. A nice sized front porch to relax and enjoy!
-
2019-01-22soldstatus $26,000 426-char remark
Show marketing remark (426 chars)
Spacious home conveniently located near downtown Lynchburg. This home offers vinyl siding, hardwood floors, ceramic tiled kitchen, a main level den, and main level laundry room. Two generous upstairs bedrooms and another small room that would make a great nursery or office. Some new plumbing and electrical work has already been installed. With some TLC this could make a great family home or investment property! Call today!
-
2018-05-15$29,900 426-char remark
Show marketing remark (426 chars)
Spacious home conveniently located near downtown Lynchburg. This home offers vinyl siding, hardwood floors, ceramic tiled kitchen, a main level den, and main level laundry room. Two generous upstairs bedrooms and another small room that would make a great nursery or office. Some new plumbing and electrical work has already been installed. With some TLC this could make a great family home or investment property! Call today!
-
2015-05-06$59,900
-
2015-01-30soldstatus $21,000
-
2014-11-24$25,000
-
2007-02-27soldstatus $81,000
-
2001-08-03soldstatus $9,500
ⓘ Source: listings_history table (triggers on properties + properties_extension) + one-shot
backfill from property_details.listing_events for pre-trigger history.
Tax reassessment forecast VA · Resets to sale price
- Current annual tax
- $741 · $62/mo
- Projected year-2 tax
- $984 · $82/mo
- Expected delta
- +$243/yr (+$20/mo · 32.8%)
ⓘ Screening estimate from a state-policy table — verify with the county assessor before closing.
Climate risk First Street
- Flood 1/10 Low FEMA zone X (unshaded) · 0% chance over 30 yrs
- Wildfire 2/10 Low
- Heat 6/10 Major 7 d/yr ≥102°F today · 18 d/yr by 30 yrs out
- Wind 2/10 Low 3% chance of damaging wind over 30 yrs
- Air quality 2/10 Low 0 unhealthy d/yr today · 1 by 30 yrs out
Nearby sold comps map
Loading sold comps map…
Walkable amenities ~0.75 mi
Loading nearby amenities…
Taxation est. · year 1
- Rental income
- $21,995
- − Mortgage interest
- −$6,722
- − Property taxes
- −$741
- − Insurance
- −$600
- − Repairs & maintenance
- −$1,760
- − Management
- −$1,760
- − Depreciation
- −$3,491
- Taxable income
- $6,922
- Est. tax owed @ 24.0%
- −$1,661
- After-tax cash flow
- $6,822/yr
For passive investors: Depreciation is non-cash, so a rental often shows a tax loss while cash-flowing — sheltering income. Rental losses are passive: they offset passive income freely, and up to $25,000/yr can offset ordinary (W-2) income if you actively participate and your MAGI is under $100k (phasing out to $0 by $150k); unused losses carry forward. On sale, claimed depreciation is recaptured at up to 25%, and gains may owe capital-gains tax (a 1031 exchange can defer both). Figures are a year-1 estimate at your 24.0% rate — not tax advice; consult a CPA.
Schools (NCES district)
- District
- Lynchburg City Public School District
- NCES district ID
- 5102340
- Math proficiency
- 36% ▼ -38.00%
- Reading proficiency
- 61% ▼ -8.00%
- Median HH income
- $39,097
- Composite
- 40.4/100
- National rank
- #3730
- State rank
- #104 of 131 in VA
Livability — Lynchburg
- Score
- 91/100
- State rank
- #1
- US rank
- #58
Category grades
Schools grade is shown separately in the Schools card above.
Census & demographics
- Census place
- Lynchburg, VA
- County
- Lynchburg City · 97,036 people
- City population
- 97,036
- Metro
- Lynchburg, VA
- Population (ZIP)
- 9,632
- Household income
- $52,571
- Rent vs Own
- Severe rent burden
- 552.0
Population outlook (Lynchburg County) Hauer SSP2
- Today (2025)
- 87,977 people
- By 2030
- 93,626 · +6.4%
- By 2040
- 106,145 · +20.7%
- By 2050
- 120,783 · +37.3%
- By 2075
- 162,249 · +84.4%
- By 2100
- 191,358 · +117.5%
Race, ethnicity, and origin ACS 2023
- Neighborhood character
- Diverse neighborhood (Simpson 0.57)
- Race & ethnicity
- White 51% Black 40% Two or more races 6% Hispanic / Latino 4%
- Common ancestry
- Italian 3% Lithuanian 1% Serbian 1%
- Foreign-born
- 4% · Canada, China
- Languages at home
- 95% English-only · Spanish 3% Chinese 1%
Political lean MEDSL · Lynchburg
- 2024 margin
- Lean R (+7.9) · D 45.4% · R 53.3% · Other 1.3%
- 2008→2024 swing
- -3.9pp toward R · 2008: -4.0pp · 2024: -7.9pp
- All cycles
- 2024: R+7.9 2020: D+2.6 2016: R+9.0 2012: R+10.6 2008: R+4.0
Not yet ingested
- Civics
- —
Market trends
- HPI YoY
- ▼ -33.39%
- Current HPI
- 229.4423
- Rent YoY
- ▲ 4.56%
- Metro
- Lynchburg, VA
- State GDP YoY
- ▲ 2.40%
- F500 in state
- 50
Industry mix (Fortune 500 HQ in VA)
| Industry | F500 HQs | Revenue |
|---|---|---|
| Aerospace / Defense | 4 | $236B |
|
||
| Technology / Defense | 3 | $32B |
|
||
| Financial Services | 2 | $176B |
|
||
| Utilities | 2 | $27B |
|
||
| Insurance | 2 | $25B |
|
||
| Technology | 2 | $15B |
|
||
Price history
+1268.4% since first listed9 events — show timeline
- 2026-05-08 Price Changed $130,000 LMLS
- 2026-03-06 Listed $149,000 LMLS
- 2019-01-22 Sold (MLS) $26,000 LMLS
- 2018-05-15 Listed $29,900 LMLS
- 2015-05-06 Listed $59,900 LMLS
- 2015-01-30 Sold (MLS) $21,000 LMLS
- 2014-11-24 Listed $25,000 LMLS
- 2007-02-27 Sold (Public Records) $81,000 Public Records
- 2001-08-03 Sold (Public Records) $9,500 Public Records
Property tax history
+12.1%/yrLatest (2025): $741 · +96.8% YoY. Source: county tax records.
Cash-flow waterfall
monthlySold comps — $/sqft
last 12 mo · ≤1 miLoading sold comps…