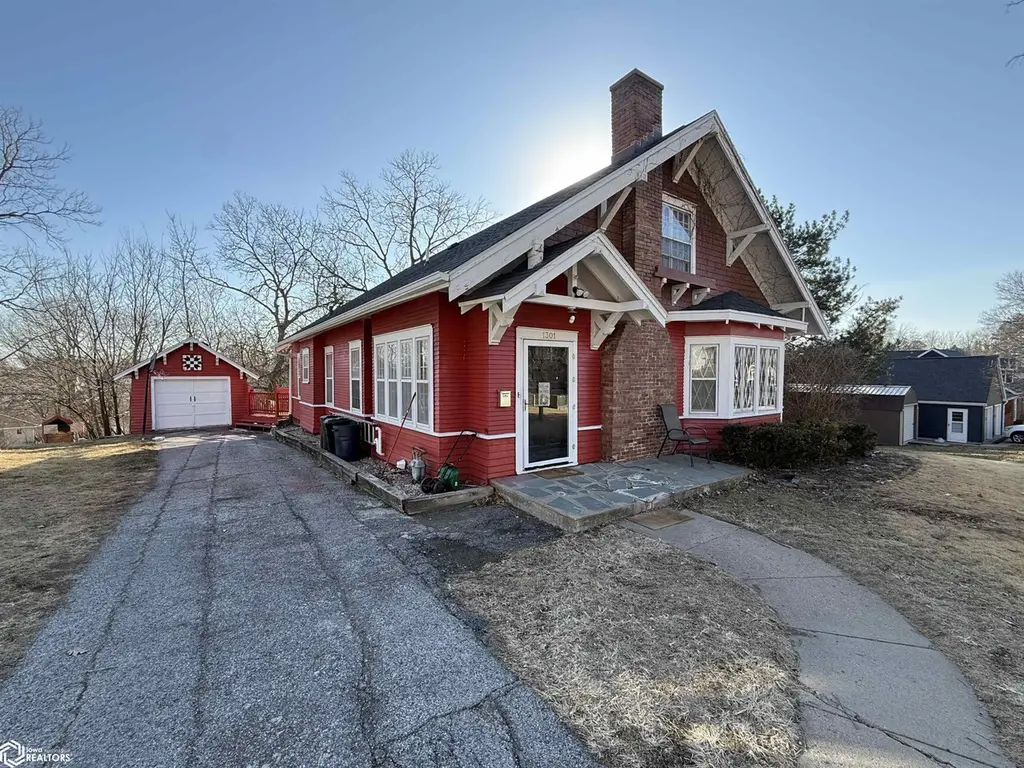
1301 Baldwin St · Harlan, IA
Flood risk 1/10 · Minimal
- FEMA flood zone
- X (unshaded)
- Chance of flooding over 30 yrs
- 0.0%
- Est. flood insurance / yr
- $473 – $860
Fire risk 1/10 · Minimal
- Est. fire insurance / yr
- $902 – $1,676
Heat risk 3/10 · Minor
- Hot days now (above 103°F)
- 7 days/yr
- Hot days in 30 yrs
- 15 days/yr
Wind risk 2/10 · Minimal
- Chance of severe wind over 30 yrs
- —
Air-quality risk 1/10 · Minimal
- Unhealthy air days now
- 0 days/yr
- Unhealthy air days in 30 yrs
- 0 days/yr
Risk factors via First Street. Map © Google.
Why this score? — see what drove the D grade
The composite is a weighted blend of 9 inputs, each scored 0–100. Each bar is that input's sub-score; the figure is the points it added to the 100-point composite (weight × sub-score).
- ARV discount +15.0/15.0
- Cash flow +8.5/30.0
- Schools +6.3/10.0
- Livability +4.0/5.0
- 1% rule +3.0/10.0
- Rent growth +2.5/5.0
- Condition / age +2.5/5.0
- DSCR +2.3/10.0
- Appreciation +0.0/10.0
$190,000
🖨 Deal sheet (PDF) 📄 Offer letter ✓ Due diligence
Listing remarks MLS
We can't wait for you to see the charm & character this Cape Code style home has to offer. With 3,280 finished square feet among the 3 levels, this 5 bed, 3 bath home is ready for its next owner to put their customized TLC on it. This home offers new exterior paint, a new roof, new Thrasher's waterproofing. .. full walkout basement in a great neighborhood. The laundry can be on the main level or the lower level. The wood burning fireplace sets the tone with the gorgeous woodwork finishes and hardwood floors throughout. The owners are excited to pass this home on to the next owners!
Key facts
- Cape code style
- New exterior paint
- New roof
Tags
Neighborhood map
What this means for you Summary
Snapshot
- This is a 6-bed/3.0-bath single-family listed at $190k.
Deal economics
- At list price, monthly cash flow is $-165 ($-2k/yr) — negative.
- To cash-flow at today's rent, offer at most $161k (15.4% below list).
- To meet the 1% rule (rent ≥ 1% of price), the offer needs to be $153k (19.6% below list).
- Recommended offer: $153k (19.6% below list) — sets the bar for 1% rule.
- Cap rate 5.2% vs local median 4.0% in Harlan — top-decile yield for the area; either an underpriced asset or a hidden risk that comps aren't pricing in. Stress-test before assuming the spread holds.
Location & tenants
- Location reads 80/100 on livability (#79 in IA, #1,656 nationally) — a professional / high-income tenant draw. Strengths: cost of living A+, housing A+, health & safety A+; Watch: employment D+, amenities F, commute F.
- Harlan Community School District (town): math 72% / reading 77% proficiency, ranked #81 of 289 in IA (top 28%) — strong family-tenant draw, lease renewals of 3-5y typical.
- Zoned schools: Harlan Primary (369 students, 44% FRL); Harlan Community Middle School (math 70% / reading 81%, grade A, #65 of 246 statewide, top 29%, 342 students, 36% FRL); Harlan High School (math 77% / reading 82%, grade A-, #34 of 336 statewide, top 14%, 477 students, 31% FRL).
- Market conditions: 35 active listings in the ZIP; 8 units permitted in Shelby County in 2024 (0 in 5+ unit buildings).
Forward outlook
- Local home prices are declining (-3.0%/yr); year-one equity from $1k of loan paydown is wiped out by about $6k of value loss. Plan a longer hold.
- Shelby County population projected to shrink 7% by 2050 — rents likely to lag national; underwrite the cash flow, not the appreciation.
Negotiation context
- It's been on market 114 days — a 9% lower offer ($173k) is reasonable based on typical stale-listing flexibility.
- Current owner paid $118k; list at $190k implies a 61% gain — meaningful room to come down on a strong offer.
Risks & watch-outs
- Watch-outs: built in 1912 — expect roof / HVAC / electrical / plumbing capex.
Questions for the listing agent
- What do current leases actually rent for vs. the listed asking? Can we see a recent rent roll and the last 12 months of T-12 income?
- It's been on market 114 days. Have you received any prior offers? Is the seller open to a 20% concession, seller financing, or rate buy-down credit?
- Built in 1912 — when were the roof, HVAC, electrical panel, plumbing, and water heater last replaced?
- Why hasn't it sold? Are there any deal-killer items the seller is aware of (foundation, flood, title, zoning, code violations)?
- Is there a deadline driving the sale (1031 exchange, divorce, estate, relocation)? That informs how much negotiation room exists.
- Schools are A-rated — typically a magnet for longer-tenancy family renters. What's the average tenant stay here, and is there a school-zone premium baked into asking?
- The area grade is low — what's the realistic commute time and amenity access for the typical tenant pool here? Any planned neighborhood developments (good or bad) we should know about?
- What's the average days-on-market for RENTAL listings here right now (not sales)? A rising rental-DOM trend means longer vacancies and softer asking-rent achievability than the comps imply.
- What's the recent tenant-quality profile in this submarket — average credit score on applications, eviction rate, late-payment / NSF rate, and stable-employment percentage? A property-management company in the area should have these aggregated.
- How much new for-sale + rental construction is in the pipeline within 1–3 miles? Heavy new supply typically softens prices + rents 12–24 months out; constrained supply supports both.
Investment metrics
- 1% rule
- 0.80% ✗
- Cap rate
- 5.25%
- Cash-on-cash
- -3.73%
- DSCR
- 0.83
- GRM
- 10.4
CMA / ARV
- ARV (median comp)
- $233,986
- List price
- $190,000
- Delta
- -18.80%
- Verdict
- UNDERPRICED
- Comps
- 17 within 1.0 mi
Projected returns pro-forma
-3.0% appreciation · 3.0% rent growth · sell at horizon
- IRR
- -22.5%
- Equity multiple
- 0.22×
- Total profit
- $-41,260
- Equity at exit
- $28,330
- IRR
- -16.6%
- Equity multiple
- 0.07×
- Total profit
- $-49,247
- Equity at exit
- $16,428
Cash invested: $53,200 (down + closing). Projections, not guarantees.
Landlord ↔ Tenant lean methodology
- Overall (STATE)
- 83 Strongly Landlord-Friendly
- State Iowa
- 83 Strongly Landlord-Friendly · R+6
- County
- — inherits STATE
- City
- — inherits STATE
ZIP-level market 51537
- Home prices YoY
- -26.9%
- Active inventory
- 35
- Price-to-rent
- 10.4×
Monthly cashflow live
- Estimated rent
- $1,528 medium interval (Pro) →
- Mortgage (P&I)
- −$996
- Tax from tax record
- −$297 /mo · $3,566/yr
- Insurance
- −$79
- HOA
- −$0
- Vacancy / Maint / Mgmt
- −$321
- Net cashflow
- $-165
Break-even live
Sensitivity live
| Price | -10% $-58 | -5% $-112 | +0% $-165 | +5% $-219 | +10% $-273 |
|---|---|---|---|---|---|
| Rent | -10% $-286 | -5% $-226 | +0% $-165 | +5% $-105 | +10% $-45 |
| Rate | -1.0pp $-70 | -0.5pp $-117 | base $-165 | +0.5pp $-215 | +1.0pp $-265 |
UW: 25.0% down · 7.5% · 30yr · 1.5% tax · 5.0% vac · 8.0% maint · 8.0% mgmt
Financing live
Cash to close
- Down payment
- $47,500
- Closing costs
- $5,700
- Reserves months
- —
- Total cash needed
- —
Loan-product check · same deal, 3 products live
Conventional
25% down · 7.5% · 30yr
- Down + closing
- —
- Monthly P&I
- —
- Monthly cashflow
- —
- DSCR
- —
- Eligible?
- —
Personal DTI + credit; lowest rate.
DSCR
20% down · 8.5% · 30yr
- Down + closing
- —
- Monthly P&I
- —
- Monthly cashflow
- —
- DSCR
- —
- Eligible?
- —
No personal income docs; deal must DSCR.
Hard money
10% down · 12.0% · 12mo
- Down + closing
- —
- Monthly P&I
- —
- Monthly cashflow
- —
- DSCR
- —
- Eligible?
- —
Short-term bridge; refi at stabilization.
Listing history 14 events
-
2026-06-12days on market $190,000 Active 114 DOM
-
2026-06-09days on market $190,000 Active 111 DOM
-
2026-06-08days on market $190,000 Active 110 DOM
-
2026-06-07days on market $190,000 Active 109 DOM
-
2026-06-05days on market $190,000 Active 107 DOM
-
2026-06-04days on market $190,000 Active 105 DOM
-
2026-06-02days on market $190,000 Active 104 DOM
-
2026-06-01status $190,000 Active 103 DOM
-
2026-05-07price $190,000 594-char remark
Show marketing remark (594 chars)
We can't wait for you to see the charm & character this Cape Code style home has to offer. With 3,280 finished square feet among the 3 levels, this 5 bed, 3 bath home is ready for its next owner to put their customized TLC on it. This home offers new exterior paint, a new roof, new Thrasher's waterproofing. .. full walkout basement in a great neighborhood. The laundry can be on the main level or the lower level. The wood burning fireplace sets the tone with the gorgeous woodwork finishes and hardwood floors throughout. The owners are excited to pass this home on to the next owners!
-
2026-04-15price $200,000 594-char remark
Show marketing remark (594 chars)
We can't wait for you to see the charm & character this Cape Code style home has to offer. With 3,280 finished square feet among the 3 levels, this 5 bed, 3 bath home is ready for its next owner to put their customized TLC on it. This home offers new exterior paint, a new roof, new Thrasher's waterproofing. .. full walkout basement in a great neighborhood. The laundry can be on the main level or the lower level. The wood burning fireplace sets the tone with the gorgeous woodwork finishes and hardwood floors throughout. The owners are excited to pass this home on to the next owners!
-
2026-03-29price $205,000 594-char remark
Show marketing remark (594 chars)
We can't wait for you to see the charm & character this Cape Code style home has to offer. With 3,280 finished square feet among the 3 levels, this 5 bed, 3 bath home is ready for its next owner to put their customized TLC on it. This home offers new exterior paint, a new roof, new Thrasher's waterproofing. .. full walkout basement in a great neighborhood. The laundry can be on the main level or the lower level. The wood burning fireplace sets the tone with the gorgeous woodwork finishes and hardwood floors throughout. The owners are excited to pass this home on to the next owners!
-
2026-03-10price $225,000 594-char remark
Show marketing remark (594 chars)
We can't wait for you to see the charm & character this Cape Code style home has to offer. With 3,280 finished square feet among the 3 levels, this 5 bed, 3 bath home is ready for its next owner to put their customized TLC on it. This home offers new exterior paint, a new roof, new Thrasher's waterproofing. .. full walkout basement in a great neighborhood. The laundry can be on the main level or the lower level. The wood burning fireplace sets the tone with the gorgeous woodwork finishes and hardwood floors throughout. The owners are excited to pass this home on to the next owners!
-
2026-02-13$235,000 Active 594-char remark
Show marketing remark (594 chars)
We can't wait for you to see the charm & character this Cape Code style home has to offer. With 3,280 finished square feet among the 3 levels, this 5 bed, 3 bath home is ready for its next owner to put their customized TLC on it. This home offers new exterior paint, a new roof, new Thrasher's waterproofing. .. full walkout basement in a great neighborhood. The laundry can be on the main level or the lower level. The wood burning fireplace sets the tone with the gorgeous woodwork finishes and hardwood floors throughout. The owners are excited to pass this home on to the next owners!
-
2008-10-24soldstatus $118,000
ⓘ Source: listings_history table (triggers on properties + properties_extension) + one-shot
backfill from property_details.listing_events for pre-trigger history.
Tax reassessment forecast IA · Partial reset (capped growth)
- Current annual tax
- $3,566 · $297/mo
- Projected year-2 tax
- $3,566 · $297/mo
- Expected delta
- $0/yr ($0/mo · 0.0%)
ⓘ Screening estimate from a state-policy table — verify with the county assessor before closing.
Climate risk First Street
- Flood 1/10 Low FEMA zone X (unshaded) · 0% chance over 30 yrs
- Wildfire 1/10 Low
- Heat 3/10 Moderate 7 d/yr ≥103°F today · 15 d/yr by 30 yrs out
- Wind 2/10 Low
- Air quality 1/10 Low 0 unhealthy d/yr today · 0 by 30 yrs out
Nearby sold comps map
Loading sold comps map…
Walkable amenities ~0.75 mi
Loading nearby amenities…
Taxation est. · year 1
- Rental income
- $18,340
- − Mortgage interest
- −$10,643
- − Property taxes
- −$3,566
- − Insurance
- −$950
- − Repairs & maintenance
- −$1,467
- − Management
- −$1,467
- − Depreciation
- −$5,527
- Taxable loss
- −$5,281
- Est. tax savings @ 24.0%
- +$1,267
- After-tax cash flow
- $-717/yr
For passive investors: Depreciation is non-cash, so a rental often shows a tax loss while cash-flowing — sheltering income. Rental losses are passive: they offset passive income freely, and up to $25,000/yr can offset ordinary (W-2) income if you actively participate and your MAGI is under $100k (phasing out to $0 by $150k); unused losses carry forward. On sale, claimed depreciation is recaptured at up to 25%, and gains may owe capital-gains tax (a 1031 exchange can defer both). Figures are a year-1 estimate at your 24.0% rate — not tax advice; consult a CPA.
Schools (NCES district)
- District
- Harlan Community School District
- NCES district ID
- 1913500
- Math proficiency
- 72% ▼ -7.00%
- Reading proficiency
- 77% ▼ -3.00%
- Median HH income
- $48,557
- Composite
- 62.95/100
- National rank
- #656
- State rank
- #81 of 289 in IA
Livability — Harlan
- Score
- 80/100
- State rank
- #79
- US rank
- #1656
Category grades
Schools grade is shown separately in the Schools card above.
Census & demographics
- Census place
- Harlan, IA
- Population (ZIP)
- 6,480
Population outlook (Shelby County) Hauer SSP2
- Today (2025)
- 11,637 people
- By 2030
- 11,472 · -1.4%
- By 2040
- 11,146 · -4.2%
- By 2050
- 10,791 · -7.3%
- By 2075
- 10,601 · -8.9%
- By 2100
- 10,338 · -11.2%
Race, ethnicity, and origin ACS 2023
- Neighborhood character
- Predominantly White (91%)
- Race & ethnicity
- White 91% Two or more races 5% Hispanic / Latino 3%
- Common ancestry
- Portuguese 3% Lithuanian 3% Iranian 2%
- Foreign-born
- 2% · Canada
- Languages at home
- 98% English-only · Spanish 2%
Political lean MEDSL · Shelby
- 2024 margin
- Solid R (+43.0) · D 27.9% · R 70.9% · Other 1.2%
- 2008→2024 swing
- -33.3pp toward R · 2008: -9.7pp · 2024: -43.0pp
- All cycles
- 2024: R+43.0 2020: R+40.3 2016: R+42.9 2012: R+22.2 2008: R+9.7
Not yet ingested
- Civics
- —
Market trends
- HPI YoY
- ▼ -77.04%
- Current HPI
- 209.5911
- Rent YoY
- —
- Metro
- —
- State GDP YoY
- ▲ 2.48%
- F500 in state
- 4
Industry mix (Fortune 500 HQ in IA)
| Industry | F500 HQs | Revenue |
|---|---|---|
| Financial Services | 1 | $16B |
|
||
| Retail / Convenience | 1 | $15B |
|
||
Price history
+61.0% since first listed6 events — show timeline
- 2026-05-07 Price Changed $190,000 IAR
- 2026-04-15 Price Changed $200,000 IAR
- 2026-03-29 Price Changed $205,000 IAR
- 2026-03-10 Price Changed $225,000 IAR
- 2026-02-13 Listed $235,000 IAR
- 2008-10-24 Sold (Public Records) $118,000 Public Records
Property tax history
+3.3%/yrLatest (2025): $3,566 · +3.2% YoY. Source: county tax records.
Cash-flow waterfall
monthlySold comps — $/sqft
last 12 mo · ≤1 miLoading sold comps…