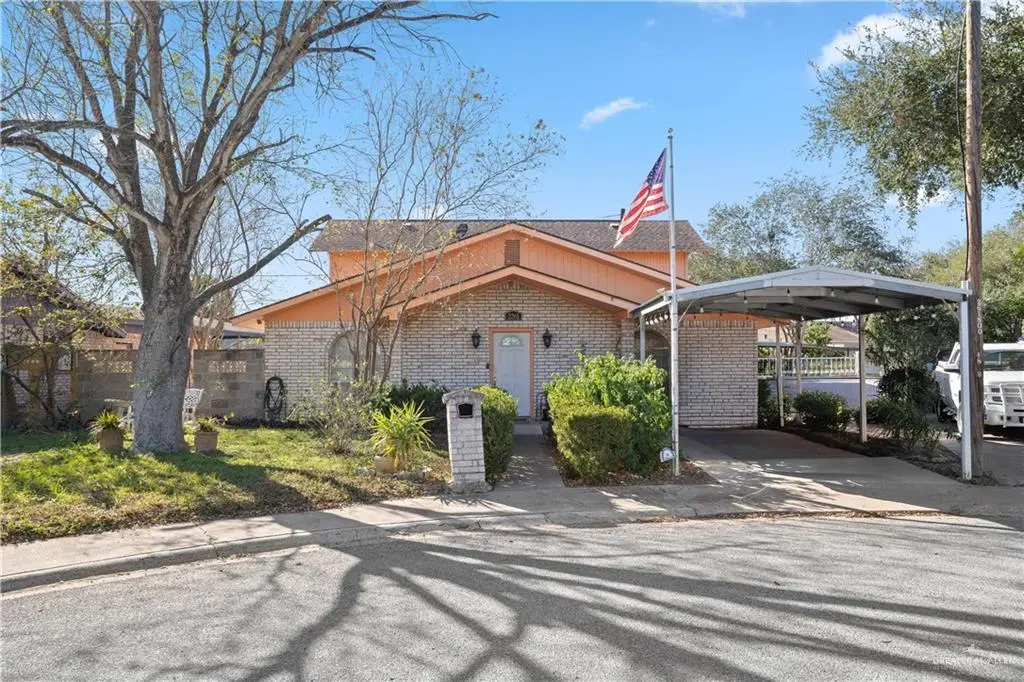
2201 N C St · McAllen, TX
Flood risk 1/10 · Minimal
- FEMA flood zone
- X (shaded)
- Chance of flooding over 30 yrs
- 0.0%
- Est. flood insurance / yr
- $507 – $1,088
Fire risk 1/10 · Minimal
- Est. fire insurance / yr
- $1,222 – $2,270
Heat risk 9/10 · Severe
- Hot days now (above 111°F)
- 7 days/yr
- Hot days in 30 yrs
- 22 days/yr
Wind risk 8/10 · Major
- Chance of severe wind over 30 yrs
- 99.0%
Air-quality risk 3/10 · Minor
- Unhealthy air days now
- 1 days/yr
- Unhealthy air days in 30 yrs
- 4 days/yr
Risk factors via First Street. Map © Google.
Why this score? — see what drove the C- grade
The composite is a weighted blend of 9 inputs, each scored 0–100. Each bar is that input's sub-score; the figure is the points it added to the 100-point composite (weight × sub-score).
- Cash flow +15.4/30.0
- ARV discount +15.0/15.0
- DSCR +4.7/10.0
- 1% rule +4.4/10.0
- Livability +3.8/5.0
- Schools +3.3/10.0
- Rent growth +2.9/5.0
- Condition / age +2.5/5.0
- Appreciation +0.0/10.0
$198,500
🖨 Deal sheet 📄 Offer letter ✓ Due diligence
Listing remarks MLS
Charming fixer-upper with incredible potential, perfect for a first-time home buyer or investor! Ideally located in a highly desirable area of McAllen, this home offers convenience and opportunity all in one. Enjoy close proximity to popular restaurants, shopping centers, schools, parks, and local businesses—everything you need just minutes away. With a little vision and TLC, this property can truly shine and become the perfect place to call home. Don’t miss out on this great opportunity.
Key facts
- 6,882 sq ft lot
- 2 garage spots
- Built 1976
Tags
Neighborhood map
What this means for you Summary
Snapshot
- This is a 4-bed/2.0-bath single-family listed at $198k.
Deal economics
- At list price, monthly cash flow is $75 ($902/yr) — positive.
- The deal already cash-flows at list — no discount required.
- To meet the 1% rule (rent ≥ 1% of price), the offer needs to be $187k (5.9% below list).
- Recommended offer: $181k (9.0% below list) — sets the bar for market timing.
- Cap rate 6.7% vs local median 3.7% in McAllen — top-decile yield for the area; either an underpriced asset or a hidden risk that comps aren't pricing in. Stress-test before assuming the spread holds.
Location & tenants
- Location reads 76/100 on livability (#119 in TX, #3,771 nationally) — a middle-class / working-renter tenant base. Strengths: cost of living A+, housing A+, health & safety A+; Watch: employment D, amenities F, commute F.
- Mcallen ISD (urban): math 34% / reading 45% proficiency, ranked #440 of 826 in TX (top 53%) — families likely to look elsewhere, expect single-tenant / working-renter base with shorter leases.
- Market conditions: Rents rising (+1.8%/yr); 385 active listings in the ZIP; 21 comparable units currently listed for rent nearby; rentals lingering (median 44d on market — plan ~5-8 weeks vacancy on turnover, expect pricing pressure); 57% of comp listings sitting > 30 days — soft ceiling on asking rent; 7,378 units permitted in Hidalgo County in 2024 (641 in 5+ unit buildings).
- At $1,868/mo this rent would consume 47% of the median local household income ($48k/yr) (locally 3043% of renters already pay >50% of income on rent) — very limited rent-growth headroom before tenants either downsize or default.
Forward outlook
- Local home prices are declining (-3.0%/yr); year-one equity from $1k of loan paydown is wiped out by about $6k of value loss. Plan a longer hold.
- Hidalgo County population projected at +28% by 2050 — long-run rental-demand tailwind backs the buy-and-hold thesis.
Negotiation context
- It's been on market 101 days — a 9% lower offer ($181k) is reasonable based on typical stale-listing flexibility.
Risks & watch-outs
- Climate carrying-cost: severe wind risk, 99% chance of damaging wind over 30y; extreme-heat days projected 7→22/yr by 2055 (HVAC capex compounding) — expect insurance premiums to compound above CPI over the hold.
Questions for the listing agent
- It's been on market 101 days. Have you received any prior offers? Is the seller open to a 9% concession, seller financing, or rate buy-down credit?
- Built in 1976 — when were the roof, HVAC, electrical panel, plumbing, and water heater last replaced?
- Why hasn't it sold? Are there any deal-killer items the seller is aware of (foundation, flood, title, zoning, code violations)?
- Is there a deadline driving the sale (1031 exchange, divorce, estate, relocation)? That informs how much negotiation room exists.
- Schools are B-rated — typically a magnet for longer-tenancy family renters. What's the average tenant stay here, and is there a school-zone premium baked into asking?
- What's the average days-on-market for RENTAL listings here right now (not sales)? A rising rental-DOM trend means longer vacancies and softer asking-rent achievability than the comps imply.
- What's the recent tenant-quality profile in this submarket — average credit score on applications, eviction rate, late-payment / NSF rate, and stable-employment percentage? A property-management company in the area should have these aggregated.
- How much new for-sale + rental construction is in the pipeline within 1–3 miles? Heavy new supply typically softens prices + rents 12–24 months out; constrained supply supports both.
Investment metrics
- 1% rule
- 0.94% ✗
- Cap rate
- 6.75%
- Cash-on-cash
- 1.62%
- DSCR
- 1.07
- GRM
- 8.9
CMA / ARV
- ARV (median comp)
- $280,859
- List price
- $198,500
- Delta
- -29.32%
- Verdict
- UNDERPRICED
- Comps
- 20 within 1.0 mi
Show comp detail 12 sales within ~0.75 mi
| Address | Dist | Beds/Ba | Sqft | Sold | Price | $/sf | Match |
|---|---|---|---|---|---|---|---|
| 2336 N Peking St | 0.17mi | 3/2.5 (-1) | 2,100 (+0%) | 7mo | $336,000 | $160 | 79 |
| 107 E Camellia Ave | 0.47mi | 4/2.0 | 2,036 (-3%) | 8mo | $307,000 | $151 | 67 |
| 209 W Walnut Ave E | 0.34mi | 3/2.0 (-1) | 2,003 (-4%) | 12mo | $259,000 | $129 | 62 |
| 2200 N H St | 0.35mi | 4/2.5 | 2,337 (+12%) | 2mo | $288,800 | $124 | 60 |
| 608 Upas Ave | 0.61mi | 4/2.5 | 1,880 (-10%) | 0mo | $255,000 | $136 | 52 |
| 609 Upas Ave | 0.61mi | 3/2.0 (-1) | 1,946 (-7%) | 4mo | $299,000 | $154 | 52 |
| 417 W Westway Ave | 0.51mi | 3/3.5 (-1) | 1,960 (-6%) | 5mo | $235,000 | $120 | 50 |
| 313 W Highland Ave W | 0.45mi | 3/2.0 (-1) | 1,797 (-14%) | 3mo | $249,000 | $139 | 48 |
| 305 W Maple Ave | 0.67mi | 4/2.0 | 1,844 (-12%) | 5mo | $183,000 | $99 | 45 |
| 300 W Westway Ave | 0.41mi | 3/2.0 (-1) | 1,790 (-14%) | 12mo | $215,000 | $120 | 42 |
| 504 W Gardenia Ave | 0.69mi | 3/3.0 (-1) | 2,210 (+6%) | 12mo | $277,000 | $125 | 39 |
| 720 Westway Ave | 0.73mi | 4/2.5 | 1,784 (-15%) | 8mo | $235,000 | $132 | 33 |
Match score weights: distance 35% · size 25% · config 20% · recency 20%. Top-matched comps best support the ARV.
Projected returns pro-forma
-3.0% appreciation · 1.78% rent growth · sell at horizon
- IRR
- -15.1%
- Equity multiple
- 0.47×
- Total profit
- $-29,600
- Equity at exit
- $29,597
- IRR
- -8.7%
- Equity multiple
- 0.49×
- Total profit
- $-28,497
- Equity at exit
- $17,163
Cash invested: $55,580 (down + closing). Projections, not guarantees.
Landlord ↔ Tenant lean methodology
- Overall (STATE)
- 87 Strongly Landlord-Friendly
- State Texas
- 87 Strongly Landlord-Friendly · R+5
- County
- — inherits STATE
- City
- — inherits STATE
ZIP-level market 78501
- Home prices YoY
- -23.3%
- Rents YoY
- 1.8%
- Active inventory
- 385
- Price-to-rent
- 8.9×
Monthly cashflow live
- Estimated rent
- $1,868 high interval (Pro) →
- Mortgage (P&I)
- −$1,041
- Tax from tax record
- −$277 /mo · $3,321/yr
- Insurance
- −$83
- HOA
- −$0
- Vacancy / Maint / Mgmt
- −$392
- Net cashflow
- $75
Break-even live
UW: 25.0% down · 7.5% · 30yr · 1.5% tax · 5.0% vac · 8.0% maint · 8.0% mgmt
Financing live
Cash to close
- Down payment
- $49,625
- Closing costs
- $5,955
- Reserves months
- —
- Total cash needed
- —
Loan-product check · same deal, 3 products live
Conventional
25% down · 7.5% · 30yr
- Down + closing
- —
- Monthly P&I
- —
- Monthly cashflow
- —
- DSCR
- —
- Eligible?
- —
Personal DTI + credit; lowest rate.
DSCR
20% down · 8.5% · 30yr
- Down + closing
- —
- Monthly P&I
- —
- Monthly cashflow
- —
- DSCR
- —
- Eligible?
- —
No personal income docs; deal must DSCR.
Hard money
10% down · 12.0% · 12mo
- Down + closing
- —
- Monthly P&I
- —
- Monthly cashflow
- —
- DSCR
- —
- Eligible?
- —
Short-term bridge; refi at stabilization.
Rent comps 21 comps
| Address | Beds | Baths | Sqft | Rent | $/sqft | DOM | Units | Dist |
|---|---|---|---|---|---|---|---|---|
| 2325 N Peking St McAllen, TX | 3.0 | 2.5 | 1774 | $2,100 | $1.18 | 43d | 1 | 0.19mi |
| 301 E La Vista Ave Unit 49 McAllen, TX | 3.0 | 3.0 | 1716 | $1,450 | $0.84 | 21d | 1 | 0.21mi |
| 1021 E La Vista Ave Unit 4 McAllen, TX | 3.0 | 2.5 | 1500 | $1,800 | $1.20 | 43d | 1 | 0.49mi |
| 619 Highland Ave McAllen, TX | 3.0 | 2.0 | 1511 | $1,500 | $0.99 | 21d | 1 | 0.69mi |
| 512 E Gardenia Ave McAllen, TX | 3.0 | 2.0 | 1717 | $1,900 | $1.11 | 43d | 1 | 0.70mi |
| 505 W Esperanza Ave McAllen, TX | 3.0 | 3.0 | 2660 | $4,250 | $1.60 | 23d | 1 | 0.78mi |
| 3400 N Cynthia St McAllen, TX | 3.0 | 2.0 | 1708 | $1,600 | $0.94 | 23d | 1 | 0.83mi |
| 118 E Iris Ave McAllen, TX | 4.0 | 2.5 | 2070 | $1,800 | $0.87 | 23d | 1 | 0.85mi |
| 121 E Jonquil Ave McAllen, TX | 4.0 | 3.5 | 2792 | $1,985 | $0.71 | 23d | 1 | 0.94mi |
| 701 Hibiscus Ave #12 McAllen, TX | 3.0 | 2.0 | 1685 | $1,800 | $1.07 | 44d | 1 | 1.01mi |
| 1808 N Broadway St McAllen, TX | 4.0 | 3.0 | 1800 | $2,400 | $1.33 | 43d | 1 | 1.07mi |
| 1024 Laurel Ave McAllen, TX | 3.0 | 2.0 | 1466 | $1,600 | $1.09 | 43d | 1 | 1.10mi |
| 705 Kerry Ln McAllen, TX | 3.0 | 2.0 | 2326 | $1,650 | $0.71 | 23d | 1 | 1.19mi |
| 1203 Jasmine Ave McAllen, TX | 3.0 | 2.0 | 1588 | $1,500 | $0.94 | 43d | 1 | 1.24mi |
| 1516 Walnut Ave McAllen, TX | 4.0 | 2.0 | 2188 | $1,495 | $0.68 | 43d | 1 | 1.28mi |
| 405 Cedar Ave McAllen, TX | 3.0 | 3.0 | 1935 | $2,000 | $1.03 | 43d | 1 | 1.29mi |
| 1101 Kerria Ave McAllen, TX | 3.0 | 2.0 | 1920 | $2,350 | $1.22 | 21d | 1 | 1.34mi |
| 1210 W Jonquil Ave McAllen, TX | 4.0 | 3.0 | 1628 | $1,525 | $0.94 | 43d | 1 | 1.40mi |
| 914 N 15th St McAllen, TX | 3.0 | 2.0 | 2422 | $1,900 | $0.78 | 43d | 1 | 1.41mi |
| 914 N 15th St McAllen, TX | 3.0 | 2.0 | 2422 | $1,900 | $0.78 | 14d | 1 | 1.41mi |
| 1900 La Vista Ave McAllen, TX | 4.0 | 2.0 | 1410 | $2,400 | $1.70 | 43d | 1 | 1.49mi |
Listing history 17 events
-
2026-06-18days on market $198,500 Active 101 DOM
-
2026-06-17days on market $198,500 Active 100 DOM
-
2026-06-16days on market $198,500 Active 99 DOM
-
2026-06-15days on market $198,500 Active 98 DOM
-
2026-06-14days on market $198,500 Active 96 DOM
-
2026-06-10days on market $198,500 Active 93 DOM
-
2026-06-09days on market $198,500 Active 92 DOM
-
2026-06-08days on market $198,500 Active 91 DOM
-
2026-06-07days on market $198,500 Active 90 DOM
-
2026-06-05days on market $198,500 Active 87 DOM
-
2026-06-03days on market $198,500 Active 86 DOM
-
2026-06-02days on market $198,500 Active 85 DOM
-
2026-06-01days on market $198,500 Active 84 DOM
-
2026-05-31days on market $198,500 Active 83 DOM
-
2026-05-31days on market $198,500 Active 82 DOM
-
2026-03-09$198,500 Active 505-char remark
Show marketing remark (505 chars)
Charming fixer-upper with incredible potential, perfect for a first-time home buyer or investor! Ideally located in a highly desirable area of McAllen, this home offers convenience and opportunity all in one. Enjoy close proximity to popular restaurants, shopping centers, schools, parks, and local businesses—everything you need just minutes away. With a little vision and TLC, this property can truly shine and become the perfect place to call home. Don’t miss out on this great opportunity.
-
1984-04-26soldstatus
ⓘ Source: listings_history table (triggers on properties + properties_extension) + one-shot
backfill from property_details.listing_events for pre-trigger history.
Tax reassessment forecast TX · Resets to sale price
- Current annual tax
- $3,321 · $277/mo
- Projected year-2 tax
- $3,633 · $303/mo
- Expected delta
- +$311/yr (+$26/mo · 9.4%)
ⓘ Screening estimate from a state-policy table — verify with the county assessor before closing.
Climate risk First Street
- Flood 1/10 Low FEMA zone X (shaded) · 0% chance over 30 yrs
- Wildfire 1/10 Low
- Heat 9/10 Extreme 7 d/yr ≥111°F today · 22 d/yr by 30 yrs out
- Wind 8/10 Severe 99% chance of damaging wind over 30 yrs
- Air quality 3/10 Moderate 1 unhealthy d/yr today · 4 by 30 yrs out
Nearby sold comps map
Loading sold comps map…
Walkable amenities ~0.75 mi
Loading nearby amenities…
Taxation est. · year 1
- Rental income
- $22,414
- − Mortgage interest
- −$11,119
- − Property taxes
- −$3,321
- − Insurance
- −$992
- − Repairs & maintenance
- −$1,793
- − Management
- −$1,793
- − Depreciation
- −$5,775
- Taxable loss
- −$2,380
- Est. tax savings @ 24.0%
- +$571
- After-tax cash flow
- $1,473/yr
For passive investors: Depreciation is non-cash, so a rental often shows a tax loss while cash-flowing — sheltering income. Rental losses are passive: they offset passive income freely, and up to $25,000/yr can offset ordinary (W-2) income if you actively participate and your MAGI is under $100k (phasing out to $0 by $150k); unused losses carry forward. On sale, claimed depreciation is recaptured at up to 25%, and gains may owe capital-gains tax (a 1031 exchange can defer both). Figures are a year-1 estimate at your 24.0% rate — not tax advice; consult a CPA.
Schools (NCES district)
- District
- Mcallen ISD
- NCES district ID
- 4829670
- Math proficiency
- 34% ▼ -22.00%
- Reading proficiency
- 45% ▼ -5.00%
- Median HH income
- $40,805
- Composite
- 33.16/100
- National rank
- #5551
- State rank
- #440 of 826 in TX
Livability — McAllen
- Score
- 76/100
- State rank
- #119
- US rank
- #3771
Category grades
Schools grade is shown separately in the Schools card above.
Census & demographics
- Census place
- McAllen, TX
- County
- Hidalgo County · 623,128 people
- City population
- 144,650
- Metro
- McAllen-Edinburg-Mission, TX
- Population (ZIP)
- 58,935
- Household income
- $48,071
- Rent vs Own
- Severe rent burden
- 3043.0
Population outlook (Hidalgo County) Hauer SSP2
- Today (2025)
- 955,232 people
- By 2030
- 1,009,774 · +5.7%
- By 2040
- 1,120,332 · +17.3%
- By 2050
- 1,225,036 · +28.2%
- By 2075
- 1,439,189 · +50.7%
- By 2100
- 1,533,429 · +60.5%
Race, ethnicity, and origin ACS 2023
- Neighborhood character
- Predominantly Hispanic (89%)
- Race & ethnicity
- Hispanic / Latino 89% Two or more races 32% White 8% Asian 2%
- Hispanic origin (detail)
- Mexican 85%
- Foreign-born
- 28% · Canada, Vietnam
- Languages at home
- 22% English-only · Spanish 76%
Political lean MEDSL · Hidalgo
- 2024 margin
- Toss-up / Even · D 48.1% · R 51.0%
- 2008→2024 swing
- -41.6pp toward R · 2008: 38.7pp · 2024: -2.9pp
- All cycles
- 2024: R+2.9 2020: D+17.1 2016: D+40.5 2012: D+41.8 2008: D+38.7
Not yet ingested
- Civics
- —
Market trends
- HPI YoY
- ▼ -69.99%
- Current HPI
- 230.0213
- Rent YoY
- ▲ 1.78%
- Metro
- McAllen-Edinburg-Mission, TX
- State GDP YoY
- ▲ 3.95%
- F500 in state
- 110
Industry mix (Fortune 500 HQ in TX)
| Industry | F500 HQs | Revenue |
|---|---|---|
| Energy | 16 | $1,198B |
|
||
| Technology | 5 | $198B |
|
||
| Engineering / Construction | 4 | $72B |
|
||
| Energy Services | 3 | $60B |
|
||
| Utilities | 3 | $41B |
|
||
| Healthcare | 2 | $330B |
|
||
Price history
2 events — show timeline
- 2026-03-09 Listed $198,500 MCALLENMLS
- 1984-04-26 Sold (Public Records) — Public Records
Property tax history
+4.4%/yrLatest (2025): $3,321 · +7.0% YoY. Source: county tax records.
Cash-flow waterfall
monthlySold comps — $/sqft
last 12 mo · ≤1 miLoading sold comps…