8523 Hearth Dr Unit 19-34 · Houston, TX
Flood risk 8/10 · Major
- FEMA flood zone
- X (unshaded)
- Chance of flooding over 30 yrs
- 0.99%
- Est. flood insurance / yr
- $507 – $1,088
Fire risk 1/10 · Minimal
- Est. fire insurance / yr
- $1,222 – $2,270
Heat risk 9/10 · Severe
- Hot days now (above 109°F)
- 7 days/yr
- Hot days in 30 yrs
- 25 days/yr
Wind risk 9/10 · Severe
- Chance of severe wind over 30 yrs
- 99.0%
Air-quality risk 2/10 · Minimal
- Unhealthy air days now
- 2 days/yr
- Unhealthy air days in 30 yrs
- 2 days/yr
Risk factors via First Street. Map © Google.
Why this score? — see what drove the C grade
The composite is a weighted blend of 9 inputs, each scored 0–100. Each bar is that input's sub-score; the figure is the points it added to the 100-point composite (weight × sub-score).
- Cash flow +24.1/30.0
- 1% rule +10.0/10.0
- DSCR +7.8/10.0
- Livability +3.7/5.0
- Appreciation +2.7/10.0
- Schools +2.7/10.0
- Condition / age +2.5/5.0
- Rent growth +1.8/5.0
- ARV discount +0.0/15.0
$125,000
🖨 Deal sheet (PDF) 📄 Offer letter ✓ Due diligence
Listing remarks MLS
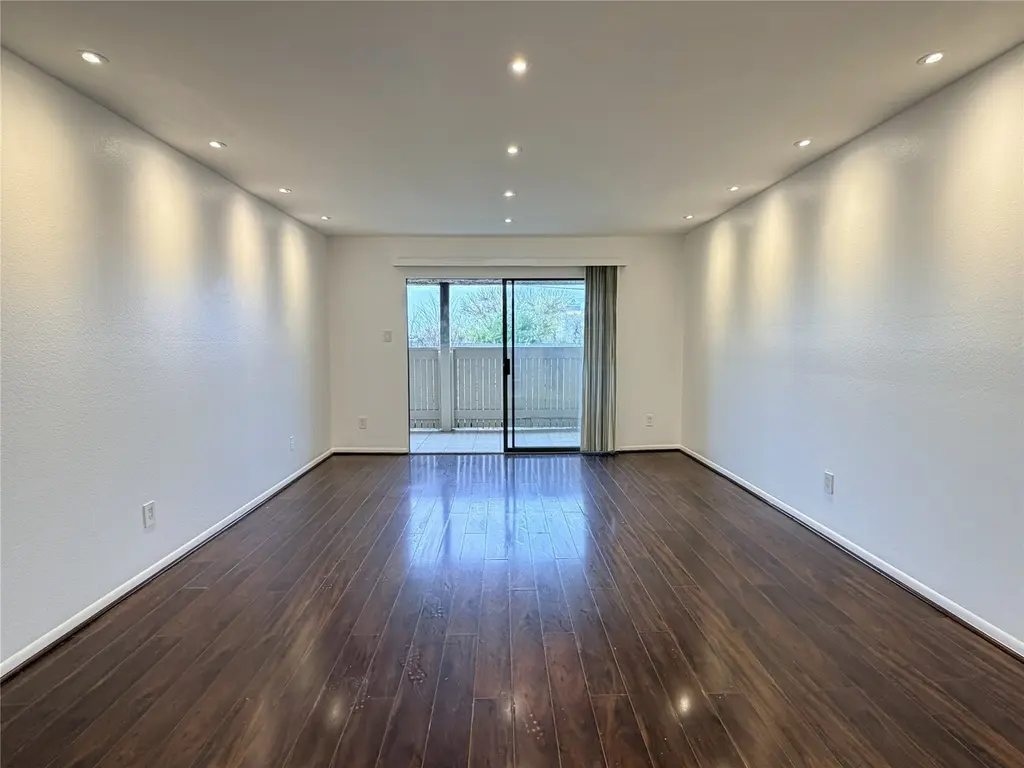
Convenient Location!!! Gated Community!!! This 3B/2B unit on 3rd floor features the hardwood floors throughout the entire unit, providing a clean, low-maintenance living environment with no carpeted areas. Kitchen with granite countertops and appliances are included in the sale. HOA includes water, sewer, trash,security public pool and tennis court access. On-site management, assigned covered and uncovered parking. Conveniently located to the Medical Center and walking distance to NRG.Perfect for investors seeking a long-term rental opportunity
Key facts
- Gated community
- Granite countertops
- Public pool
Tags
Neighborhood map
What this means for you Summary
Snapshot
- This is a 3-bed/2.0-bath condo listed at $125k.
Deal economics
- At list price, monthly cash flow is $180 ($2k/yr) — positive.
- The deal already cash-flows at list — no discount required.
- Meets the 1% rule at list price ($2k rent vs $125k).
- Recommended offer: $114k (9.0% below list) — sets the bar for market timing.
- Cap rate 8.7% vs local median 3.2% in Houston — top-decile yield for the area; either an underpriced asset or a hidden risk that comps aren't pricing in. Stress-test before assuming the spread holds.
Location & tenants
- Location reads 74/100 on livability (#184 in TX, #4,771 nationally) — a middle-class / working-renter tenant base. Strengths: amenities A+, cost of living A+, housing A+; Watch: schools D, crime F.
- Houston ISD (urban): math 27% / reading 35% proficiency, ranked #593 of 826 in TX (top 72%) — families likely to look elsewhere, expect single-tenant / working-renter base with shorter leases; 71% free/reduced lunch — lower-income household profile, screen leases tightly.
- Market conditions: Rents soft (-2.8%/yr); 271 active listings in the ZIP; 40 comparable units currently listed for rent nearby; rentals leasing fast (median 12d on market — plan ~1-2 weeks tenant-placement turnaround); 29,883 units permitted in Harris County in 2024 (8,621 in 5+ unit buildings).
- This rent runs 39% of the median local income ($62k/yr) — at the standard rent-burdened threshold; future hikes will face affordability resistance.
Forward outlook
- Local home prices are declining (-3.0%/yr); year-one equity from $864 of loan paydown is wiped out by about $4k of value loss. Plan a longer hold.
- Harris County population projected at +47% by 2050 — long-run rental-demand tailwind backs the buy-and-hold thesis.
Negotiation context
- It's been on market 94 days — a 9% lower offer ($114k) is reasonable based on typical stale-listing flexibility.
- 3 sale attempts with the ask held roughly flat each time — persistent listings suggest the price (not the market) is what's stuck; bring a comps-based counter.
- Current owner paid $18k; list at $125k implies a 614% gain — meaningful room to come down on a strong offer.
Risks & watch-outs
- Watch-outs: flood insurance adds $66/mo; HOA is 22% of rent.
- Climate carrying-cost: severe flood risk; severe wind risk, 99% chance of damaging wind over 30y; extreme-heat days projected 7→25/yr by 2055 (HVAC capex compounding) — expect insurance premiums to compound above CPI over the hold.
Questions for the listing agent
- It's been on market 94 days. Have you received any prior offers? Is the seller open to a 9% concession, seller financing, or rate buy-down credit?
- Built in 1979 — when were the roof, HVAC, electrical panel, plumbing, and water heater last replaced?
- What's the actual annual flood-insurance premium (NFIP or private), and is the property in a SFHA with mandatory coverage?
- What does the HOA fee cover, when was the last increase, and are there any pending special assessments or reserve-fund shortfalls?
- Any open or pending special assessments — roof, HVAC, plumbing, elevator, façade? What's the per-unit balance and payoff schedule, and is the seller paying it off at close or rolling it to the buyer?
- Why hasn't it sold? Are there any deal-killer items the seller is aware of (foundation, flood, title, zoning, code violations)?
- Is there a deadline driving the sale (1031 exchange, divorce, estate, relocation)? That informs how much negotiation room exists.
- Schools are D-rated, which usually means shorter tenancies and higher turnover. Who's the typical renter profile here, and what's been the actual vacancy rate?
- Crime grade is F in this area — have there been break-ins, vandalism, or insurance claims at this property in the last 3 years? What carrier currently insures it and at what premium?
- What's the average days-on-market for RENTAL listings here right now (not sales)? A rising rental-DOM trend means longer vacancies and softer asking-rent achievability than the comps imply.
- What's the recent tenant-quality profile in this submarket — average credit score on applications, eviction rate, late-payment / NSF rate, and stable-employment percentage? A property-management company in the area should have these aggregated.
- How much new apartment / multifamily construction is in the pipeline within 1–3 miles? Heavy new supply (>2% of stock underway) typically softens rents 12–24 months out; light construction supports rent growth.
Investment metrics
- 1% rule
- 1.60% ✓
- Cap rate
- 8.66%
- Cash-on-cash
- 8.44%
- DSCR
- 1.38
- GRM
- 5.2
CMA / ARV
- ARV (median comp)
- $96,154
- List price
- $125,000
- Delta
- 30.00%
- Verdict
- OVERPRICED
- Comps
- 20 within 1.0 mi
Projected returns pro-forma
-3.0% appreciation · 0.0% rent growth · sell at horizon
- IRR
- -11.8%
- Equity multiple
- 0.59×
- Total profit
- $-14,321
- Equity at exit
- $18,638
- IRR
- -11.4%
- Equity multiple
- 0.46×
- Total profit
- $-18,951
- Equity at exit
- $10,808
Cash invested: $35,000 (down + closing). Projections, not guarantees.
Landlord ↔ Tenant lean methodology
- Overall (STATE)
- 87 Strongly Landlord-Friendly
- State Texas
- 87 Strongly Landlord-Friendly · R+5
- County
- — inherits STATE
- City
- — inherits STATE
ZIP-level market 77054
- Home prices YoY
- -2.6%
- Rents YoY
- -2.8%
- Active inventory
- 271
- Price-to-rent
- 5.2×
Monthly cashflow live
- Estimated rent
- $2,003 high interval (Pro) →
- Mortgage (P&I)
- −$656
- Tax from tax record
- −$193 /mo · $2,321/yr
- Insurance
- −$52
- Flood insurance flood zone
- −$66 /mo · $798/yr
- HOA
- −$435
- Vacancy / Maint / Mgmt
- −$421
- Net cashflow
- $180
Break-even live
Sensitivity live
| Price | -10% $250 | -5% $215 | +0% $180 | +5% $144 | +10% $109 |
|---|---|---|---|---|---|
| Rent | -10% $21 | -5% $101 | +0% $180 | +5% $259 | +10% $338 |
| Rate | -1.0pp $243 | -0.5pp $211 | base $180 | +0.5pp $147 | +1.0pp $114 |
UW: 25.0% down · 7.5% · 30yr · 1.5% tax · 5.0% vac · 8.0% maint · 8.0% mgmt
Financing live
Cash to close
- Down payment
- $31,250
- Closing costs
- $3,750
- Reserves months
- —
- Total cash needed
- —
Loan-product check · same deal, 3 products live
Conventional
25% down · 7.5% · 30yr
- Down + closing
- —
- Monthly P&I
- —
- Monthly cashflow
- —
- DSCR
- —
- Eligible?
- —
Personal DTI + credit; lowest rate.
DSCR
20% down · 8.5% · 30yr
- Down + closing
- —
- Monthly P&I
- —
- Monthly cashflow
- —
- DSCR
- —
- Eligible?
- —
No personal income docs; deal must DSCR.
Hard money
10% down · 12.0% · 12mo
- Down + closing
- —
- Monthly P&I
- —
- Monthly cashflow
- —
- DSCR
- —
- Eligible?
- —
Short-term bridge; refi at stabilization.
Rent comps 40 comps
| Address | Beds | Baths | Sqft | Rent | $/sqft | DOM | Units | Dist |
|---|---|---|---|---|---|---|---|---|
| 8415 Hearth Dr #25 Houston, TX | 3.0 | 2.0 | 1500 | $3,950 | $2.63 | 44d | 1 | 0.08mi |
| 8415 Hearth Dr Unit 1019639P Houston, TX | 3.0 | 2.0 | 1496 | $5,205 | $3.48 | 0d | 1 | 0.08mi |
| 8521 Hearth Dr Houston, TX | 2.0 | 2.0 | 1092 | $1,195 | $1.09 | 44d | 1 | 0.10mi |
| 2801 S Bartell Dr Houston, TX | 2.0 | 2.0 | 1289 | $1,808 | $1.40 | 13d | 1 | 0.16mi |
| 8877 Lakes At 610 Dr Houston, TX | 1.0–2.0 | 1.0–2.0 | 964 | $1,808 | $1.87 | 13d | 2 | 0.25mi |
| 8877 Lakes At 610 Dr Houston, TX | 1.0–2.0 | 1.0–2.0 | 1005 | $1,808 | $1.80 | 8d | 3 | 0.25mi |
| 8877 Lakes At 610 Dr Houston, TX | 1.0–2.0 | 1.0–2.0 | 964 | $1,808 | $1.87 | 0d | 3 | 0.25mi |
| 8877 Lakes at 610 Dr Unit RAMC3 Houston, TX | 2.0 | 2.0 | 1289 | $1,808 | $1.40 | 44d | 1 | 0.25mi |
| 8877 Lakes at 610 Dr Unit RAMC2 Houston, TX | 2.0 | 2.0 | 1122 | $1,595 | $1.42 | 44d | 1 | 0.25mi |
| 8900 Lakes at 610 Dr Houston, TX | 1.0–2.0 | 1.0–2.0 | 981 | $1,920 | $1.96 | 0d | 20 | 0.27mi |
| 8900 Lakes at 610 Dr Houston, TX | 1.0–2.0 | 1.0–2.0 | 981 | $1,810 | $1.84 | 44d | 35 | 0.27mi |
| 2989 Westridge St Houston, TX | 2.0 | 2.0 | 1108 | $1,639 | $1.48 | 13d | 1 | 0.45mi |
| 9955 Buffalo Speedway Houston, TX | 1.0–3.0 | 1.0–2.0 | 874 | $1,949 | $2.23 | 0d | 15 | 0.45mi |
| 9330 Main St Houston, TX | 1.0–2.0 | 1.0–2.0 | 915 | $2,460 | $2.69 | 0d | 49 | 0.52mi |
| 9330 S Main St Houston, TX | 1.0–2.0 | 1.0–2.0 | 942 | $2,415 | $2.56 | 15d | 53 | 0.54mi |
| 9426 S Main St Houston, TX | 2.0 | 2.0 | 1264 | $2,040 | $1.61 | 44d | 1 | 0.54mi |
| 9016 Bayview Cove Dr Houston, TX | 3.0 | 3.0 | 2245 | $4,200 | $1.87 | 19d | 1 | 0.59mi |
| 3000 Murworth Dr Houston, TX | 1.0–2.0 | 1.0–2.0 | 865 | $1,299 | $1.50 | 3d | 34 | 0.61mi |
| 9111 Lakes at 610 Dr Unit 3112 Houston, TX | 3.0 | 2.0 | 1157 | $1,943 | $1.68 | 0d | 1 | 0.63mi |
| 9111 Lakes at 610 Dr Unit 3174 Houston, TX | 3.0 | 2.0 | 1157 | $1,994 | $1.72 | 0d | 1 | 0.63mi |
| 9111 Lakes at 610 Dr Unit 3174 Houston, TX | 3.0 | 2.0 | 1157 | $1,983 | $1.71 | 12d | 1 | 0.63mi |
| 9111 Lakes at 610 Dr Unit 9144 Houston, TX | 3.0 | 2.0 | 1157 | $1,660 | $1.43 | 44d | 1 | 0.63mi |
| 10201 Buffalo Speedway Unit 10224 Houston, TX | 2.0 | 2.0 | 1110 | $1,738 | $1.57 | 12d | 1 | 0.63mi |
| 10201 Buffalo Speedway Unit 2162 Houston, TX | 2.0 | 2.0 | 1110 | $1,714 | $1.54 | 6d | 1 | 0.63mi |
| 10201 Buffalo Speedway Unit 2187 Houston, TX | 2.0 | 2.0 | 1110 | $1,739 | $1.57 | 0d | 1 | 0.63mi |
| 10201 Buffalo Speedway Unit 425 Houston, TX | 2.0 | 2.0 | 1110 | $1,714 | $1.54 | 8d | 1 | 0.63mi |
| 10201 Buffalo Speedway Unit 10234 Houston, TX | 3.0 | 2.0 | 1523 | $2,074 | $1.36 | 12d | 1 | 0.63mi |
| 3006 Murworth Dr Houston, TX | 2.0 | 2.0 | 1052 | $1,253 | $1.19 | 44d | 1 | 0.69mi |
| 3006 Murworth Dr Houston, TX | 2.0 | 2.0 | 1052 | $1,253 | $1.19 | 23d | 1 | 0.69mi |
| 10201 Buffalo Speedway Unit 3047 Houston, TX | 3.0 | 2.0 | 1523 | $2,085 | $1.37 | 0d | 1 | 0.69mi |
| 10301 Buffalo Speedway Unit 3112 Houston, TX | 3.0 | 2.0 | 1420 | $1,921 | $1.35 | 0d | 1 | 0.72mi |
| 10301 Buffalo Speedway Unit 3174 Houston, TX | 3.0 | 2.0 | 1420 | $1,972 | $1.39 | 0d | 1 | 0.72mi |
| 10301 Buffalo Speedway Unit 10334 Houston, TX | 3.0 | 2.0 | 1420 | $1,975 | $1.39 | 44d | 1 | 0.72mi |
| 10201 Buffalo Speedway Unit 3165 Houston, TX | 3.0 | 2.0 | 1523 | $2,034 | $1.34 | 0d | 1 | 0.73mi |
| 10201 Buffalo Speedway Unit 2165 Houston, TX | 2.0 | 2.0 | 1110 | $1,698 | $1.53 | 0d | 1 | 0.73mi |
| 8706 S Main St Houston, TX | 2.0 | 2.0 | 1161 | $1,725 | $1.49 | 44d | 1 | 0.78mi |
| 9150 Buffalo Speedway Houston, TX | 2.0 | 2.0 | 1161 | $1,702 | $1.47 | 13d | 1 | 0.78mi |
| 10191 S Main St Houston, TX | 1.0–2.0 | 1.0–2.0 | 961 | $2,110 | $2.20 | 0d | 136 | 0.78mi |
| 8700 Main St Houston, TX | 1.0–2.0 | 1.0–2.0 | 954 | $1,859 | $1.95 | 0d | 5 | 0.79mi |
| 10301 Buffalo Speedway Houston, TX | 1.0–3.0 | 1.0–2.0 | 1027 | $2,103 | $2.05 | 0d | 19 | 0.82mi |
HOA detail condo
- Monthly dues
- $435 · $5,220/yr
- Likely covers
- watersewertrashpoolsecurity
- Assessments
- None detected in remarks — confirm with the listing agent.
Listing history 22 events
-
2026-06-21days on market $125,000 Active 94 DOM
-
2026-06-18days on market $125,000 Active 91 DOM
-
2026-06-17days on market $125,000 Active 90 DOM
-
2026-06-16days on market $125,000 Active 89 DOM
-
2026-06-15days on market $125,000 Active 88 DOM
-
2026-06-13days on market $125,000 Active 86 DOM
-
2026-06-10days on market $125,000 Active 82 DOM
-
2026-06-08days on market $125,000 Active 81 DOM
-
2026-06-07days on market $125,000 Active 80 DOM
-
2026-06-04days on market $125,000 Active 77 DOM
-
2026-06-01days on market $125,000 Active 74 DOM
-
2026-05-31days on market $125,000 Active 73 DOM
-
2026-05-16price $1,450
-
2026-03-19$125,000 Active 550-char remark
Show marketing remark (550 chars)
Convenient Location!!! Gated Community!!! This 3B/2B unit on 3rd floor features the hardwood floors throughout the entire unit, providing a clean, low-maintenance living environment with no carpeted areas. Kitchen with granite countertops and appliances are included in the sale. HOA includes water, sewer, trash,security public pool and tennis court access. On-site management, assigned covered and uncovered parking. Conveniently located to the Medical Center and walking distance to NRG.Perfect for investors seeking a long-term rental opportunity
-
2026-03-05$1,790
-
2026-03-04historical $1,800
-
2026-02-14price $1,800
-
2026-01-28$2,100
-
2015-05-15soldstatus
-
2010-04-26soldstatus
-
2006-08-29soldstatus
-
1995-03-31soldstatus $17,500
ⓘ Source: listings_history table (triggers on properties + properties_extension) + one-shot
backfill from property_details.listing_events for pre-trigger history.
Tax reassessment forecast TX · Resets to sale price
- Current annual tax
- $2,321 · $193/mo
- Projected year-2 tax
- $2,321 · $193/mo
- Expected delta
- $0/yr ($0/mo · 0.0%)
ⓘ Screening estimate from a state-policy table — verify with the county assessor before closing.
Climate risk First Street
- Flood 8/10 Severe FEMA zone X (unshaded) · 99% chance over 30 yrs
- Wildfire 1/10 Low
- Heat 9/10 Extreme 7 d/yr ≥109°F today · 25 d/yr by 30 yrs out
- Wind 9/10 Extreme 99% chance of damaging wind over 30 yrs
- Air quality 2/10 Low 2 unhealthy d/yr today · 2 by 30 yrs out
Nearby sold comps map
Loading sold comps map…
Walkable amenities ~0.75 mi
Loading nearby amenities…
Taxation est. · year 1
- Rental income
- $24,033
- − Mortgage interest
- −$7,002
- − Property taxes
- −$2,321
- − Insurance
- −$1,422
- − Repairs & maintenance
- −$1,923
- − Management
- −$1,923
- − HOA
- −$5,220
- − Depreciation
- −$3,636
- Taxable income
- $585
- Est. tax owed @ 24.0%
- −$140
- After-tax cash flow
- $2,015/yr
For passive investors: Depreciation is non-cash, so a rental often shows a tax loss while cash-flowing — sheltering income. Rental losses are passive: they offset passive income freely, and up to $25,000/yr can offset ordinary (W-2) income if you actively participate and your MAGI is under $100k (phasing out to $0 by $150k); unused losses carry forward. On sale, claimed depreciation is recaptured at up to 25%, and gains may owe capital-gains tax (a 1031 exchange can defer both). Figures are a year-1 estimate at your 24.0% rate — not tax advice; consult a CPA.
Schools (NCES district)
- District
- Houston ISD
- NCES district ID
- 4823640
- Math proficiency
- 27% ▼ -18.00%
- Reading proficiency
- 35% ▼ -6.00%
- Median HH income
- $46,054
- Composite
- 26.63/100
- National rank
- #7173
- State rank
- #593 of 826 in TX
Livability — Houston
- Score
- 74/100
- State rank
- #184
- US rank
- #4771
Category grades
Schools grade is shown separately in the Schools card above.
Census & demographics
- Census place
- Houston, TX
- County
- Harris County · 4,702,590 people
- City population
- 3,226,434
- Metro
- Houston-The Woodlands-Sugar Land, TX
- Population (ZIP)
- 28,272
- Household income
- $62,106
- Rent vs Own
- Severe rent burden
- 2814.0
Population outlook (Harris County) Hauer SSP2
- Today (2025)
- 5,571,493 people
- By 2030
- 6,089,821 · +9.3%
- By 2040
- 7,142,806 · +28.2%
- By 2050
- 8,185,864 · +46.9%
- By 2075
- 10,574,329 · +89.8%
- By 2100
- 12,109,958 · +117.4%
Race, ethnicity, and origin ACS 2023
- Neighborhood character
- Highly diverse neighborhood (Simpson 0.72)
- Race & ethnicity
- Black 41% Asian 22% White 20% Hispanic / Latino 14% Two or more races 10%
- Hispanic origin (detail)
- Mexican 7%
- Common ancestry
- Slovak 2% Romanian 1% Italian 1%
- Foreign-born
- 29% · China, Canada, Jamaica
- Languages at home
- 67% English-only · Spanish 9% Chinese 7% Other Indo-European 5%
Political lean MEDSL · Harris
- 2024 margin
- Lean D (+5.5) · D 52.0% · R 46.4% · Other 1.6%
- 2008→2024 swing
- +3.9pp toward D · 2008: 1.6pp · 2024: 5.5pp
- All cycles
- 2024: D+5.5 2020: D+13.3 2016: D+12.4 2012: D+0.1 2008: D+1.6
Not yet ingested
- Civics
- —
Market trends
- HPI YoY
- ▼ -4.51%
- Current HPI
- 170.4017
- Rent YoY
- ▼ -2.82%
- Metro
- Houston-The Woodlands-Sugar Land, TX
- State GDP YoY
- ▲ 3.95%
- F500 in state
- 110
Industry mix (Fortune 500 HQ in TX)
| Industry | F500 HQs | Revenue |
|---|---|---|
| Energy | 16 | $1,198B |
|
||
| Technology | 5 | $198B |
|
||
| Engineering / Construction | 4 | $72B |
|
||
| Energy Services | 3 | $60B |
|
||
| Utilities | 3 | $41B |
|
||
| Healthcare | 2 | $330B |
|
||
Price history
-91.7% since first listed10 events — show timeline
- 2026-05-16 Price Changed $1,450 HARMLS
- 2026-03-19 Listed $125,000 HARMLS
- 2026-03-05 Listed for Rent $1,790 HARMLS
- 2026-03-04 Rental Removed $1,800 HARMLS
- 2026-02-14 Price Changed $1,800 HARMLS
- 2026-01-28 Listed for Rent $2,100 HARMLS
- 2015-05-15 Sold (Public Records) — Public Records
- 2010-04-26 Sold (Public Records) — Public Records
- 2006-08-29 Sold (Public Records) — Public Records
- 1995-03-31 Sold (Public Records) $17,500 Public Records
Property tax history
+4.5%/yrLatest (2025): $2,321 · +8.6% YoY. Source: county tax records.
Cash-flow waterfall
monthlySold comps — $/sqft
last 12 mo · ≤1 miLoading sold comps…