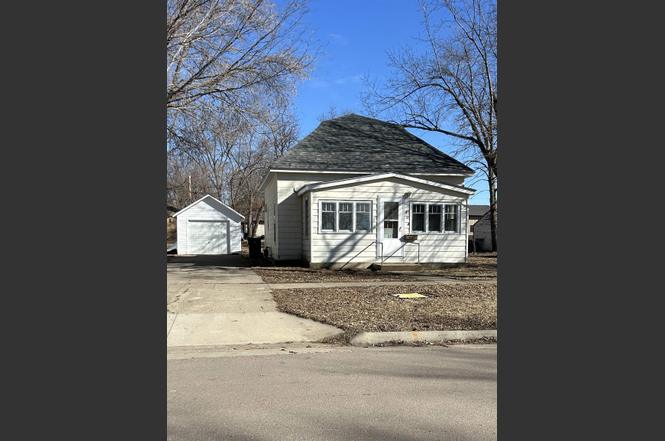
314 7th St S · Estherville, IA
Flood risk 1/10 · Minimal
- FEMA flood zone
- X (unshaded)
- Chance of flooding over 30 yrs
- 0.0%
- Est. flood insurance / yr
- $473 – $860
Fire risk 4/10 · Minor
- Est. fire insurance / yr
- $902 – $1,676
Heat risk 2/10 · Minimal
- Hot days now (above 98°F)
- 7 days/yr
- Hot days in 30 yrs
- 16 days/yr
Wind risk 2/10 · Minimal
- Chance of severe wind over 30 yrs
- —
Air-quality risk 1/10 · Minimal
- Unhealthy air days now
- 0 days/yr
- Unhealthy air days in 30 yrs
- 0 days/yr
Risk factors via First Street. Map © Google.
Why this score? — see what drove the C+ grade
The composite is a weighted blend of 9 inputs, each scored 0–100. Each bar is that input's sub-score; the figure is the points it added to the 100-point composite (weight × sub-score).
- Cash flow +30.0/30.0
- DSCR +10.0/10.0
- 1% rule +8.1/10.0
- Schools +5.2/10.0
- Livability +3.9/5.0
- Rent growth +2.5/5.0
- Condition / age +2.5/5.0
- ARV discount +1.0/15.0
- Appreciation +0.0/10.0
$79,000
🖨 Deal sheet (PDF) 📄 Offer letter ✓ Due diligence
Listing remarks
CUTE AND COZY 2 BEDROOM BUNGALOW. KITCHEN IS THE HEART IF THE HOME AND THIS KITCHEN HAS ROOM FOR ALL. NEW VYNAL HARDWOOD APPEARANCE FLOORING. SPACIOUS BATHROOM ALSO HAS NEW FLOORING. LIVING ROOM IS WARM AND WELCOMING WITH A LARGE WINDOW FOR LOTS OF LIGHT - AND - THERE IS A HEATED ENCLOSED FRONT PORCH. LIVINGROOM, PORCH AND BEDROOMS ALL HAVE NEW FLOORING ALSO. 1 CAR DETACHED AND NICE SIZED BACK YARD. READY TO CHANGE FROM BEING A HOUSE TO A HOME, BROKER OWNED
Key facts
- New flooring
- 8,712 sq ft lot
- Garage
Tags
Property features AI
Exterior
- Parking: Attached concrete garage (1 car)
- Utilities: Public water; Public sewer
- Home design: Single family residence; One level / single-story
- Construction: Partial basement
- Exterior features: 66 x 132 lot; 0.2 acre lot
Interior
- Kitchen: Eat-in kitchen
- Bathrooms: 1 full bathroom
- Heating & cooling: Natural gas forced air heating
- Interior features: Eat-in kitchen; Walk-in closet(s); Partial basement
Neighborhood map
What this means for you Summary
Snapshot
- This is a 2-bed/1.0-bath single-family listed at $79k.
Deal economics
- At list price, monthly cash flow is $299 ($4k/yr) — positive.
- The deal already cash-flows at list — no discount required.
- Meets the 1% rule at list price ($1k rent vs $79k).
- Recommended offer: $77k (3.0% below list) — sets the bar for market timing.
- Cap rate 10.8% vs local median 5.1% in Estherville — top-decile yield for the area; either an underpriced asset or a hidden risk that comps aren't pricing in. Stress-test before assuming the spread holds.
Location & tenants
- Location reads 77/100 on livability (#174 in IA, #3,136 nationally) — a middle-class / working-renter tenant base. Strengths: cost of living A+, housing A+, health & safety A+; Watch: amenities D-, commute F.
- Estherville Lincoln Central Community School District (town): math 57% / reading 67% proficiency, ranked #229 of 289 in IA (top 79%) — acceptable for families but not a draw, mixed tenant base, ~2y average lease.
- Zoned schools: Demoney Elementary (math 57% / reading 57%, grade C+, #436 of 616 statewide, top 74%, 493 students, 55% FRL); Estherville Lincoln Central Middle School (math 57% / reading 61%, grade B, #193 of 246 statewide, top 78%, 312 students, 53% FRL); Estherville Lincoln Central High School (math 57% / reading 78%, grade B, #186 of 336 statewide, top 57%, 384 students, 47% FRL).
- Market conditions: 45 active listings in the ZIP; 2 comparable units currently listed for rent nearby; 11 units permitted in Emmet County in 2024 (0 in 5+ unit buildings).
Forward outlook
- Local home prices are declining (-3.0%/yr); year-one equity from $546 of loan paydown is wiped out by about $2k of value loss. Plan a longer hold.
- Emmet County population projected at -23% by 2050 — secular population decline; favor cash flow + early exit over multi-decade hold.
- At projected returns (-3.0% appreciation + 3.0% rent growth), your $22k cash investment doubles in ~8 years — after that, you're playing with house money.
Negotiation context
- It's been on market 60 days — a 3% lower offer ($77k) is reasonable based on typical stale-listing flexibility.
Risks & watch-outs
- Watch-outs: built in 1900 — expect roof / HVAC / electrical / plumbing capex.
Questions for the listing agent
- It's been on market 60 days. Have you received any prior offers? Is the seller open to a 3% concession, seller financing, or rate buy-down credit?
- Built in 1900 — when were the roof, HVAC, electrical panel, plumbing, and water heater last replaced?
- Is there a deadline driving the sale (1031 exchange, divorce, estate, relocation)? That informs how much negotiation room exists.
- What's the average days-on-market for RENTAL listings here right now (not sales)? A rising rental-DOM trend means longer vacancies and softer asking-rent achievability than the comps imply.
- What's the recent tenant-quality profile in this submarket — average credit score on applications, eviction rate, late-payment / NSF rate, and stable-employment percentage? A property-management company in the area should have these aggregated.
- How much new for-sale + rental construction is in the pipeline within 1–3 miles? Heavy new supply typically softens prices + rents 12–24 months out; constrained supply supports both.
Investment metrics
- 1% rule
- 1.31% ✓
- Cap rate
- 10.84%
- Cash-on-cash
- 16.24%
- DSCR
- 1.72
- GRM
- 6.4
CMA / ARV
- ARV (on-the-fly)
- $69,012
- Comps found
- 12
Show comp detail 12 sales within ~0.75 mi
| Address | Dist | Beds/Ba | Sqft | Sold | Price | $/sf | Match |
|---|---|---|---|---|---|---|---|
| 314 7th St S | 0.00mi | 2/1.0 | 852 (0%) | 1mo | $75,000 | $88 | 99 |
| 418 S 13th St | 0.38mi | 3/1.0 (+1) | 864 (+1%) | 7mo | $81,000 | $94 | 69 |
| 215 2nd Ave S | 0.32mi | 3/1.5 (+1) | 912 (+7%) | 2mo | $74,000 | $81 | 64 |
| 1330 Central Ave | 0.49mi | 2/1.0 | 816 (-4%) | 9mo | $55,000 | $67 | 63 |
| 415 N 3rd St | 0.60mi | 2/1.0 | 888 (+4%) | 7mo | $52,500 | $59 | 59 |
| 708 S 10th St | 0.37mi | 2/1.0 | 756 (-11%) | 6mo | $33,000 | $44 | 59 |
| 1014 Central Ave | 0.30mi | 2/2.0 | 935 (+10%) | 10mo | $75,000 | $80 | 57 |
| 714 N 4th St | 0.71mi | 2/1.0 | 912 (+7%) | 9mo | $85,000 | $93 | 48 |
| 514 S 15th St | 0.53mi | 1/1.0 (-1) | 777 (-9%) | 15mo | $30,000 | $39 | 43 |
| 1427 4th Ave N | 0.71mi | 2/1.0 | 945 (+11%) | 13mo | $55,000 | $58 | 38 |
| 344 N 16th St | 0.73mi | 3/1.0 (+1) | 936 (+10%) | 10mo | $110,000 | $118 | 36 |
| 1726 1st Ave S | 0.75mi | 2/1.0 | 976 (+15%) | 9mo | $116,000 | $119 | 33 |
Match score weights: distance 35% · size 25% · config 20% · recency 20%. Top-matched comps best support the ARV.
Projected returns pro-forma
-3.0% appreciation · 3.0% rent growth · sell at horizon
- IRR
- 7.2%
- Equity multiple
- 1.28×
- Total profit
- $6,259
- Equity at exit
- $11,779
- IRR
- 16.5%
- Equity multiple
- 2.36×
- Total profit
- $29,989
- Equity at exit
- $6,830
Cash invested: $22,120 (down + closing). Projections, not guarantees.
Landlord ↔ Tenant lean methodology
- Overall (STATE)
- 83 Strongly Landlord-Friendly
- State Iowa
- 83 Strongly Landlord-Friendly · R+6
- County
- — inherits STATE
- City
- — inherits STATE
ZIP-level market 51334
- Home prices YoY
- -7.7%
- Active inventory
- 45
- Price-to-rent
- 6.4×
Monthly cashflow live
- Estimated rent
- $1,035 medium interval (Pro) →
- Mortgage (P&I)
- −$414
- Tax from tax record
- −$71 /mo · $854/yr
- Insurance
- −$33
- HOA
- −$0
- Vacancy / Maint / Mgmt
- −$217
- Net cashflow
- $299
Break-even live
Sensitivity live
| Price | -10% $344 | -5% $322 | +0% $299 | +5% $277 | +10% $255 |
|---|---|---|---|---|---|
| Rent | -10% $218 | -5% $258 | +0% $299 | +5% $340 | +10% $381 |
| Rate | -1.0pp $339 | -0.5pp $319 | base $299 | +0.5pp $279 | +1.0pp $258 |
UW: 25.0% down · 7.5% · 30yr · 1.5% tax · 5.0% vac · 8.0% maint · 8.0% mgmt
Financing live
Cash to close
- Down payment
- $19,750
- Closing costs
- $2,370
- Reserves months
- —
- Total cash needed
- —
Loan-product check · same deal, 3 products live
Conventional
25% down · 7.5% · 30yr
- Down + closing
- —
- Monthly P&I
- —
- Monthly cashflow
- —
- DSCR
- —
- Eligible?
- —
Personal DTI + credit; lowest rate.
DSCR
20% down · 8.5% · 30yr
- Down + closing
- —
- Monthly P&I
- —
- Monthly cashflow
- —
- DSCR
- —
- Eligible?
- —
No personal income docs; deal must DSCR.
Hard money
10% down · 12.0% · 12mo
- Down + closing
- —
- Monthly P&I
- —
- Monthly cashflow
- —
- DSCR
- —
- Eligible?
- —
Short-term bridge; refi at stabilization.
Rent comps 2 comps
| Address | Beds | Baths | Sqft | Rent | $/sqft | DOM | Units | Dist |
|---|---|---|---|---|---|---|---|---|
| 203 N 5th St Unit 203-2202 Estherville, IA | 2.0 | 1.0 | 914 | $1,020 | $1.12 | 45d | 1 | 0.41mi |
| 203 N 5th St Unit 203-2308 Estherville, IA | 2.0 | 1.0 | 914 | $1,050 | $1.15 | 45d | 1 | 0.41mi |
Listing history 3 events
-
2026-05-03status Pending
-
2026-04-10historical Active Under Contract
-
2026-03-04$79,000 Active
ⓘ Source: listings_history table (triggers on properties + properties_extension) + one-shot
backfill from property_details.listing_events for pre-trigger history.
Tax reassessment forecast IA · Partial reset (capped growth)
- Current annual tax
- $854 · $71/mo
- Projected year-2 tax
- $1,047 · $87/mo
- Expected delta
- +$193/yr (+$16/mo · 22.6%)
ⓘ Screening estimate from a state-policy table — verify with the county assessor before closing.
Climate risk First Street
- Flood 1/10 Low FEMA zone X (unshaded) · 0% chance over 30 yrs
- Wildfire 4/10 Moderate
- Heat 2/10 Low 7 d/yr ≥98°F today · 16 d/yr by 30 yrs out
- Wind 2/10 Low
- Air quality 1/10 Low 0 unhealthy d/yr today · 0 by 30 yrs out
Nearby sold comps map
Loading sold comps map…
Walkable amenities ~0.75 mi
Loading nearby amenities…
Taxation est. · year 1
- Rental income
- $12,420
- − Mortgage interest
- −$4,425
- − Property taxes
- −$854
- − Insurance
- −$395
- − Repairs & maintenance
- −$994
- − Management
- −$994
- − Depreciation
- −$2,298
- Taxable income
- $2,460
- Est. tax owed @ 24.0%
- −$590
- After-tax cash flow
- $3,001/yr
For passive investors: Depreciation is non-cash, so a rental often shows a tax loss while cash-flowing — sheltering income. Rental losses are passive: they offset passive income freely, and up to $25,000/yr can offset ordinary (W-2) income if you actively participate and your MAGI is under $100k (phasing out to $0 by $150k); unused losses carry forward. On sale, claimed depreciation is recaptured at up to 25%, and gains may owe capital-gains tax (a 1031 exchange can defer both). Figures are a year-1 estimate at your 24.0% rate — not tax advice; consult a CPA.
Schools (NCES district)
- District
- Estherville Lincoln Central Community School District
- NCES district ID
- 1911070
- Math proficiency
- 57% ▼ -1.00%
- Reading proficiency
- 67% ▲ 5.00%
- Median HH income
- $46,185
- Composite
- 52.33/100
- National rank
- #1588
- State rank
- #229 of 289 in IA
Livability — Estherville
- Score
- 77/100
- State rank
- #174
- US rank
- #3136
Category grades
Schools grade is shown separately in the Schools card above.
Census & demographics
- Census place
- Estherville, IA
- Population (ZIP)
- 6,827
Population outlook (Emmet County) Hauer SSP2
- Today (2025)
- 9,084 people
- By 2030
- 8,626 · -5.0%
- By 2040
- 7,751 · -14.7%
- By 2050
- 6,991 · -23.0%
- By 2075
- 5,854 · -35.6%
- By 2100
- 5,563 · -38.8%
Race, ethnicity, and origin ACS 2023
- Neighborhood character
- Predominantly White (83%)
- Race & ethnicity
- White 83% Hispanic / Latino 13% Two or more races 8% Black 2%
- Hispanic origin (detail)
- Mexican 8%
- Common ancestry
- Portuguese 10% Iranian 3% Romanian 2%
- Foreign-born
- 5% · Canada
- Languages at home
- 90% English-only · Spanish 8% German/W. Germanic 0%
Political lean MEDSL · Emmet
- 2024 margin
- Solid R (+44.0) · D 27.5% · R 71.5% · Other 1.0%
- 2008→2024 swing
- -48.0pp toward R · 2008: 3.9pp · 2024: -44.0pp
- All cycles
- 2024: R+44.0 2020: R+36.0 2016: R+37.5 2012: R+8.9 2008: D+3.9
Not yet ingested
- Civics
- —
Market trends
- HPI YoY
- ▼ -17.14%
- Current HPI
- 207.0155
- Rent YoY
- —
- Metro
- —
- State GDP YoY
- ▲ 2.48%
- F500 in state
- 4
Industry mix (Fortune 500 HQ in IA)
| Industry | F500 HQs | Revenue |
|---|---|---|
| Financial Services | 1 | $16B |
|
||
| Retail / Convenience | 1 | $15B |
|
||
Price history
3 events — show timeline
- 2026-05-03 Pending — Iowa Great Lakes BOR
- 2026-04-10 Contingent — Iowa Great Lakes BOR
- 2026-03-04 Listed $79,000 Iowa Great Lakes BOR
Property tax history
+3.5%/yrLatest (2025): $854 · -20.8% YoY. Source: county tax records.
Cash-flow waterfall
monthlySold comps — $/sqft
last 12 mo · ≤1 miLoading sold comps…