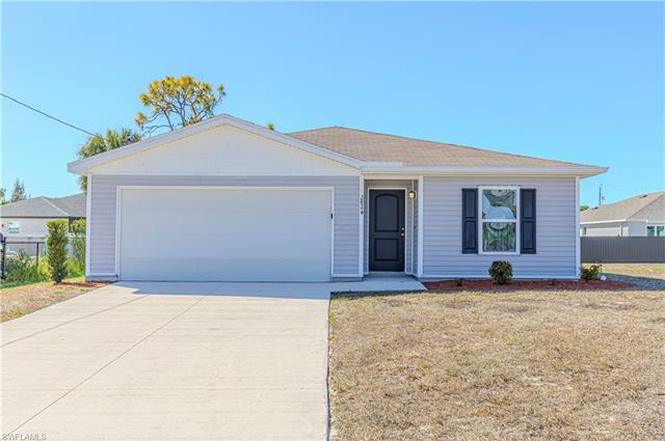
2824 NW 21st Pl · Cape Coral, FL
Flood risk 7/10 · Major
- FEMA flood zone
- X (shaded)
- Chance of flooding over 30 yrs
- 0.72%
- Est. flood insurance / yr
- $507 – $1,088
Fire risk 7/10 · Major
- Est. fire insurance / yr
- $947 – $1,759
Heat risk 10/10 · Severe
- Hot days now (above 107°F)
- 7 days/yr
- Hot days in 30 yrs
- 31 days/yr
Wind risk 10/10 · Severe
- Chance of severe wind over 30 yrs
- 99.0%
Air-quality risk 2/10 · Minimal
- Unhealthy air days now
- 1 days/yr
- Unhealthy air days in 30 yrs
- 1 days/yr
Risk factors via First Street. Map © Google.
Why this score? — see what drove the D+ grade
The composite is a weighted blend of 9 inputs, each scored 0–100. Each bar is that input's sub-score; the figure is the points it added to the 100-point composite (weight × sub-score).
- ARV discount +15.0/15.0
- Cash flow +13.3/30.0
- Schools +4.1/10.0
- DSCR +4.0/10.0
- 1% rule +3.9/10.0
- Livability +3.9/5.0
- Condition / age +2.5/5.0
- Rent growth +1.1/5.0
- Appreciation +0.0/10.0
$255,000
🖨 Deal sheet (PDF) 📄 Offer letter ✓ Due diligence
Listing remarks MLS
Welcome to 2824 NW 21st Pl! This stunning property presents an exceptional opportunity to own a beautiful home in one of Cape Coral's most desirable neighborhoods. The well-maintained exterior, spacious interior, and convenient location make this property a perfect choice for families and investors alike. Inside, you'll find 4 bedrooms and 2 baths, thoughtfully designed to provide comfort and convenience. The open floor plan seamlessly connects the living areas, creating a welcoming space for social gatherings. The kitchen, with its modern appliances and ample storage, is ideal for both meal preparation and quality time with loved ones. The home's location in Cape Coral provides easy access to nearby amenities, including shopping centers, restaurants, parks, and entertainment venues. Explore the Gulf Coast's breathtaking beaches, golf courses, and nature preserves, all within a short drive. In addition to being a comfortable family home, this property also presents a great investment opportunity. Whether you're looking for a primary residence or a rental property, 2824 NW 21st Pl offers the perfect blend of comfort, style, and potential return on investment.
Key facts
- Modern construction
- Hard flooring
- Open layout
Tags
Property features AI
Finance
- Other: Zoned R1; Lot described as regular; Lot dimensions approx. 80 x 125 (total area 0.23 acres); Canal width: None
- HOA & community: Non-gated community; No HOA maintenance or amenities
Exterior
- Parking: Attached garage with 2 spaces
- Security: Shutters (storm protection)
- Utilities: Well water; Septic sewer; Cable available
- Home design: Residential single-family home; 1 story / ranch; Rear (west) exposure; Located in Cape Coral development
- Construction: Wood frame construction; Built in 2019
- Exterior features: Shingle roof; Single hung windows; Shutters; Vinyl siding; Landscaped view; Well irrigation
Interior
- Kitchen: Electric cooktop; Disposal; Microwave
- Bedrooms: 4 bedrooms
- Flooring: Laminate flooring; Tile flooring
- Bathrooms: 2 full bathrooms; Master bath described in remarks
- Heating & cooling: Central electric heat; Central electric cooling; Ceiling fans
- Interior features: Smoke detectors; Walk-in closet; Great room floor plan; Eat-in kitchen; Unfurnished
- Laundry & utility: Washer/dryer hookup; Auto garage door opener
Neighborhood map
What this means for you Summary
Snapshot
- This is a 4-bed/2.0-bath single-family listed at $255k.
Deal economics
- At list price, monthly cash flow is $-64 ($-773/yr) — negative.
- To cash-flow at today's rent, offer at most $244k (4.5% below list).
- To meet the 1% rule (rent ≥ 1% of price), the offer needs to be $227k (11.0% below list).
- Recommended offer: $227k (11.0% below list) — sets the bar for 1% rule.
- Cap rate 6.3% vs local median 3.1% in Cape Coral — top-decile yield for the area; either an underpriced asset or a hidden risk that comps aren't pricing in. Stress-test before assuming the spread holds.
Location & tenants
- Location reads 77/100 on livability (#208 in FL, #3,098 nationally) — a middle-class / working-renter tenant base. Strengths: housing A+, health & safety A+, amenities B+; Watch: commute F.
- Lee (suburban): math 47% / reading 50% proficiency, ranked #42 of 73 in FL (top 58%) — families likely to look elsewhere, expect single-tenant / working-renter base with shorter leases.
- Zoned schools: Gulf Elementary School (math 70% / reading 65%, grade B+, #435 of 2,144 statewide, top 21%, 1,231 students, 38% FRL); Challenger Middle School (math 59% / reading 56%, grade B, #157 of 571 statewide, top 28%, 1,124 students, 50% FRL); Ida S. Baker High School (math 44% / reading 47%, grade D-, #223 of 667 statewide, top 34%, 1,933 students, 39% FRL) — zoned schools average 42% FRL vs 57% district-wide (15 pts lower); this property's tenant base skews higher-income than the district average.
- Market conditions: Rents falling (-5.5%/yr); 2671 active listings in the ZIP; 30 comparable units currently listed for rent nearby; rentals at typical pace (median 18d on market — plan ~3-4 weeks tenant-placement turnaround); solid renter incomes; 15,411 units permitted in Lee County in 2024 (4,686 in 5+ unit buildings).
- This rent runs 30% of the median local income ($91k/yr) — at the standard rent-burdened threshold; future hikes will face affordability resistance.
Forward outlook
- Local home prices are declining (-3.0%/yr); year-one equity from $2k of loan paydown is wiped out by about $8k of value loss. Plan a longer hold.
- Lee County population projected at +44% by 2050 — long-run rental-demand tailwind backs the buy-and-hold thesis.
Negotiation context
- It's been on market 115 days — a 9% lower offer ($232k) is reasonable based on typical stale-listing flexibility.
- 11 sale attempts since 8y ago; this cycle's ask has dropped $35k (12%) from the opening price — seller is motivated, your offer sets the floor, not the list.
Risks & watch-outs
- Watch-outs: flood insurance adds $66/mo.
- Climate carrying-cost: major flood risk; severe wind risk, 99% chance of damaging wind over 30y; major wildfire risk; extreme-heat days projected 7→31/yr by 2055 (HVAC capex compounding) — expect insurance premiums to compound above CPI over the hold.
Questions for the listing agent
- What do current leases actually rent for vs. the listed asking? Can we see a recent rent roll and the last 12 months of T-12 income?
- It's been on market 115 days. Have you received any prior offers? Is the seller open to a 11% concession, seller financing, or rate buy-down credit?
- What's the actual annual flood-insurance premium (NFIP or private), and is the property in a SFHA with mandatory coverage?
- Why hasn't it sold? Are there any deal-killer items the seller is aware of (foundation, flood, title, zoning, code violations)?
- Is there a deadline driving the sale (1031 exchange, divorce, estate, relocation)? That informs how much negotiation room exists.
- Schools are B-rated — typically a magnet for longer-tenancy family renters. What's the average tenant stay here, and is there a school-zone premium baked into asking?
- The area grade is low — what's the realistic commute time and amenity access for the typical tenant pool here? Any planned neighborhood developments (good or bad) we should know about?
- What's the average days-on-market for RENTAL listings here right now (not sales)? A rising rental-DOM trend means longer vacancies and softer asking-rent achievability than the comps imply.
- What's the recent tenant-quality profile in this submarket — average credit score on applications, eviction rate, late-payment / NSF rate, and stable-employment percentage? A property-management company in the area should have these aggregated.
- How much new for-sale + rental construction is in the pipeline within 1–3 miles? Heavy new supply typically softens prices + rents 12–24 months out; constrained supply supports both.
Investment metrics
- 1% rule
- 0.89% ✗
- Cap rate
- 6.30%
- Cash-on-cash
- 0.03%
- DSCR
- 1.00
- GRM
- 9.4
CMA / ARV
- ARV (on-the-fly)
- $306,819
- Comps found
- 12
Show comp detail 12 sales within ~0.75 mi
| Address | Dist | Beds/Ba | Sqft | Sold | Price | $/sf | Match |
|---|---|---|---|---|---|---|---|
| 2830 NW 19th Pl | 0.24mi | 4/2.0 | 1,426 (+2%) | 9mo | $295,000 | $207 | 78 |
| 2802 NW 22nd Pl | 0.15mi | 3/2.0 (-1) | 1,400 (-0%) | 14mo | $305,990 | $219 | 76 |
| 2903 NW 19th Pl | 0.28mi | 3/2.0 (-1) | 1,400 (-0%) | 13mo | $313,220 | $224 | 71 |
| 2324 NW 25th St | 0.57mi | 4/2.0 | 1,426 (+2%) | 1mo | $302,490 | $212 | 70 |
| 1727 NW 25th Ln | 0.59mi | 4/2.0 | 1,426 (+2%) | 6mo | $295,990 | $208 | 64 |
| 2517 NW 19th Pl | 0.50mi | 3/2.0 (-1) | 1,487 (+6%) | 1mo | $275,000 | $185 | 60 |
| 1924 NW 24th Ter | 0.60mi | 3/2.0 (-1) | 1,389 (-1%) | 11mo | $314,748 | $227 | 57 |
| 2905 NW 18th Pl | 0.40mi | 3/2.0 (-1) | 1,272 (-9%) | 11mo | $305,000 | $240 | 52 |
| 1825 Kismet Pkwy W | 0.69mi | 3/2.0 (-1) | 1,459 (+4%) | 9mo | $350,000 | $240 | 48 |
| 2540 NW 18th Pl | 0.49mi | 4/2.0 | 1,565 (+12%) | 13mo | $315,000 | $201 | 47 |
| 3114 NW 17th Ave | 0.69mi | 3/2.0 (-1) | 1,469 (+5%) | 11mo | $321,000 | $219 | 45 |
| 1622 NW 26th St | 0.69mi | 3/2.0 (-1) | 1,479 (+6%) | 12mo | $275,000 | $186 | 43 |
Match score weights: distance 35% · size 25% · config 20% · recency 20%. Top-matched comps best support the ARV.
Projected returns pro-forma
-3.0% appreciation · 0.0% rent growth · sell at horizon
- IRR
- -21.7%
- Equity multiple
- 0.27×
- Total profit
- $-51,981
- Equity at exit
- $38,021
- IRR
- -25.6%
- Equity multiple
- -0.06×
- Total profit
- $-75,876
- Equity at exit
- $22,048
Cash invested: $71,400 (down + closing). Projections, not guarantees.
Landlord ↔ Tenant lean methodology
- Overall (STATE)
- 87 Strongly Landlord-Friendly
- State Florida
- 87 Strongly Landlord-Friendly · R+3
- County
- — inherits STATE
- City
- — inherits STATE
ZIP-level market 33993
- Home prices YoY
- -14.1%
- Rents YoY
- -5.5%
- Active inventory
- 2671
- Price-to-rent
- 9.4×
Monthly cashflow live
- Estimated rent
- $2,270 high interval (Pro) →
- Mortgage (P&I)
- −$1,337
- Tax from tax record
- −$348 /mo · $4,173/yr
- Insurance
- −$106
- Flood insurance flood zone
- −$66 /mo · $798/yr
- HOA
- −$0
- Vacancy / Maint / Mgmt
- −$477
- Net cashflow
- $-64
Break-even live
Sensitivity live
| Price | -10% $80 | -5% $8 | +0% $-64 | +5% $-137 | +10% $-209 |
|---|---|---|---|---|---|
| Rent | -10% $-244 | -5% $-154 | +0% $-64 | +5% $25 | +10% $115 |
| Rate | -1.0pp $64 | -0.5pp $0 | base $-64 | +0.5pp $-130 | +1.0pp $-198 |
UW: 25.0% down · 7.5% · 30yr · 1.5% tax · 5.0% vac · 8.0% maint · 8.0% mgmt
Financing live
Cash to close
- Down payment
- $63,750
- Closing costs
- $7,650
- Reserves months
- —
- Total cash needed
- —
Loan-product check · same deal, 3 products live
Conventional
25% down · 7.5% · 30yr
- Down + closing
- —
- Monthly P&I
- —
- Monthly cashflow
- —
- DSCR
- —
- Eligible?
- —
Personal DTI + credit; lowest rate.
DSCR
20% down · 8.5% · 30yr
- Down + closing
- —
- Monthly P&I
- —
- Monthly cashflow
- —
- DSCR
- —
- Eligible?
- —
No personal income docs; deal must DSCR.
Hard money
10% down · 12.0% · 12mo
- Down + closing
- —
- Monthly P&I
- —
- Monthly cashflow
- —
- DSCR
- —
- Eligible?
- —
Short-term bridge; refi at stabilization.
Rent comps 30 comps
| Address | Beds | Baths | Sqft | Rent | $/sqft | DOM | Units | Dist |
|---|---|---|---|---|---|---|---|---|
| 2824 NW 23rd Ave Cape Coral, FL | 3.0 | 2.0 | 1462 | $1,641 | $1.12 | 23d | 1 | 0.20mi |
| 2838 NW 19th Pl Cape Coral, FL | 4.0 | 2.0 | 1650 | $1,845 | $1.12 | 25d | 1 | 0.23mi |
| 2837 NW 24th Ave Cape Coral, FL | 3.0 | 2.0 | 1286 | $4,470 | $3.48 | 25d | 1 | 0.23mi |
| 2630 NW 23rd Ave Cape Coral, FL | 3.0 | 2.0 | 1515 | $2,299 | $1.52 | 25d | 1 | 0.27mi |
| 1907 NW 26th St Cape Coral, FL | 3.0 | 2.0 | 1842 | $2,200 | $1.19 | 16d | 1 | 0.37mi |
| 2901 NW 18th Pl Cape Coral, FL | 3.0 | 2.0 | 1555 | $2,190 | $1.41 | 15d | 1 | 0.38mi |
| 1818 NW 27th Ter Cape Coral, FL | 4.0 | 2.0 | 1665 | $1,975 | $1.19 | 5d | 1 | 0.40mi |
| 1823 NW 31st St Cape Coral, FL | 3.0 | 2.0 | 1408 | $1,950 | $1.38 | 5d | 1 | 0.47mi |
| 2538 NW 24th Pl Cape Coral, FL | 4.0 | 2.0 | 1565 | $1,950 | $1.25 | 5d | 1 | 0.51mi |
| 2423 NW 19th Pl Cape Coral, FL | 4.0 | 2.0 | 1829 | $1,761 | $0.96 | 12d | 1 | 0.58mi |
| 1719 NW 25th Ln Cape Coral, FL | 4.0 | 2.0 | 1829 | $2,291 | $1.25 | 5d | 1 | 0.62mi |
| 2837 NW 27th Ave Cape Coral, FL | 3.0 | 2.0 | 1408 | $1,691 | $1.20 | 5d | 1 | 0.64mi |
| 2507 NW 25th St Cape Coral, FL | 4.0 | 2.0 | 1842 | $2,200 | $1.19 | 16d | 1 | 0.66mi |
| 2511 NW 25th St Cape Coral, FL | 4.0 | 2.0 | 1842 | $2,200 | $1.19 | 16d | 1 | 0.67mi |
| 2152 NW 22nd Pl Cape Coral, FL | 3.0 | 2.0 | 1418 | $2,550 | $1.80 | 13d | 1 | 0.80mi |
| 2206 NW 17th Pl Cape Coral, FL | 4.0 | 2.0 | 1779 | $2,075 | $1.17 | 25d | 1 | 0.92mi |
| 2329 NW 27th Ave Cape Coral, FL | 3.0 | 2.0 | 1761 | $2,300 | $1.31 | 18d | 1 | 0.92mi |
| 2800 NW 25th Ter Cape Coral, FL | 3.0 | 2.0 | 1469 | $2,000 | $1.36 | 5d | 1 | 0.96mi |
| 2105 NW 22nd Ave Cape Coral, FL | 4.0 | 2.0 | 1833 | $2,265 | $1.24 | 16d | 1 | 0.97mi |
| 2124 NW 18th Ave Cape Coral, FL | 3.0 | 2.0 | 1556 | $2,000 | $1.29 | 21d | 1 | 1.01mi |
| 2812 NW 25th St Cape Coral, FL | 4.0 | 2.0 | 1657 | $1,950 | $1.18 | 25d | 1 | 1.02mi |
| 2928 NW 27th St Cape Coral, FL | 4.0 | 2.0 | 1853 | $1,999 | $1.08 | 23d | 1 | 1.15mi |
| 2928 NW 27th St Cape Coral, FL | 4.0 | 2.0 | 1853 | $1,999 | $1.08 | 25d | 1 | 1.15mi |
| 2014 NW 16th Pl Cape Coral, FL | 4.0 | 2.0 | 1712 | $1,701 | $0.99 | 16d | 1 | 1.24mi |
| 2532 NW 31st Ave Cape Coral, FL | 3.0 | 2.0 | 1750 | $2,400 | $1.37 | 25d | 1 | 1.24mi |
| 2216 NW 18th Ter Cape Coral, FL | 3.0 | 2.0 | 1548 | $1,816 | $1.17 | 16d | 1 | 1.30mi |
| 1823 NW 19th Ave Cape Coral, FL | 4.0 | 2.0 | 1712 | $1,850 | $1.08 | 25d | 1 | 1.31mi |
| 1427 NW 20th St Cape Coral, FL | 4.0 | 2.0 | 1617 | $1,895 | $1.17 | 18d | 1 | 1.38mi |
| 1809 NW 17th Ter Cape Coral, FL | 3.0 | 2.0 | 1750 | $1,980 | $1.13 | 25d | 1 | 1.45mi |
| 2227 NW 11th Ct Cape Coral, FL | 4.0 | 2.0 | 1650 | $1,895 | $1.15 | 25d | 1 | 1.47mi |
Listing history 50 events
-
2026-06-22days on market $255,000 Active 115 DOM
-
2026-06-17days on market $255,000 Active 111 DOM
-
2026-06-16days on market $255,000 Active 110 DOM
-
2026-06-15days on market $255,000 Active 109 DOM
-
2026-06-13pricedays on market $255,000 Active 107 DOM
-
2026-06-10days on market $262,500 Active 104 DOM
-
2026-06-09days on market $262,500 Active 103 DOM
-
2026-06-07days on market $262,500 Active 101 DOM
-
2026-06-02days on market $262,500 Active 96 DOM
-
2026-06-01days on market $262,500 Active 95 DOM
-
2026-06-01days on market $262,500 Active 94 DOM
-
2026-05-22price $262,500
-
2026-05-01price $270,000
-
2026-04-07price $277,500
-
2026-03-13price $285,000
-
2026-02-26$289,900 Active
-
2025-11-18soldstatus $930,300
-
2025-11-05historical $1,610
-
2025-10-10historical $1,675
-
2025-10-10$1,675
-
2025-08-29price $1,675
-
2025-07-16$1,945
-
2025-07-15historical $1,945
-
2025-07-03$1,945
-
2025-07-03historical $1,945
-
2025-06-29$1,945
-
2025-06-28historical $2,295
-
2025-05-10price $2,295
-
2025-04-23price $2,395
-
2024-11-15price $2,525
-
2024-06-28$2,425
-
2024-05-24historical $2,525
-
2024-05-14soldstatus $571,500
-
2024-05-14price $2,525
-
2024-03-07$2,575
-
2024-03-02historical $2,575
-
2023-11-22$2,575
-
2023-10-19soldstatus $296,000
-
2023-10-18soldstatus $296,000 Closed 1176-char remark
Show marketing remark (1176 chars)
Welcome to 2824 NW 21st Pl! This stunning property presents an exceptional opportunity to own a beautiful home in one of Cape Coral's most desirable neighborhoods. The well-maintained exterior, spacious interior, and convenient location make this property a perfect choice for families and investors alike. Inside, you'll find 4 bedrooms and 2 baths, thoughtfully designed to provide comfort and convenience. The open floor plan seamlessly connects the living areas, creating a welcoming space for social gatherings. The kitchen, with its modern appliances and ample storage, is ideal for both meal preparation and quality time with loved ones. The home's location in Cape Coral provides easy access to nearby amenities, including shopping centers, restaurants, parks, and entertainment venues. Explore the Gulf Coast's breathtaking beaches, golf courses, and nature preserves, all within a short drive. In addition to being a comfortable family home, this property also presents a great investment opportunity. Whether you're looking for a primary residence or a rental property, 2824 NW 21st Pl offers the perfect blend of comfort, style, and potential return on investment.
-
2023-06-21status Pending 1176-char remark
Show marketing remark (1176 chars)
Welcome to 2824 NW 21st Pl! This stunning property presents an exceptional opportunity to own a beautiful home in one of Cape Coral's most desirable neighborhoods. The well-maintained exterior, spacious interior, and convenient location make this property a perfect choice for families and investors alike. Inside, you'll find 4 bedrooms and 2 baths, thoughtfully designed to provide comfort and convenience. The open floor plan seamlessly connects the living areas, creating a welcoming space for social gatherings. The kitchen, with its modern appliances and ample storage, is ideal for both meal preparation and quality time with loved ones. The home's location in Cape Coral provides easy access to nearby amenities, including shopping centers, restaurants, parks, and entertainment venues. Explore the Gulf Coast's breathtaking beaches, golf courses, and nature preserves, all within a short drive. In addition to being a comfortable family home, this property also presents a great investment opportunity. Whether you're looking for a primary residence or a rental property, 2824 NW 21st Pl offers the perfect blend of comfort, style, and potential return on investment.
-
2023-06-13$291,200 Active 1176-char remark
Show marketing remark (1176 chars)
Welcome to 2824 NW 21st Pl! This stunning property presents an exceptional opportunity to own a beautiful home in one of Cape Coral's most desirable neighborhoods. The well-maintained exterior, spacious interior, and convenient location make this property a perfect choice for families and investors alike. Inside, you'll find 4 bedrooms and 2 baths, thoughtfully designed to provide comfort and convenience. The open floor plan seamlessly connects the living areas, creating a welcoming space for social gatherings. The kitchen, with its modern appliances and ample storage, is ideal for both meal preparation and quality time with loved ones. The home's location in Cape Coral provides easy access to nearby amenities, including shopping centers, restaurants, parks, and entertainment venues. Explore the Gulf Coast's breathtaking beaches, golf courses, and nature preserves, all within a short drive. In addition to being a comfortable family home, this property also presents a great investment opportunity. Whether you're looking for a primary residence or a rental property, 2824 NW 21st Pl offers the perfect blend of comfort, style, and potential return on investment.
-
2020-04-03soldstatus $1,438,500
-
2020-04-01historical
-
2020-03-17status Pending
-
2020-03-03price $171,490
-
2020-02-07price $184,490
-
2019-12-10price $176,490
-
2019-10-31price $174,990
-
2019-08-17price $169,990
-
2019-08-07status Active
ⓘ Source: listings_history table (triggers on properties + properties_extension) + one-shot
backfill from property_details.listing_events for pre-trigger history.
Tax reassessment forecast FL · Resets to sale price
- Current annual tax
- $4,173 · $348/mo
- Projected year-2 tax
- $4,173 · $348/mo
- Expected delta
- $0/yr ($0/mo · 0.0%)
ⓘ Screening estimate from a state-policy table — verify with the county assessor before closing.
Climate risk First Street
- Flood 7/10 Severe FEMA zone X (shaded) · 72% chance over 30 yrs
- Wildfire 7/10 Severe
- Heat 10/10 Extreme 7 d/yr ≥107°F today · 31 d/yr by 30 yrs out
- Wind 10/10 Extreme 99% chance of damaging wind over 30 yrs
- Air quality 2/10 Low 1 unhealthy d/yr today · 1 by 30 yrs out
Nearby sold comps map
Loading sold comps map…
Walkable amenities ~0.75 mi
Loading nearby amenities…
Taxation est. · year 1
- Rental income
- $27,241
- − Mortgage interest
- −$14,284
- − Property taxes
- −$4,173
- − Insurance
- −$2,072
- − Repairs & maintenance
- −$2,179
- − Management
- −$2,179
- − Depreciation
- −$7,418
- Taxable loss
- −$5,066
- Est. tax savings @ 24.0%
- +$1,216
- After-tax cash flow
- $443/yr
For passive investors: Depreciation is non-cash, so a rental often shows a tax loss while cash-flowing — sheltering income. Rental losses are passive: they offset passive income freely, and up to $25,000/yr can offset ordinary (W-2) income if you actively participate and your MAGI is under $100k (phasing out to $0 by $150k); unused losses carry forward. On sale, claimed depreciation is recaptured at up to 25%, and gains may owe capital-gains tax (a 1031 exchange can defer both). Figures are a year-1 estimate at your 24.0% rate — not tax advice; consult a CPA.
Schools (NCES district)
- District
- Lee
- NCES district ID
- 1201080
- Math proficiency
- 47% ▼ -11.00%
- Reading proficiency
- 50% ▼ -4.00%
- Median HH income
- $49,518
- Composite
- 41.49/100
- National rank
- #3458
- State rank
- #42 of 73 in FL
Livability — Cape Coral
- Score
- 77/100
- State rank
- #208
- US rank
- #3098
Category grades
Schools grade is shown separately in the Schools card above.
Census & demographics
- Census place
- Cape Coral, FL
- County
- Lee County · 788,662 people
- City population
- 217,388
- Metro
- Cape Coral-Fort Myers, FL
- Population (ZIP)
- 35,580
- Household income
- $90,577
- Rent vs Own
- Severe rent burden
- 286.0
Population outlook (Lee County) Hauer SSP2
- Today (2025)
- 871,946 people
- By 2030
- 955,468 · +9.6%
- By 2040
- 1,113,587 · +27.7%
- By 2050
- 1,256,891 · +44.1%
- By 2075
- 1,560,270 · +78.9%
- By 2100
- 1,726,848 · +98.0%
Race, ethnicity, and origin ACS 2023
- Neighborhood character
- Diverse neighborhood (Simpson 0.58)
- Race & ethnicity
- White 57% Hispanic / Latino 30% Two or more races 21% Black 7% Asian 2%
- Hispanic origin (detail)
- Mexican 2% Puerto Rican 6% Cuban 17% Dominican 1%
- Common ancestry
- Romanian 2% Hispanic 2% Lithuanian 2%
- Foreign-born
- 21% · Canada, Jamaica, China
- Languages at home
- 73% English-only · Spanish 24% French/Haitian/Cajun 1% Russian/Polish/Slavic 1%
Political lean MEDSL · Lee
- 2024 margin
- Strong R (+28.4) · D 35.5% · R 63.9%
- 2008→2024 swing
- -18.0pp toward R · 2008: -10.4pp · 2024: -28.4pp
- All cycles
- 2024: R+28.4 2020: R+19.2 2016: R+20.4 2012: R+16.6 2008: R+10.4
Not yet ingested
- Civics
- —
Market trends
- HPI YoY
- ▼ -55.34%
- Current HPI
- 337.0575
- Rent YoY
- ▼ -5.51%
- Metro
- Cape Coral-Fort Myers, FL
- State GDP YoY
- ▲ 3.28%
- F500 in state
- 36
Industry mix (Fortune 500 HQ in FL)
| Industry | F500 HQs | Revenue |
|---|---|---|
| Industrial Technology | 2 | $29B |
|
||
| Insurance | 2 | $17B |
|
||
| Retail | 1 | $60B |
|
||
| Technology Distribution | 1 | $58B |
|
||
| Homebuilding | 1 | $35B |
|
||
| Technology Manufacturing | 1 | $35B |
|
||
Price history
+3447.3% since first listed55 events — show timeline
- 2026-05-22 Price Changed $262,500 NAPLESMLS
- 2026-05-01 Price Changed $270,000 NAPLESMLS
- 2026-04-07 Price Changed $277,500 NAPLESMLS
- 2026-03-13 Price Changed $285,000 NAPLESMLS
- 2026-02-26 Listed $289,900 NAPLESMLS
- 2025-11-18 Sold (Public Records) $930,300 Public Records
- 2025-11-05 Rental Removed $1,610 FORTMLS
- 2025-10-10 Rental Removed $1,675 NAPLESMLS
- 2025-10-10 Listed for Rent $1,675 NAPLESMLS
- 2025-08-29 Price Changed $1,675 FORTMLS
- 2025-07-16 Listed for Rent $1,945 FORTMLS
- 2025-07-15 Rental Removed $1,945 FORTMLS
- 2025-07-03 Listed for Rent $1,945 FORTMLS
- 2025-07-03 Rental Removed $1,945 MAINSTREETRENEWAL
- 2025-06-29 Listed for Rent $1,945 MAINSTREETRENEWAL
- 2025-06-28 Rental Removed $2,295 STELLARMLS
- 2025-05-10 Price Changed $2,295 STELLARMLS
- 2025-04-23 Price Changed $2,395 STELLARMLS
- 2024-11-15 Price Changed $2,525 STELLARMLS
- 2024-06-28 Listed for Rent $2,425 STELLARMLS
- 2024-05-24 Rental Removed $2,525 FORTMLS
- 2024-05-14 Sold (Public Records) $571,500 Public Records
- 2024-05-14 Price Changed $2,525 FORTMLS
- 2024-03-07 Listed for Rent $2,575 FORTMLS
- 2024-03-02 Rental Removed $2,575 FORTMLS
- 2023-11-22 Listed for Rent $2,575 FORTMLS
- 2023-10-19 Sold (Public Records) $296,000 Public Records
- 2023-10-18 Sold (MLS) $296,000 FORTMLS
- 2023-06-21 Pending — FORTMLS
- 2023-06-13 Listed $291,200 FORTMLS
- 2020-04-03 Sold (Public Records) $1,438,500 Public Records
- 2020-04-01 Listing Removed — FORTMLS
- 2020-03-17 Pending — FORTMLS
- 2020-03-03 Price Changed $171,490 FORTMLS
- 2020-02-07 Price Changed $184,490 FORTMLS
- 2019-12-10 Price Changed $176,490 FORTMLS
- 2019-10-31 Price Changed $174,990 FORTMLS
- 2019-08-17 Price Changed $169,990 FORTMLS
- 2019-08-07 Relisted — FORTMLS
- 2019-07-19 Listing Removed — FORTMLS
- 2019-06-19 Price Changed $159,990 FORTMLS
- 2019-06-18 Price Changed $164,490 FORTMLS
- 2019-06-14 Price Changed $159,990 FORTMLS
- 2019-06-14 Price Changed $164,490 FORTMLS
- 2019-05-17 Price Changed $164,990 FORTMLS
- 2019-05-02 Price Changed $169,990 FORTMLS
- 2019-03-01 Price Changed $167,990 FORTMLS
- 2019-01-25 Price Changed $169,990 FORTMLS
- 2019-01-15 Price Changed $173,490 FORTMLS
- 2018-10-22 Price Changed $169,990 FORTMLS
- 2018-06-04 Price Changed $173,490 FORTMLS
- 2018-05-23 Sold (Public Records) $77,000 Public Records
- 2018-05-17 Listed $186,490 FORTMLS
- 2013-09-12 Price Changed $7,699 FORTMLS
- 2013-09-06 Sold (MLS) $7,400 FORTMLS
Property tax history
+27.2%/yrLatest (2025): $4,173 · -2.6% YoY. Source: county tax records.
Cash-flow waterfall
monthlySold comps — $/sqft
last 12 mo · ≤1 miLoading sold comps…