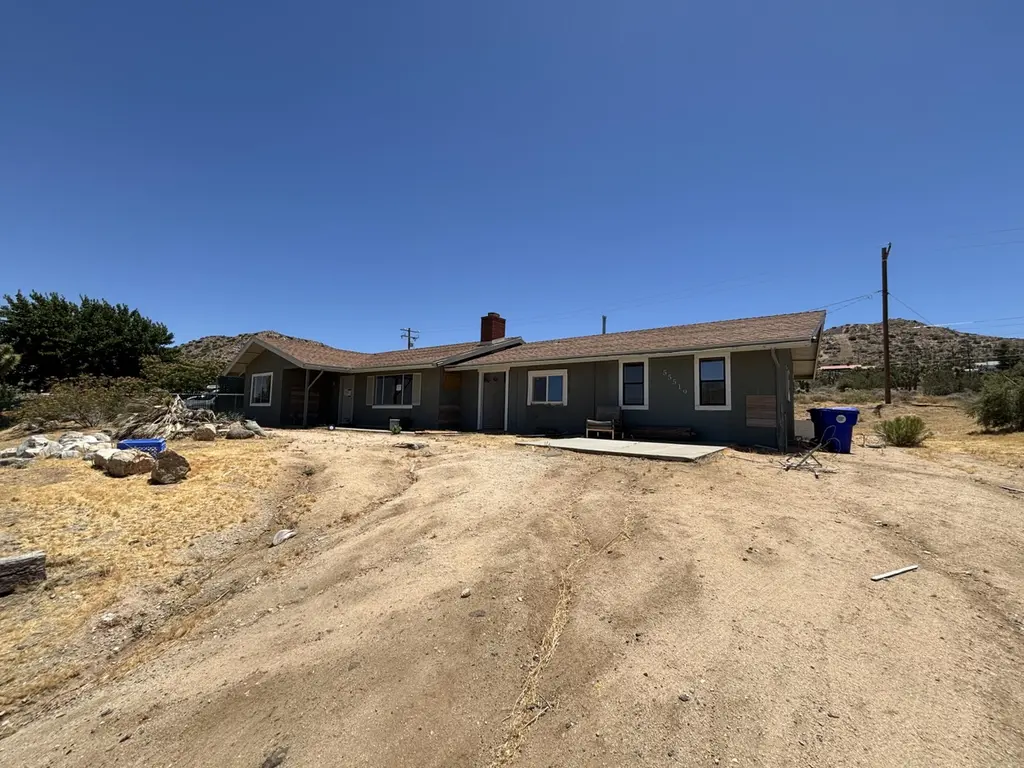
55519 Iona Ln · Yucca Valley, CA
Flood risk 1/10 · Minimal
- FEMA flood zone
- D
- Chance of flooding over 30 yrs
- 0.0%
- Est. flood insurance / yr
- $544 – $1,084
Fire risk 6/10 · Moderate
- Est. fire insurance / yr
- $659 – $1,223
Heat risk 6/10 · Moderate
- Hot days now (above 95°F)
- 7 days/yr
- Hot days in 30 yrs
- 21 days/yr
Wind risk 1/10 · Minimal
- Chance of severe wind over 30 yrs
- —
Air-quality risk 6/10 · Moderate
- Unhealthy air days now
- 12 days/yr
- Unhealthy air days in 30 yrs
- 14 days/yr
Risk factors via First Street. Map © Google.
Why this score? — see what drove the C- grade
The composite is a weighted blend of 9 inputs, each scored 0–100. Each bar is that input's sub-score; the figure is the points it added to the 100-point composite (weight × sub-score).
- Cash flow +15.6/30.0
- ARV discount +15.0/15.0
- DSCR +4.8/10.0
- 1% rule +4.5/10.0
- Rent growth +3.5/5.0
- Livability +3.0/5.0
- Condition / age +2.5/5.0
- Schools +2.2/10.0
- Appreciation +0.0/10.0
$264,900
🖨 Deal sheet (PDF) 📄 Offer letter ✓ Due diligence
Listing remarks
Bring your vision to 55519 Iona Lane in Yucca Valley, a high-desert property set on an approximately 0.34-acre lot with beautiful surrounding mountain views and a spacious yard. This single-level home offers 4 bedrooms, 2 bathrooms, large windows, an open living area with a white brick fireplace, and sliding glass doors leading to a covered patio and outdoor space. The kitchen area opens toward the main living spaces, creating potential for a functional redesign or renovation. Additional features include interior laundry/utility space, a detached structure/outbuilding, and ample exterior space for parking, storage, outdoor living, or future improvements. Conveniently located near local shop
Key facts
- Spacious yard
- Detached structure
- Covered patio
Tags
Property features AI
Finance
- Other: Property sold as real estate owned (REO); Property offered as-is
- Financial info: Has rental restrictions
- HOA & community: No monthly association fees
Exterior
- Parking: Driveway parking; Attached garage; 2 total parking spaces (2 covered)
- Security: No security/safety features listed
- Utilities: Water provided by Hi-Desert Water District; Septic tank
- Home design: Ranch-style single-family home; Detached property; One story; Composition shingle roof
- Construction: Stucco exterior; Slab foundation; Year built (assessor)
- Exterior features: Covered patio; Wheelchair modifications (disability access); No fencing; Has view of desert and mountains
Interior
- Kitchen: Electric range; Microwave oven
- Bedrooms: All bedrooms on main floor; Main floor master bedroom; Main floor bedroom(s)
- Flooring: Concrete floors
- Bathrooms: 2 full bathrooms; Shower and tub; Shower over tub; Tile countertops
- Heating & cooling: Fireplace heating; Central air conditioning; One fireplace (living room) with raised brick hearth
- Interior features: Open floorplan; Storage; Stacked laundry in closet; Ground-level entry with no steps; Sliding doors; Blinds; Unfurnished
- Laundry & utility: Individual laundry room; Stacked washer/dryer closet
Neighborhood map
What this means for you Summary
Snapshot
- This is a 4-bed/2.0-bath single-family listed at $265k.
Deal economics
- At list price, monthly cash flow is $113 ($1k/yr) — positive.
- The deal already cash-flows at list — no discount required.
- To meet the 1% rule (rent ≥ 1% of price), the offer needs to be $252k (5.0% below list).
- Recommended offer: $252k (5.0% below list) — sets the bar for 1% rule.
- Cap rate 6.8% vs local median 3.6% in Yucca Valley — top-decile yield for the area; either an underpriced asset or a hidden risk that comps aren't pricing in. Stress-test before assuming the spread holds.
Location & tenants
- Location reads 60/100 on livability (#566 in CA) — a middle-class / working-renter tenant base. Strengths: commute A+, housing A+; Watch: cost of living D+, crime D-, amenities D-.
- Morongo Unified (town): math 15% / reading 38% proficiency, ranked #395 of 517 in CA (top 76%) — low school quality limits family demand, transient renter base, plan for 1-2y turnover.
- Zoned schools: Yucca Valley Elementary (544 students, 76% FRL); La Contenta Middle (math 11% / reading 27%, grade F, #426 of 498 statewide, top 86%, 650 students, 72% FRL); Yucca Valley High (math 15% / reading 49%, grade F, #674 of 1,170 statewide, top 59%, 1,264 students, 64% FRL).
- Market conditions: Rents rising fast (+4.1%/yr); 573 active listings in the ZIP; 6 comparable units currently listed for rent nearby; rentals lingering (median 46d on market — plan ~5-8 weeks vacancy on turnover, expect pricing pressure); 50% of comp listings sitting > 30 days — soft ceiling on asking rent; 5,458 units permitted in San Bernardino County in 2024 (1,500 in 5+ unit buildings).
- At $2,518/mo this rent would consume 52% of the median local household income ($58k/yr) (locally 1132% of renters already pay >50% of income on rent) — very limited rent-growth headroom before tenants either downsize or default.
Forward outlook
- Local home prices are declining (-3.0%/yr); year-one equity from $2k of loan paydown is wiped out by about $8k of value loss. Plan a longer hold.
- San Bernardino County population projected at +15% by 2050 — modest demand growth; plan on rents tracking national, not racing it.
Negotiation context
- It's been on market 18 days — a 2% lower offer ($261k) is reasonable based on typical stale-listing flexibility.
- 11 sale attempts since 16y ago with the ask held roughly flat each time — persistent listings suggest the price (not the market) is what's stuck; bring a comps-based counter.
Risks & watch-outs
- Climate carrying-cost: major wildfire risk; extreme-heat days projected 7→21/yr by 2055 (HVAC capex compounding) — expect insurance premiums to compound above CPI over the hold.
Questions for the listing agent
- Built in 1972 — when were the roof, HVAC, electrical panel, plumbing, and water heater last replaced?
- Is there a deadline driving the sale (1031 exchange, divorce, estate, relocation)? That informs how much negotiation room exists.
- Schools are F-rated, which usually means shorter tenancies and higher turnover. Who's the typical renter profile here, and what's been the actual vacancy rate?
- Crime grade is D in this area — have there been break-ins, vandalism, or insurance claims at this property in the last 3 years? What carrier currently insures it and at what premium?
- What's the average days-on-market for RENTAL listings here right now (not sales)? A rising rental-DOM trend means longer vacancies and softer asking-rent achievability than the comps imply.
- What's the recent tenant-quality profile in this submarket — average credit score on applications, eviction rate, late-payment / NSF rate, and stable-employment percentage? A property-management company in the area should have these aggregated.
- How much new for-sale + rental construction is in the pipeline within 1–3 miles? Heavy new supply typically softens prices + rents 12–24 months out; constrained supply supports both.
Investment metrics
- 1% rule
- 0.95% ✗
- Cap rate
- 6.81%
- Cash-on-cash
- 1.83%
- DSCR
- 1.08
- GRM
- 8.8
CMA / ARV
- ARV (on-the-fly)
- $391,179
- Comps found
- 10
Show comp detail 10 sales within ~0.75 mi
| Address | Dist | Beds/Ba | Sqft | Sold | Price | $/sf | Match |
|---|---|---|---|---|---|---|---|
| 7990 Redden Ln | 0.42mi | 3/2.0 (-1) | 1,560 (-1%) | 19mo | $180,000 | $115 | 58 |
| 55856 Mountain View Trl | 0.54mi | 4/2.0 | 1,646 (+5%) | 10mo | $360,000 | $219 | 58 |
| 55920 El Dorado Dr | 0.56mi | 3/2.0 (-1) | 1,528 (-3%) | 12mo | $380,000 | $249 | 54 |
| 55900 El Dorado | 0.54mi | 3/2.0 (-1) | 1,451 (-8%) | 4mo | $419,900 | $289 | 54 |
| 55925 Desert Gold Dr | 0.56mi | 3/2.0 (-1) | 1,510 (-4%) | 12mo | $340,000 | $225 | 52 |
| 7608 Shawnee Trl | 0.70mi | 3/3.0 (-1) | 1,532 (-2%) | 12mo | $340,000 | $222 | 44 |
| 8470 Bannock Trl | 0.67mi | 3/2.0 (-1) | 1,494 (-5%) | 14mo | $400,000 | $268 | 44 |
| 7667 Jemez Trl | 0.63mi | 3/1.0 (-1) | 1,456 (-7%) | 9mo | $325,000 | $223 | 41 |
| 8064 Acoma Trl | 0.71mi | 3/2.0 (-1) | 1,694 (+8%) | 18mo | $469,900 | $277 | 34 |
| 55026 Hoopa Trl | 0.67mi | 3/2.0 (-1) | 1,344 (-14%) | 23mo | $380,000 | $283 | 20 |
Match score weights: distance 35% · size 25% · config 20% · recency 20%. Top-matched comps best support the ARV.
Projected returns pro-forma
-3.0% appreciation · 4.12% rent growth · sell at horizon
- IRR
- -12.1%
- Equity multiple
- 0.56×
- Total profit
- $-32,776
- Equity at exit
- $39,497
- IRR
- -1.3%
- Equity multiple
- 0.91×
- Total profit
- $-6,939
- Equity at exit
- $22,904
Cash invested: $74,172 (down + closing). Projections, not guarantees.
Landlord ↔ Tenant lean methodology
- Overall (STATE)
- 18 Strongly Tenant-Friendly
- State California
- 18 Strongly Tenant-Friendly · D+13
- County
- — inherits STATE
- City
- — inherits STATE
ZIP-level market 92284
- Home prices YoY
- -33.1%
- Rents YoY
- 4.1%
- Active inventory
- 573
- Price-to-rent
- 8.8×
Monthly cashflow live
- Estimated rent
- $2,518 high interval (Pro) →
- Mortgage (P&I)
- −$1,389
- Tax from tax record
- −$376 /mo · $4,515/yr
- Insurance
- −$110
- HOA
- −$0
- Vacancy / Maint / Mgmt
- −$529
- Net cashflow
- $113
Break-even live
Sensitivity live
| Price | -10% $263 | -5% $188 | +0% $113 | +5% $38 | +10% $-37 |
|---|---|---|---|---|---|
| Rent | -10% $-86 | -5% $14 | +0% $113 | +5% $213 | +10% $312 |
| Rate | -1.0pp $247 | -0.5pp $181 | base $113 | +0.5pp $45 | +1.0pp $-25 |
UW: 25.0% down · 7.5% · 30yr · 1.5% tax · 5.0% vac · 8.0% maint · 8.0% mgmt
Financing live
Cash to close
- Down payment
- $66,225
- Closing costs
- $7,947
- Reserves months
- —
- Total cash needed
- —
Loan-product check · same deal, 3 products live
Conventional
25% down · 7.5% · 30yr
- Down + closing
- —
- Monthly P&I
- —
- Monthly cashflow
- —
- DSCR
- —
- Eligible?
- —
Personal DTI + credit; lowest rate.
DSCR
20% down · 8.5% · 30yr
- Down + closing
- —
- Monthly P&I
- —
- Monthly cashflow
- —
- DSCR
- —
- Eligible?
- —
No personal income docs; deal must DSCR.
Hard money
10% down · 12.0% · 12mo
- Down + closing
- —
- Monthly P&I
- —
- Monthly cashflow
- —
- DSCR
- —
- Eligible?
- —
Short-term bridge; refi at stabilization.
Rent comps 6 comps
| Address | Beds | Baths | Sqft | Rent | $/sqft | DOM | Units | Dist |
|---|---|---|---|---|---|---|---|---|
| 8419 Elk Trl Yucca Valley, CA | 4.0 | 2.0 | 2011 | $2,900 | $1.44 | 21d | 1 | 0.49mi |
| 7420 Geronimo Trl Yucca Valley, CA | 3.0 | 1.0 | 1280 | $1,700 | $1.33 | 45d | 1 | 0.94mi |
| 55897 Santa Fe Trl Yucca Valley, CA | 3.0 | 2.0 | 1701 | $2,300 | $1.35 | 4d | 1 | 1.08mi |
| 54822 El Prado Trl Yucca Valley, CA | 3.0 | 2.0 | 1494 | $2,595 | $1.74 | 45d | 1 | 1.27mi |
| 7592 Pinon Dr Yucca Valley, CA | 3.0 | 2.0 | 1542 | $2,200 | $1.43 | 0d | 1 | 1.30mi |
| 56594 Joshua Dr Yucca Valley, CA | 3.0 | 2.0 | 1307 | $2,250 | $1.72 | 45d | 1 | 1.35mi |
Listing history 12 events
-
2026-06-21days on market $264,900 Active 18 DOM
-
2026-06-18days on market $264,900 Active 15 DOM
-
2026-06-17days on market $264,900 Active 14 DOM
-
2026-06-16days on market $264,900 Active 13 DOM
-
2026-06-15days on market $264,900 Active 12 DOM
-
2026-06-13days on market $264,900 Active 10 DOM
-
2026-06-13days on market $264,900 Active 9 DOM
-
2026-06-09days on market $264,900 Active 6 DOM
-
2026-06-08days on market $264,900 Active 5 DOM
-
2026-06-07days on market $264,900 Active 4 DOM
-
2026-06-04remarks 699-char remark
-
2026-06-04$264,900 Active 1 DOM
ⓘ Source: listings_history table (triggers on properties + properties_extension) + one-shot
backfill from property_details.listing_events for pre-trigger history.
Tax reassessment forecast CA · Resets to sale price
- Current annual tax
- $4,515 · $376/mo
- Projected year-2 tax
- $4,515 · $376/mo
- Expected delta
- $0/yr ($0/mo · 0.0%)
ⓘ Screening estimate from a state-policy table — verify with the county assessor before closing.
Climate risk First Street
- Flood 1/10 Low FEMA zone D · 0% chance over 30 yrs
- Wildfire 6/10 Major
- Heat 6/10 Major 7 d/yr ≥95°F today · 21 d/yr by 30 yrs out
- Wind 1/10 Low
- Air quality 6/10 Major 12 unhealthy d/yr today · 14 by 30 yrs out
Nearby sold comps map
Loading sold comps map…
Walkable amenities ~0.75 mi
Loading nearby amenities…
Taxation est. · year 1
- Rental income
- $30,214
- − Mortgage interest
- −$14,839
- − Property taxes
- −$4,515
- − Insurance
- −$1,324
- − Repairs & maintenance
- −$2,417
- − Management
- −$2,417
- − Depreciation
- −$7,706
- Taxable loss
- −$3,005
- Est. tax savings @ 24.0%
- +$721
- After-tax cash flow
- $2,080/yr
For passive investors: Depreciation is non-cash, so a rental often shows a tax loss while cash-flowing — sheltering income. Rental losses are passive: they offset passive income freely, and up to $25,000/yr can offset ordinary (W-2) income if you actively participate and your MAGI is under $100k (phasing out to $0 by $150k); unused losses carry forward. On sale, claimed depreciation is recaptured at up to 25%, and gains may owe capital-gains tax (a 1031 exchange can defer both). Figures are a year-1 estimate at your 24.0% rate — not tax advice; consult a CPA.
Schools (NCES district)
- District
- Morongo Unified
- NCES district ID
- 0625860
- Math proficiency
- 15% ▼ -12.00%
- Reading proficiency
- 38% ▼ -3.00%
- Median HH income
- $39,399
- Composite
- 22.19/100
- National rank
- #8156
- State rank
- #395 of 517 in CA
Livability — Yucca Valley
- Score
- 60/100
- State rank
- #566
- US rank
- #18584
Category grades
Schools grade is shown separately in the Schools card above.
Census & demographics
- Census place
- Yucca Valley, CA
- County
- San Bernardino County · 2,030,291 people
- City population
- 25,415
- Metro
- Riverside-San Bernardino-Ontario, CA
- Population (ZIP)
- 25,415
- Household income
- $58,373
- Rent vs Own
- Severe rent burden
- 1132.0
Population outlook (San Bernardino County) Hauer SSP2
- Today (2025)
- 2,300,329 people
- By 2030
- 2,378,907 · +3.4%
- By 2040
- 2,523,137 · +9.7%
- By 2050
- 2,642,388 · +14.9%
- By 2075
- 2,880,769 · +25.2%
- By 2100
- 2,909,436 · +26.5%
Race, ethnicity, and origin ACS 2023
- Neighborhood character
- Diverse neighborhood (Simpson 0.55)
- Race & ethnicity
- White 62% Hispanic / Latino 25% Two or more races 18% Black 2% Native American 2% Asian 2% Pacific Islander 1%
- Hispanic origin (detail)
- Mexican 20%
- Common ancestry
- Italian 4% Romanian 2% Slovak 2%
- Foreign-born
- 9% · Canada
- Languages at home
- 82% English-only · Spanish 14% Other Indo-European 1% Other Asian/Pacific 1%
Political lean MEDSL · San Bernardino
- 2024 margin
- Toss-up / Even · D 47.5% · R 49.7% · Other 2.8%
- 2008→2024 swing
- -8.5pp toward R · 2008: 6.3pp · 2024: -2.1pp
- All cycles
- 2024: R+2.1 2020: D+10.7 2016: D+9.8 2012: D+5.4 2008: D+6.3
Not yet ingested
- Civics
- —
Market trends
- HPI YoY
- ▼ -241.13%
- Current HPI
- 486.7185
- Rent YoY
- ▲ 4.12%
- Metro
- Riverside-San Bernardino-Ontario, CA
- State GDP YoY
- ▲ 3.21%
- F500 in state
- 116
Industry mix (Fortune 500 HQ in CA)
| Industry | F500 HQs | Revenue |
|---|---|---|
| Technology | 27 | $1,492B |
|
||
| Financial Services | 3 | $174B |
|
||
| Retail | 3 | $44B |
|
||
| Insurance | 3 | $26B |
|
||
| Media / Entertainment | 2 | $115B |
|
||
| Pharmaceuticals / Biotech | 2 | $62B |
|
||
Price history
+368.8% since first listed39 events — show timeline
- 2026-06-02 Listed $264,900 GPSMLS
- 2026-03-13 Listing Removed — CRMLS
- 2026-03-11 Price Changed $270,000 CRMLS
- 2026-02-27 Price Changed $188,000 CRMLS
- 2026-02-19 Listed $268,000 CRMLS
- 2026-02-19 Coming Soon — CRMLS
- 2024-05-02 Listing Removed — CRMLS
- 2024-04-29 Relisted — CRMLS
- 2024-04-29 Price Changed $360,000 CRMLS
- 2024-04-10 Pending — CRMLS
- 2024-02-25 Listed $338,888 CRMLS
- 2022-09-17 Listing Removed — CRMLS
- 2022-08-25 Price Changed $328,000 CRMLS
- 2022-07-07 Price Changed $298,000 CRMLS
- 2022-07-05 Price Changed $168,000 CRMLS
- 2022-06-19 Listed $188,000 CRMLS
- 2022-06-16 Listing Removed — CRMLS
- 2022-06-10 Price Changed $398,000 CRMLS
- 2022-05-31 Price Changed $438,000 CRMLS
- 2022-05-09 Listed $488,000 CRMLS
- 2022-04-25 Coming Soon — CRMLS
- 2022-03-11 Sold (MLS) $316,000 CRMLS
- 2022-03-02 Pending — CRMLS
- 2022-01-27 Relisted — CRMLS
- 2021-11-19 Contingent — CRMLS
- 2021-10-18 Listed $345,000 CRMLS
- 2021-09-28 Coming Soon $345,000 CRMLS
- 2021-01-02 Listing Removed — GPSMLS
- 2021-01-02 Pending — GPSMLS
- 2020-12-18 Listed $325,000 GPSMLS
- 2020-12-16 Coming Soon — GPSMLS
- 2010-07-14 Sold (MLS) $50,000 CRMLS
- 2010-06-29 Listing Removed — CRMLS
- 2010-06-02 Listed $39,900 CRMLS
- 2010-05-10 Listing Removed — GPSMLS
- 2010-04-14 Listed $79,900 GPSMLS
- 2001-02-28 Sold (Public Records) $48,000 Public Records
- 1993-10-18 Sold (Public Records) $41,000 Public Records
- 1990-12-12 Sold (Public Records) $56,500 Public Records
Property tax history
+10.8%/yrLatest (2025): $4,515 · -4.5% YoY. Source: county tax records.
Cash-flow waterfall
monthlySold comps — $/sqft
last 12 mo · ≤1 miLoading sold comps…